HAL Id: insu-02965235
https://hal-insu.archives-ouvertes.fr/insu-02965235
Submitted on 14 Oct 2020
HAL is a multi-disciplinary open access
archive for the deposit and dissemination of sci-entific research documents, whether they are pub-lished or not. The documents may come from teaching and research institutions in France or abroad, or from public or private research centers.
L’archive ouverte pluridisciplinaire HAL, est destinée au dépôt et à la diffusion de documents scientifiques de niveau recherche, publiés ou non, émanant des établissements d’enseignement et de recherche français ou étrangers, des laboratoires publics ou privés.
Incipient wolframite deposition at Panasqueira
(Portugal): W-rutile and tourmaline compositions as
proxies for early fluid composition
Eleonora Carocci, Christian Marignac, Michel Cathelineau, Laurent Truche,
Marc Poujol, Marie-Christine Boiron, Filipe Pinto
To cite this version:
Eleonora Carocci, Christian Marignac, Michel Cathelineau, Laurent Truche, Marc Poujol, et al.. In-cipient wolframite deposition at Panasqueira (Portugal): W-rutile and tourmaline compositions as proxies for early fluid composition. Economic Geology, Society of Economic Geologists, 2021, 16 (1), pp.123-146. �10.5382/econgeo.4783�. �insu-02965235�
Incipient wolframite deposition at Panasqueira (Portugal): W-rutile and tourmaline
1
compositions as proxies for the early fluid composition
2 3
Eleonora Caroccia,*, Christian Marignaca, Michel Cathelineaua, Laurent Trucheb, Marc Poujolc,
4
Marie-Christine Boirona, Filipe Pintod
5 6
a Université de Lorraine, CNRS, GeoRessources, F-54500 Nancy, France 7
b Université de Grenoble Alpes, CNRS, ISTERRE, F-38041 Grenoble , France 8
c Université de Rennes, CNRS, Géosciences Rennes - UMR 6118, F-35000 Rennes, France 9
d Beralt Tin & Wolfram Portugal, 6225-051 Barroca Grande, Portugal & Instituto de Ciências da 10
Terra, Rua Campo Alegre 687, 4169-007 Porto, Portugal
11 12 Email: eleonora.carocci@univ-lorraine.fr 13 14 15 Abstract 16
The main event responsible for the deposition of tungsten at Panasqueira was closely associated 17
with strong tourmalinization of the wall rocks. Tourmaline is coeval with a W-rich rutile (up to 8-10 18
wt% W) and both minerals record an early introduction of W in the system, just before the main W 19
deposition. Uranium-Pb dating of the rutile by LA-ICP-MS yielded an age of 305.2±5.7 Ma, which 20
is 6-10 Ma older than the K-Ar age of 296.3±1.2 Ma obtained on muscovite, which was therefore 21
not coeval of wolframite. Major and trace element concentration variations in tourmaline record 22
fluid mixing between two end-members, both considered to be of metamorphic derivation on the 23
basis of REE profiles. We report evidence for a fluid enriched in Co, Cu, Pb, Sc, Sr, V, Cr, Nb, Ta, 24
Sn, interpreted to be of “local” origin, e.g., well-equilibrated with the host formations, and a fluid 25
rich in Li, F, Fe, Mn, W inferred to be of deep origin and related to biotite dehydration. The second 26
fluid carried the metals (in particular Fe and Mn) necessary for wolframite deposition, which were 27
not necessarily inherited from the wall rocks through fluid-rock interaction. Micrometer scale 28
variations in tourmaline and rutile crystal-chemistry are indicative of pulsatory fluid input during 29 tourmalinization. 30 31 32 Introduction 33 34
Tungsten (W) in western Europe, was mainly concentrated during the Variscan orogeny. The 35
total endowment is estimated to be 1.1 Mt W. The Central Iberian Zone (CIZ), which contains 210 36
kt W, is one of the main provinces. Others include the Erzgebirge (270 kt W) and Cornwall (≥425 37
kt W) (Marignac and Cuney, 2013). The Panasqueira mine in the CIZ, which has been active for 38
more than 130 years, exploits one of the largest W deposits in western Europe, with a total 39
production of 76 kt W since 1934 and estimated total resources of ~ 38 kt W (Almonty, 2016; 40
Vigne et al., 2018), i.e., an ab initio endowment of at least 115 kt W. 41
Since the 1970s, numerous mineralogical, geochemical and fluid inclusion studies have 42
discussed the genesis of the Panasqueira deposit (e.g., Kelly and Rye, 1979; Bussink, 1984; Snee et 43
al., 1988; Polya, 1989; Noronha et al., 1992; Lüders, 1996; Foxford et al., 2000; Polya et al., 2000; 44
Lecumberri-Sanchez et al., 2017; Codeço et al., 2017; Launay et al., 2018). The deposit, which is 45
hosted by the Beira schists, and overlies an inferred contact with a granite pluton (inferred from the 46
presence of a greisenized cupola), is characterized by thousands of sub-horizontal veins filled by 47
wolframite and quartz. Following Kelly and Rye (1979), most studies have concluded that the 48
granite intrusion played a major role in controlling a unique hydrothermal megacycle. Snee et al. 49
(1988) dated muscovite at 296.3±1.2 Ma (2σ), using the 40Ar/39Ar age step-heating method, and
50
considered this age to represent the approximate timing of the main W depositional stage, assuming 51
coeval crystallization of wolframite and muscovite. 52
Recent investigations carried out on the scale of the whole deposit reported observations of 53
mineral sequences synchronous with the incipient opening of the W veins. The fluid inclusion 54
record of the event in which wolframite was deposited (the OSS stage of Polya et al., 2000) was lost 55
due to decrepitation and/or deformation after wolframite crystallization (Cathelineau et al., 2017; 56
2018; Carocci, 2019), a fact which unfortunately was overlooked by all previous studies. As a 57
result, there is no reliable record of the fluids responsible for wolframite crystallization. A potential 58
way to constrain the composition of these early fluids is to study the crystal-chemistry and trace 59
element concentrations in minerals coeval with incipient wolframite deposition. Here, we 60
demonstrate that tourmaline in the wall rock, and associated rutile, were indeed coeval with 61
wolframite deposition. Both minerals display chemical zoning, taken as proxy for the evolution of 62
the fluid chemistry during their growth. Tourmaline is known to be highly stable under a wide range 63
of physico-chemical conditions (van Hinsberg et al., 2011). Its complex structure inhibits 64
significant element diffusion on available timescales (Hawthorne and Dirlam, 2011) and records 65
changes in fluid chemistry at all stages of crystal growth (Marschall and Jiang, 2011; Sluck and 66
Trumbull, 2011; van Hinsberg et al., 2011). Although several studies of the Panasqueira tourmaline 67
have examined the major element and boron isotope composition (Neiva et al., 2007; Codeço et al., 68
2017; Launay et al., 2018), none have investigated the trace element chemistry and the possibility 69
that it could record the evolution of the fluid or change(s) in the fluid source(s). 70
The main objective of this study was therefore a comprehensive analysis of tourmaline and rutile 71
chemistry in order to constrain the nature of the ore forming fluids. This resulted in a modified 72
conceptual model of the early hydrothermal system at Panasqueira. A subordinate objective was to 73
date the rutile using the in situ U-Pb method, in order to constrain the onset of hydrothermal activity 74
and provide a comparison to the published 40Ar muscovite age.
75 76
Regional background
77 78
Panasqueira is located in the Iberian Massif, which is the southern branch of the so-called 79
Iberian-Armorican Arc (IAA), at the western termination of the Variscan belt. The IAA is an 80
orocline formed in about 10 Ma at the end of the Carboniferous (Weil et al., 2013). The Iberian 81
Massif is subdivided into a number of tectonostratigraphic units (or Zones) (Julivert et al., 1972) 82
delimited by tectonic boundaries (Fig. 1). Most of these terranes are Gondwanian in origin. The 83
Central Iberian Zone (CIZ) is the main unit of a series of autochthonous terranes derived from the 84
Paleozoic Gondwanian passive margin. They were covered by a unique nappe stack (Galicia-Tras-85
os-Montes Zone and Ossa Morena Zone) (Pérez-Caceres et al., 2017). The CIZ comprises a thick 86
sequence of late Ediacarian-Cambrian metasedimentary rocks (the Schist-Greywacke Complex, or 87
Beira Group) overlain unconformably by the Early Ordovician Armorican Quartzite (Diez-88
Fernandez et al., 2013). 89
The tectono-thermal Variscan history of the CIZ, which begins in the Early Carboniferous and 90
ends in the Early Permian, is subdivided into five events, D1 to D5 (Diez-Fernandez et al., 2016, 91
and references therein; Diez-Fernandez and Pereira, 2017). The first event, D1 crustal thickening 92
and stacking of the allochthon, was dated at c. 354-347 Ma (e.g., Rubio Pascual et al., 2013). The 93
subsequent D2-D5 evolution was characterized by large-scale crustal melting, resulting from a 94
combination of mid-crustal post-thickening heating and mantle-derived heat input at the base of the 95
continental crust (Pereira et al., 2017). The D2 (c. 327-316 Ma) event recorded the first episode of 96
heat input and mid-crustal melting, with the development of migmatite domes (Fig. 1) (e.g., Llana-97
Fúnez and Marcos, 2007; Diez Fernandez et al., 2012; Rubio-Pascual et al., 2013; Pereira et al., 98
2017). Associated mafic syn-migmatitic sills and sheet-like bodies of late-kinematic monzogranite 99
and granodiorite (319-316 Ma) are widespread (e.g., Castro et al., 2003; Pereira et al., 2017). The 100
D3 to D5 evolution corresponds to a protracted sequence of episodic intra-crustal transcurrent 101
deformation, initiated at ca. 315-310 Ma by the development of km- to 10 km-sized NW-SE to N-S 102
103
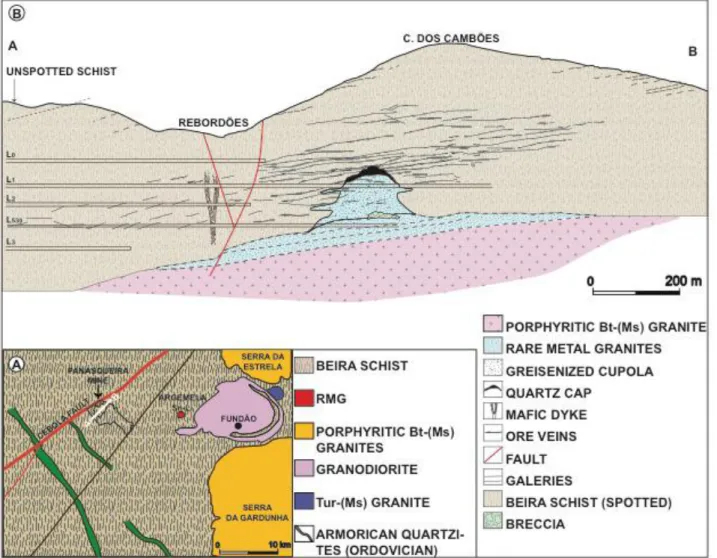
Figure 1. Geologic map of the Iberian Massif, with Panasqueira location. The map is adapted and simplified from
104
Diez Fernandez et al. (2016), with complementary data from Alcock et al. (2015), Llana-Furez and Marcos (2007),
105
Rubio Pascual et al. (2013) and Rubio-Pascual et al. (2016). BToIP: basal thrust of the Iberian Parautochthon; ET:
106
Espina thrust, JPCSZ: D4 Jusbado-Perralva do Castelo shear zone; LPSZ: Los Pedroches shear zone; OF: Onza fault;
107
PGCVD: Puente Genave-Castelo Vide detachment fault; PRSZ: Palas de Rei shear zone; PTSZ: Porto-Tomar D5 shear
108
zone; SISZ: South Iberian shear zone; VF: Viveiro fault
upright F3 folds, with a S3 axial-plane schistosity, followed by D4 (c. 309-305 Ma) left-lateral and 110
D5 (c. 304-295 Ma) dextral faulting (Diez Fernandez and Pereira, 2017; and references therein). 111
Crustal melting and concomitant mantle-derived heat input continued through D3 to D5, with the 112
pervasive emplacement of syn- to post-kinematic granite plutons, in three pulses roughly coincident 113
with the D3 to D5 events (e.g., Dias et al., 1998; Mateus and Noronha, 2010; Sant'Ovaia et al., 114
2010; Fernandez-Suarez et al., 2011). Water-absent dehydration melting (incongruent biotite 115
melting) produced cordierite-bearing diatexites in the cores of D2 migmatitic domes (Pereira 116
Gomez et al., 2000). Permian mafic dikes (290-265 Ma) testify to a mantle influence until the very 117
end of the collision (Orejana et al., 2009; Scarrow et al., 2011). 118
Numerous mineralized systems were active in the CIZ in close association with Late 119
Carboniferous tectonics and granitoid emplacement giving rise to more than 150 peri- and intra-120
granitic rare metal (Nb-Ta, Li, W, Sn) and shear-zone hosted (Au-Ag-As-Sb-Pb-Zn-Cu) deposits 121
(Tornos et al., 2000; Neiva, 2002; Mateus and Noronha, 2010; Noronha, 2017). 122
123
Geological setting and previous work
124 125
The Panasqueira W-Cu (Ag)-Sn deposit in central Portugal lies within the Central Iberian Zone 126
(CIZ) (Fig.1), in the core of a late Carboniferous anticlinorium bordered by narrow synclines of 127
Ordovician Armorican Quartzite (Fig. 2-A). The deposit consists of a dense network of sub-128
horizontal mineralized quartz veins crosscutting the subvertical foliation of the greenschist facies 129
mica-schists of the Beira Schists (Fig. 2-B). These veins crosscut numerous pods and vein-like 130
masses of barren quartz locally named “seixo-bravo” which are probably late kinematic and cover 131
an area of over six km2; their vertical extent is several hundred meters (Polya, 1989).
132
A granite body concealed beneath the deposit (Fig. 2-B) was responsible for a 6x3 km 133
metamorphic contact aureole of schists, marked by cordierite-biotite spots and cordierite-andalusite 134
assemblages. These mineral assemblages constrain the pressure to have been less than 300 MPa at 135
the time of emplacement of the Panasqueira granite (Pattison, 2001; Kuhn, 2018). A greisenized 136
cupola at the top of the granite is still observed in some of the galleries. This cupola was described 137
by Kelly and Rye (1979) as having being overlain by a quartz cap, although this has not been 138
corroborated. The greisenized cupola sits atop a sheet-like body of evolved granites that are mainly 139
evident in a few drill holes (Bussink, 1984; De Amorin, 2017), but have been encountered locally in 140
some of the deepest galleries of the mine (LB level, Barroca Grande sector: Lourenço, 2002). The 141
cupola sent out several sill-like apophyses, and towards its base, a matrix-supported breccia formed 142
with large (up to 2 m) joint-bounded hornfels clasts (Kelly and Rye, 1979). The greisenized cupola 143
144
Figure 2. Panasqueira geological setting. A. Geologic map of the Panasqueira area (redrawn from Ribeiro, 2017),
145
with location of the cross section in B. Note the tight synform roots picked out by Ordovician quartzites. B. Cross
146
section of the Panasqueira deposit (adapted from Bussink, 1984 and De Amorin, 2017)
147 148
is cut by the quartz-wolframite veins. The evolved granites are typical of the peraluminous rare 149
metal granite (RMG) family (Linnen and Cuney, 2005), and are albite-rich, displaying typical 150
“snowball” quartz textures. They contain (rare) cassiterite and columbo-tantalite as accessory 151
minerals (Lourenço, 2002; De Amorin, 2017). A porphyritic (K-feldspar megacrysts) biotite-152
(muscovite) granite (Bussink, 1984) is likely representative of the main granite body responsible for 153
the metamorphic aureole and could be related to the late D3 granites from the nearby Serra de 154
Estrela (Sant'Ovaia et al., 2010) and Serra de Gardunha (Fig. 2-A). According to recent gravimetric 155
data (Ribeiro, 2017), the main Panasqueira granite has the shape of a laccolith, with a flattened top, 156
a NNE striking elongated trend (~6.3×3.8 km) and an average thickness of 1 km, but with a 2 km 157
thick keel. The evolved granites have been dated at c. 290 Ma, by whole-rock K-Ar (Clark, 1970) or 158
Rb-Sr (Priem and Den Tex, 1984) methods. Close to the deposit, the Fundão granodiorite (Garcia, 159
2004) and the small Argemela RMG intrusion (Michaud et al., 2020) are associated with a quartz-160
cassiterite vein system (Inverno et al., 2009). 161
The Panasqueira deposit first attracted research attention in the second half of the 20th century
162
(Kelly and Rye, 1979; Polya et al., 2000, and references therein; Lourenço, 2002; Burnard and 163
Polya, 2004) and continues to be the subject of considerable interest. Jaques and Pascal (2017) and 164
Jacques et al. (2018) addressed the tectonic and fluid pressure conditions required for the creation 165
and opening of the quartz vein system. Lecumberri-Sanchez et al. (2017), using LA-ICP-MS 166
analyses of fluid inclusions, and Codeço et al. (2017), using B-isotope data from tourmaline, 167
addressed the origin of the fluids. Launay et al. (2018) used tourmaline growth features to interpret 168
the direction and velocity of flow of the fluids. 169
170
Samples and methods
171 172
Our work is based on analyses of >250 samples collected in the late 1970s on levels 0 and 1, in 173
the historical centre of the mine, and in 2015-2016 on levels 0 to 3, to the south-west of the 174
historical zones. Following petrographic examination with an OLYMPUS BX51 (transmitted and 175
reflected light) optical microscope and a VHX-200 KEYENCE numeric microscope, selected 176
samples were studied with a Schottky-FEG (Field Emission Gun) JEOL J7600F scanning electron 177
microscope (SEM) equipped with an SDD-type EDS spectrometer at the GeoRessources Laboratory 178
(Nancy, France). Backscattered electron (BSE) images were obtained after setting the acceleration 179
voltage at 15 kV. 180
Major-element mineral compositions were determined for tourmaline and rutile using a 181
CAMECA SX100 Electron microprobe (EPMA) equipped with a wavelength dispersive 182
spectrometer (WDS) and a Schottky-FEG (Field Emission Gun) JEOL J7600F scanning electron 183
microscope (SEM) equipped with a SDD-type EDS spectrometer at the GeoRessources Laboratory 184
(Nancy, France). The analytical conditions were a 12 nA current and an accelerating voltage of 15 185
kV for the EPMA, and a 1 nA current and an acceleration voltage of 15 kV for the SEM, with a 186
counting time of 10 s. The same natural and synthetic oxides and silicate standards were used for 187
the two types of analyses. For tourmaline analysis, these standards were topaz (F), albite (Na), 188
olivine (Mg), orthoclase (Si, K), wollastonite (Ca), MnTiO3 (Ti, Mn) and hematite (Fe). For rutile
189
analysis, the standards were TiO2 (Ti), Cr2O3 (Cr), vanadinite (V), hematite (Fe), LiNbO3 (Nb),
190
LiTaO3 (Ta), cassiterite (Sn) and scheelite (W).
191
Trace and rare earth elements in tourmaline were analyzed at the GeoRessources Laboratory, 192
using a 193 nm GeoLas Pro ArF Excimer laser at 5 Hz laser frequency, the aerosols being analyzed 193
with an Agilent 7500c Quadrupole ICP-MS. The analytical settings for laser ablation are detailed in 194
Leisen et al. (2012) and Lach et al. (2013). Laser ablations were performed with a constant fluence 195
of 10 mJ.cm-2 and a constant repetition rate of 5 Hz. Helium was used as a carrier gas to transport
196
the laser generated aerosols from the ablation cell to the ICP-MS. Before entering the ICP torch, 197
Helium was mixed with Argon at a typical flow rate of 0.5 l.min-1. The hole produced by the laser
198
was 24 µm in diameter, except for REE measurements, for which it was 120 µm in diameter. A 199
peak hopping ablation mode was initiated ~ 20 s after the beginning of signal acquisition, in order 200
to sample the background signal before ablation (used for data reduction), and was stopped after 201
200 pulses. The return of the background signal to its initial value was checked before ablating a 202
new zone. The NIST reference glasses 610/612 were used as external standards; Si, previously 203
analysed by EPMA, was used as an internal reference. The data were processed using the Iolite 204
software (Paton et al., 2011). 205
Rutile U-Pb geochronology was conducted by in-situ laser ablation ICP-MS at Géosciences 206
Rennes using an ESI NWR193UC Excimer laser coupled to a quadrupole Agilent 7700x ICP-MS 207
equipped with a dual pumping system to enhance sensitivity (Paquette et al., 2014). The 208
instrumental conditions are reported in Appendix A1, Table A1.The ablated material was carried 209
into helium, and mixed with nitrogen and argon, before injection into the plasma source. The 210
instrument was aligned and calibrated for mass before each analytical session using the NIST SRM 211
612 reference glass, by inspecting the 238U signal and minimizing the ThO+/Th+ ratio (<0.5%).
212
During the course of an analysis, signals for 204(Pb+Hg), 206Pb, 207Pb, 208Pb, 232Th and 238U masses
213
were acquired. 214
Single analyses consisted of 20 s of background integration followed by 60 s of sample 215
integration with the laser firing and then a minimum delay of 10 s to wash out the previous sample. 216
Ablation spot diameters of 45 µm with repetition rates of 5 Hz were used for all the analyses. For 217
each analytical session, we used the following standard bracketing procedure. Two analyses of the 218
R10 rutile standard (Luvizotto et al., 2009) were used as the primary rutile reference, and one 219
analysis of the R19 rutile standard (489.5 ± 0.9 Ma, Zack et al., 2011) was used for quality control, 220
followed by six analyses of the rutile grains. This sequence was repeated three times with an 221
analysis of the R19 standard and two analyses of the R10 standard at the end of the session. 222
The data were corrected for U–Pb fractionation and for mass bias by repeated measurements of 223
the R10 rutile standard. The R19 rutile standard measurements, treated as unknowns, were used to 224
control the reproducibility and accuracy of the corrections. These standards yielded an age of 490 ± 225
3 Ma (MSWD = 1.11; n=13) during the April 2016 session and 493 ± 12 Ma (MSWD=2; n=12) 226
during the December 2017 session. The data reduction was carried out with the data reduction 227
scheme, VizualAge_UcomPbine, a set of Iolite procedures that work with Igor Pro (Chew et al. 228
2014). All the data were plotted at 2 sigma on Tera-Wasserburg Concordia diagrams using the 229
Isoplot 3.75 software (Ludwig, 2012). 230
Analyses of 40Ar/39Ar were performed at the University of Manitoba (Canada) using a
multi-231
collector Thermo Fisher Scientific ARGUS VI mass spectrometer linked to a stainless steel Thermo 232
Fisher Scientific extraction/purification line, a Photon Machines (55 W) Fusions 10.6 CO2 laser,
233
and a Photon Machines (Analyte Excite) 193 nm laser. Isotope abundances were corrected for 234
extraction-line blanks, which were determined before every sample analysis. Line blanks in both the 235
Excimer and CO2 system averaged ~3 fA for mass 40 and ~0.013 fA for mass 36. Mass
236
discrimination was monitored by online analysis of air pipettes based on a power law relationship 237
(Renne et al., 2009), which gave D = 1.0081 ± 0.0002 per amu, based on 71 aliquots interspersed 238
with the unknowns. A value of 295.5 was used for the atmospheric 40Ar/36Ar ratio (Steiger and
239
Jäger, 1977) for the purpose of routine measurement of mass spectrometer discrimination using air 240
aliquots, and correction for atmospheric argon in the 40Ar/39Ar age calculation. Corrections were
241
made for neutron-induced 40Ar from potassium, 39Ar and 36Ar from calcium, and 36Ar from chlorine
242
(Roddick, 1983; Renne et al., 1998; Renne and Norman, 2001). The data were plotted using 243
DensityPlotter (Vermeesch, 2012). Complementary information is given in Appendix A2. 244
245
Results
246 247
Petrography of the tourmalinized wall rocks
248
Tourmaline is a common mineral in the wall rocks to the W-veins in the Panasqueira deposit, but 249
may also be observed far from the deposit, bordering either barren quartz veins or even “dry” joints. 250
The tourmaline-bearing rocks extend from the vein/joint boundaries for distances varying from a 251
few cm (≤10) to 1 m, or roughly 25 cm on average. 252
As first noted by Bussink (1984), and later by Foxford et al. (1991), thin quartz veinlets (1-5 mm 253
in average) are common in the tourmaline-bearing wall rocks adjacent to the main veins, and in 254
many cases define the vein margins. They display clear evidence for a crack-seal mechanism of 255
opening, and are labelled Qcs hereafter (Fig. 3-A). 256
There is a clear organization of the tourmaline in layers parallel to S0, preserving the protolith
257
fabric, as pointed out by Codeço et al. (2017). The tourmalinized wall rocks generally contain more 258
than 50 vol.% tourmaline and tourmaline abundance is locally high enough to classify the rock as 259
tourmalinite. Tourmaline is invariably associated with quartz, and with muscovite in the most 260
pelitic protoliths, where the mica defines the schistosity. It is accompanied by abundant rutile (see 261
262
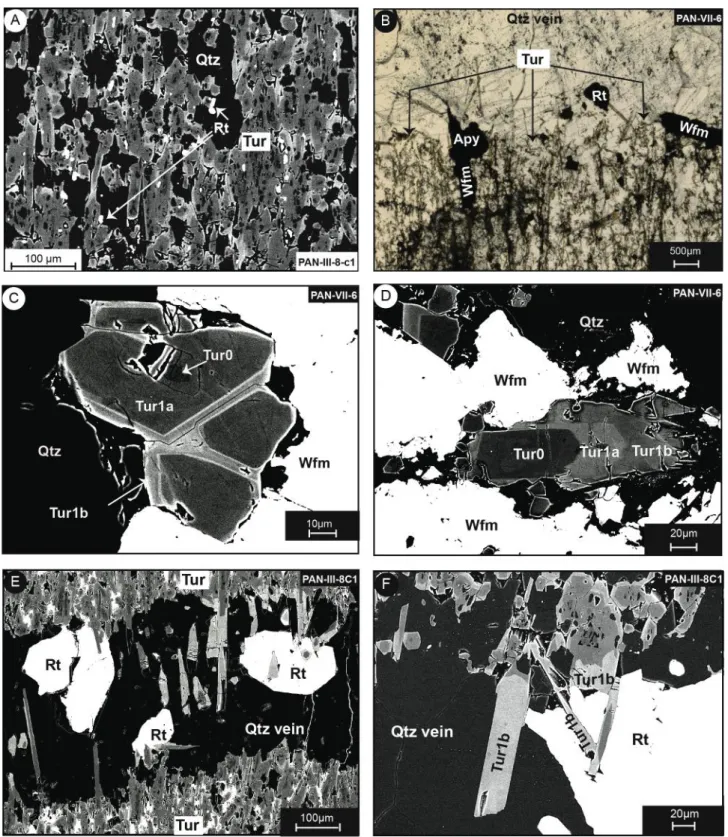
Figure 3. A. Typical tourmalinized wall-rock, with Qcs quartz veinlets. Sn, regional schistosity. Note the numerous
263
overprinting arsenopyrite (Apy) crystals. Sample PAN-III-8-c1 (NL). B. Poorly zoned tourmaline 1 seen in natural
264
light. Sample PAN-II-8. C. Typical zoning of tourmaline 1(BSE), showing the three Tur0, Tur1a and Tur1b zones.
265
Sample PAN-I-3-1.
266 267
below), zircon and fluor-apatite and sporadic monazite or xenotime crystals, usually no more than 268
10-20 µm, and commonly only a few µm in diameter. Aggregates of micrometer-scale crystals of 269
zircon and xenotime or zircon and monazite are common. In addition to these ubiquitous 270
accessories to the tourmaline, a number of other hydrothermal minerals were later involved in the 271
alteration of the Panasqueira wall rocks, and include quartz (silicification), topaz, muscovite, 272
sulfides (pyrrhotite, sphalerite, chalcopyrite, arsenopyrite), apatite and siderite. 273
274
Tourmaline textures
275
Tourmaline habit and zoning: The tourmaline habit may be either acicular, with lengths between
276
500 µm and 1 mm and diameters of 20-50 µm, or, more commonly, stocky prismatic, with lengths 277
between 50 and 150 µm and diameters of 10-20 µm (Fig. 4-A, B). The prisms are mostly sub-278
parallel to the schistosity of the Beira schists (Fig. 4-A), but they may be perpendicular to it. 279
Contact metamorphic cordierite was replaced by tourmaline (Bloot and de Wolf, 1953). 280
The tourmaline crystals are brown and weakly zoned in thin section (Fig. 3-B), but display well- 281
characterized growth zoning in SEM images (Fig.3-C and 4-C, D) expressed as nearly homogenous 282
283
Figure 4. A. Typical early assemblage in the tourmalinized wall-rock, with Tur1 elongated along (erased) schistosity
284
and disseminated rutile. Sample III-8-c1 (SEM). B. Acicular tourmaline in a silicified wall-rock. Sample
PAN-285
VII-6-b1 (NL).). C-D. Evidence for coeval growth of Tur1b and early wolframite: C. Wolframite growth inhibited the
286
development of Tur1b zones; D. Wolframite growth progressively inhibited first Tur1a, then Tur1b growth. Sample
287
VII-6-b1 (SEM). E-F. Evidence for coeval growth of Tur1b and the W-rich rutile in a Qcs veinlet. Sample
PAN-288
III-8-c1 (SEM).
289 290
zones of variable grey intensity, with sharp boundaries. A dark irregularly shaped core is commonly 291
present, although not systematically, but there is no evidence for sector zoning. These cores are 292
interpreted to be relicts of the early tourmaline and are labelled Tur0 hereafter. The outer parts of 293
the tourmaline prisms comprise a medium grey zone, labelled Tur1a and a clearer rim, labelled 294
Tur1b. In rare cases, there is an outermost rim characterized by the recurrence of a darker hue. 295
296
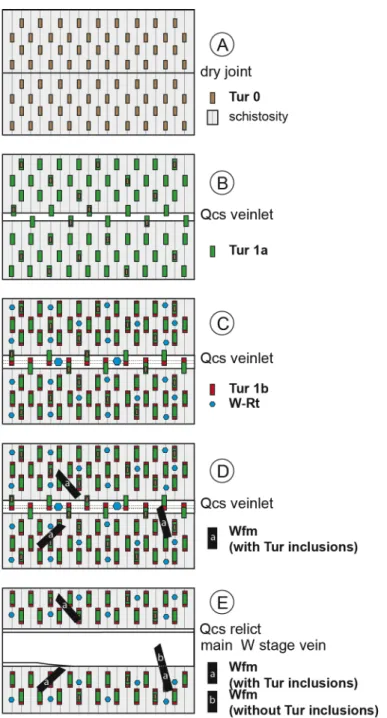
Figure 5. Synthesis of the stage Ia tourmalinization. A. Initialization of alteration (Tur0) in relation to simple “dry”
297
joints. B. Main tourmaline development (Tur1a) and first increments of opening in Qcs veinlets. C. Growth of Tur1b
298
tourmaline relative to increments of Qcs opening and coeval rutile growth. D. Local variant with early wolframite
299
growing in the wall-rock coevally with Tur1b. E. Transition to the main wolframite deposition stage
300 301
Some changes in the relative proportions of the different zones may be observed in relation to the 302
distance from the vein boundaries. Distal to veins, the proportion of Tur0 zones is higher, on 303
average these zones are wider, locally the crystals display regular (prismatic) shapes and the 304
development of Tur1b rims is less pronounced. Furthest from the veins, the Tur1b rim may even be 305
absent. Close to the veins, there is a greater development of the Tur1b zone, and the Tur0 cores are 306
less common, corroded, and tend to represent a comparatively smaller proportion of the crystal 307
volume. On the basis of a limited number of examples, it would appear that this tendency is roughly 308
correlated with the presence of abundant wolframite in the nearby vein. Indeed, in the wall rocks of 309
barren quartz veins, either in outcrop, or in the deeper levels of the mine (L3), Tur1b is usually 310
absent. 311
Micro-inclusions are common in the tourmaline, although not systematically distributed. In order 312
of importance, they are: zircon, rutile, quartz, and rare monazite, pyrite, and apatite. Most 313
commonly, the inclusions “overprint” the zone boundaries, and in most cases, the proportion of 314
inclusions is the same in the Tur1a or Tur1b zones. The Tur0 cores are relatively free of inclusions, 315
except for those of quartz. The zircon may be zoned in respect to their U-Th content. In addition, 316
microanalysis revealed the probable presence of concealed micro-inclusions (see below). 317
Tourmaline and Qcs quartz veinlets: Tourmaline prisms are systematically present at the walls
318
of the Qcs veinlets, displaying both Tur1a and Tur1b zones, the latter usually developed to a far 319
higher extent than in the wall rocks (Fig.4-E, F). Thus, as pointed out by Foxford et al. (1991), the 320
development of both the main Tur1a tourmaline prisms and the Tur1b rims was coeval with the first 321
increments of vein opening evident by the Qcs veinlets. This is pictured schematically in Fig. 5. The 322
very existence of Tur0, which is typically absent from the Qcs veinlets, nonetheless demonstrates 323
that the onset of tourmalinization was earlier than these veinlets (stage A in Fig. 5). 324
Tourmaline and other alteration minerals: Irrespective of the nature and the number of
325
hydrothermal minerals in the wall rocks, the tourmaline crystals invariably display the same 326
sequence of Tur0-Tur1a-Tur1b crystallization. Other alteration minerals are typically later. For 327
example, the occurrence of topaz and/or muscovite is accompanied by a distinct overgrowth on 328
Tur1b rims. In the same way, the development of apatite-bearing vugs in the tourmalinized wall 329
rocks was accompanied by distinct overgrowths on the undissolved tourmaline crystals. As sulfides 330
(chalcopyrite, sphalerite, pyrrhotite) and siderite are mainly present as stringers in the wall rocks, it 331
is easy to recognize that these stringers overprint tourmaline 1 prisms and their characteristic 332
zoning. 333
Small euhedral arsenopyrite crystals, a few 100 µm in diameter, are frequently disseminated in 334
the wall rocks (Fig. 3-A), locally (but not commonly) with inclusions of zoned tourmaline prisms. 335
Nevertheless, arsenopyrite grew after the Tur0-Tur1a-Tur1b sequence, because: (i) arsenopyrite 336
mostly replaced tourmaline prisms, and (ii) arsenopyrite overprinted Qcs veinlets (Fig. 3-A). 337
Tourmaline and wolframite: Wolframite from the mineralized veins is not, as a rule, associated
338
with tourmaline but developed as large crystals along the walls of the open fractures. There are rare 339
occurrences of the development of wolframite crystals in the wall rock, close to the mineralized 340
veins (Fig. 4-B). These crystals include zoned tourmaline, and detailed observations show that 341
wolframite growth was either coeval with Tur1b rim development or slightly later (Fig.4-C, D). 342
This wolframite was, in turn, reworked in relation to the main opening and deposition of the main 343
wolframite, which is consistently devoid of any tourmaline inclusions (stages E and F in Fig. 5). 344
345
Rutile textures
346
Rutile is systematically associated with tourmaline, being present both in the wall rocks, as small 347
(from 10 µm to 80-100 µm) crystals, scattered or densely disseminated, or as large (up to 500 µm or 348
more) isolated crystals in the Qcs veinlets, where they were clearly coeval with Tur1b growth (Fig. 349
4-E, F). Micro- to nano-inclusions (from about 1 µm, to <100 nm) of wolframite are common. They 350
are usually located at crystallographic boundaries (e.g., faces intersections, twin planes, quartz 351
inclusion boundaries) showing that they were coeval with the host rutile (Fig. 6-A). Their 352
compositions, estimated from SEM-EDS measurements, are ferberitic, with Fe/Fe+Mn ratios 353
between 0.67 and 0.83. 354
355
Figure 6. Panasqueira rutile. A, B, C: Back-scattered SEM images. of Panasqueira rutile. A. Crystal aggregate from
356
the wall-rock of a wolframite-bearing vein. Note the primary wolframite nano-inclusions (Wfm). B. Crystal in the wall
357
rock of a barren vein from the deep L3 level. Note the ilmenite lamellae (Ilm) and the late apatite (Ap), overprinting the
358
rutile crystal. C. Large isometric crystal from a Qcs vein in the wall-rock of a wolframite-bearing vein. Note the
359
superimposition of sector zoning (SZ) on the compositional (oscillatory) zoning. Square: location of images D to G. D
360
to G: false-color X-ray (EPMA) images, showing the differential effect of SZ on the minor element concentrations, and
361
the anti-correlation of W and Nb in the OZ.
In the barren wall rocks, rutile crystals are less abundant and are characterized by the presence of 363
inclusions of ilmenite lamellae (Fig. 6-B). 364
365
Tourmaline chemical composition
366
Major element crystal chemistry: For reasons made explicit in Appendix A0, most analyses were
367
performed using SEM-EDS. A total of 86 crystals from 19 representative samples was analyzed 368
(Appendix A3: Table A3). No systematic variation in the compositions of the different zones was 369
evident, however, either as a function of the distance to the vein boundary, or among tourmaline 370
crystals from different settings (wall rock, Qcs veinlet, inclusions in early wolframite). 371
The structural formulae were calculated by normalizing to 26.5 (O, OH, F), which (with the 372
assumption of stoichiometric boron) allowed us to take into consideration the fluorine content and 373
not assume the filling of the Y site, which may contain Li, and possibly vacancies (Bosi, 2018). The 374
generalized structural formula of the tourmaline super-group is XY3Z6(T6O18)(BO3)3V3W (Bosi,
375
2018). The T site is occupied primarily by Si, which may be replaced by minor Ti, Al or B. The 376
nine-coordinated site X may be occupied by Na+ and Ca2+, or minor K+, and vacancies (X ) may be
377
present. This defines the main chemical groups of tourmaline: alkali, calcic and alkali-deficient 378
groups (Henry et al. 2011). The V, or (O)3, site is occupied mainly by OH (and possibly O), 379
whereas the W, or (O)1, site is occupied by OH, F or O, defining the hydroxy, fluor, and oxy 380
groups, depending on the dominant anion in the site. The six-coordinated Z site is mainly occupied 381
by trivalent cations (mainly, Al3+, butalso Fe3+, Cr3+), but may contain divalent cations, mainly Mg
382
(Bosi, 2018). The six-coordinated Y site is occupied by mono- (Li+), bi- (Mg2+, Fe2+, Mn2+) and
tri-383
valent (mainly Al3+, and possibly Fe3+, Cr3+) cations, but vacancies (Y ) may also be present (Bosi,
384
2018). Following the criteria of Henry and Dutrow (2011), calculated tourmaline formula were 385
rejected if Si was > 6.15 atoms per formula unit (apfu), the sum of the Y + Z + T cations was >15.5 386
apfu, or the sum of the X-site cations exceeded 1.1 apfu. For reasons given in Appendix A0, all
387
analyses yielding Si apfu values > 6.12 were rejected. Using the empirical formula of Bosi (2018), 388
the ZAl apfu content of the Z site was found to be relatively constant, ~5.23 apfu, irrespective of the
389
zone, and, whereas there was sufficient Mg to fill this site in Tur0 and Tur1a, a small 390
complementary content of ZFe was necessary in Tur1b (Table A3, Appendix A3).
391
Based on the classification diagram of Henry et al. (2011), which compares the normalized X-392
vacancy to the Mg# (Mg/Mg+Fe) ratio, the tourmaline classifies mainly as schorl (Fig. 7-A). There 393
is a systematic shift from Mg-rich (ferro-dravite) to Fe-rich compositions for the sequence Tur0 to 394
Tur1a to Tur1b, and a tendency towards foitite compositions. Indeed, as shown in Figure 7-B, the 395
X-site vacancy is between ~0.2 and ~0.6 pfu (and thus, the Panasqueira tourmaline trends toward 396
397
Figure 7. Crystal chemistry of the Panasqueira tourmaline, illustrating the characteristics of the Tur0, Tur1a and
398
Tur1b zones. Note in all the diagrams the continuity of composition variations among the three zones. A. Classification
399
diagram. B. Al vs. X-site lacune diagram, demonstrating the presence of a foitite component. C. Fe vs. Mg diagram,
400
illustrating the presence of an oxy-schorl component, together with the classical schorl-dravite exchange vector. D.
401
Linear relationships between F and the X-site charge; the forbidden zone and references are from Henry and Dutrow
402
(2011): grey domain, worldwide tourmaline (~ 8,900 values); light blue line: Cruzeiro gold mine fibrous tourmaline;
403
dashed blue line: McCombe pegmatite tourmaline (magmatic trend). E. Na + R2+ vs. Al+X-site lacune diagram,
404
illustrating the deviation from the schorl (dravite)-foitite (Mg-foitite) exchange line due to a combination of the
oxy-405
schorl (dravite) exchange vector and a vector responsible for the creation of Y-site vacancy. F. Fe vs. Al diagram,
406
showing the combination of all exchange vectors involved in the Panasqueira tourmaline.
407 408
alkali-deficient species) corresponding to the operation of the Al+1x +1Na-1R2+-1 vector, which leads
409
to a solid solution between schorl-dravite and foitite-Mg-foitite. From Figure 7-C, E and G, it is 410
evident that other vectors combined to displace the observed trends from the preceding trend. The 411
Al+1O+1(OH)-1(Mg, Fe)-1 vector seems to have been particularly important, implying an oxy-schorl
412 1.0 0.8 0.6 0.4 0.2 0.0 0.0 0.2 0.4 0.6 0.8 1.0 Mg/Mg+Fe foitite oxy-foitite Mg-foitite oxy-Mg-foitite schorl dravite X X /(Na + ) 5.0 6.0 7.0 8.0 0.0 0.2 0.4 0.6 0.7 1.0 Al apfu apfu X oxy-dravite oxy-foitite Mg-foitite foitite oxy-schorl oxy-Mg-foitite dravite schorl uvite +1 Al+1 Na-1R2+-1 Al+1O+1(OH)-1R2+ -1 Fe3+ +1Al-1 3.0 2.0 1.0 0.0 0.0 1.0 2.0 3.0 Fe apfu Mg apfu Fe3+ +1O+1(OH)-1Mg-1 Al+1O+1(OH)-1Mg-1 Fe3+ +1Al-1 Mg+1Fe2+-1 schorl oxy-schorl oxy-dravite povondraite dravite 0.0 5.0 6.0 7.0 1.0 2.0 3.0 Fe apfu Al apfu +1Al+2R2+-3 Y Al+1O+1(OH)-1Mg-1 Al+1O+1(OH)-1Fe2+-1 Fe3+ +1Al-1 Mg+1Fe2+-1 povondraite schorl dravite Mg-foitite foitite oxy-dravite oxy-schorl 4.0 3.0 2.0 5.0 6.0 7.0 8.0 Na + R 2+ apfu + Al apfu X +1 Al +1 Na -1R2+ -1 Al+1O+1(OH)-1R2+-1 Fe3+ +1Al-1 +1Al+2R2+-3 Y schorl dravite foitite Mg-foitite oxy-schorl oxy-dravite 0.0 0.2 0.4 0.6 0.8 1.0 1.2 1.4 0.0 0.2 0.4 0.6 0.8 1.0 charge in X-site F apfu forbidden zone Tur0 Tur1a Tur1b A C D F E B
(or oxy-dravite) component, but the intervention of another exchange vector Y
+1Al+2R2+-3, 413
responsible for an site vacancy (Bosi, 2011), seems to have been equally important. Indeed, a Y-414
site vacancy is observed in our analyses, commonly larger than 0.1 apfu, and also those of Codeço 415
et al. (2017) and Launay et al. (2018) (Table 3, Appendix 3). This vacancy cannot be due to ignored 416
Li, because the LA-ICP-MS results (see below) show that the Li content is negligible, being at most 417
of ~330 ppm and averaging ~170 ppm (Tur1a) or ~290 ppm (Tur 1b); these contents would be 418
reflected by an amount of no more than 0.05 apfu Li and more commonly 0.02-0.04 apfu. 419
420
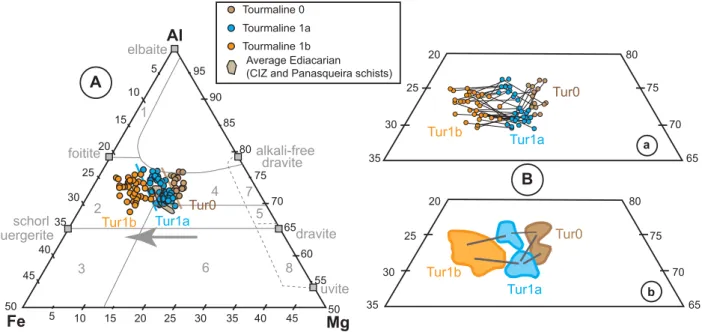
Figure 8. A. AFM diagram for the Panasqueira tourmaline, with location of the main tourmaline end-members.
(1)-421
(8) reference fields from Henry and Guidotti (1985): (l) Li-rich granitoids, (2) Li-poor granitoids, (3) Fe3+-rich
quartz-422
tourmaline rocks (hydrothermally altered granites), (4) Al-buffered metapelites, (5) not Al-buffered metapelites, (6)
423
Fe3+-rich quartz-tourmaline rocks, calc-silicate rocks, and metapelites, (7) low-Ca meta-ultramafics and Cr,V-rich
424
metasediments, and (8) metacarbonates and meta-pyroxenites. Compositions of CIZ schists from Oosterom et al. (1984)
425
and De Amorin (2017). The grey arrow emphasizes the global increase in Fe/Fe+Mg ratio from Tur0 to Tur1b. B.
426
Enlargement of A, illustrating the sequence Tur0-Tur1a-Tur1b: (a) individual paths, (b) synthesis. Note that, if there is a
427
jump from a zone to another, the starting and final compositions differ for each individual crystal.
428 429
In contrast to Tur0, which appears to be essentially free of fluorine, there is a distinct and similar 430
fluorine enrichment (up to ~1% F) of Tur1a and Tur1B, and a trend of increasing F apfu with X-site 431
charge (Fig.7-D). The latter is due to the high X-site Na content; Tur1a and Tur1b are Ca-poor, 432
whereas Tur0 is enriched in Ca, which, in turn, explains the higher X-site charge of Tur0 in Figure 433
7-D. 434
The complex covariations between aluminum, iron and magnesium that are depicted in Figure 7 435
are conveniently summarized in the AFM diagram of Figure 8-A, in which it is also possible to 436
identify the most common compositional paths from Tur0 to Tur1a and then Tur1b at the crystal 437 80 75 70 65 35 20 25 30 Tur0 Tur1a Tur1b Tourmaline 0 Tourmaline 1a Tourmaline 1b Average Ediacarian (CIZ and Panasqueira schists)
A a b 95 90 85 80 75 70 65 60 55 5 10 15 20 25 30 35 40 45 50 5 10 15 20 25 30 35 40 45 50 Al Fe Mg alkali-free dravite dravite schorl buergerite uvite foitite elbaite 6 8 5 7 4 3 2 1 Tur0 Tur1a Tur1b 20 80 75 70 65 25 30 35 B Tur0 Tur1a Tur1b
438
Figure 9. Profile of the Fe# ratio (Fe/Fe+Mg) along an acicular prism of tourmaline 1 (EPMA analyses), compared to
439
the false color X-image of the same crystal (sample PAN-VII-6-b2). The height of the elliptical symbol corresponds to
440
the estimated error on Fe#. Of the three zones (Tur0, Tur1a, Tur1b) seen on the X-image, only the two latter are
441
documented in the profile. At the rim of Tur1b zone, a recurrence of low Fe# is observed ®. Note the second and third
442
order modulations of the Fe# ratio along the profile. c: microcrack filled by Tur1b.
443 444
scale (Fig. 8-B). This figure illustrates an apparently continuous variation of the Fe to Fe+Mg ratio 445
(Fe#) from Tur0 to Tur1b, although detailed profiles show that there were small-scale modulations 446
of the Fe# during crystal growth (Fig. 9). 447
Trace element contents: As LA-ICP-MS analyses produce laser pits with a diameter of at least
448
24 µm, analysis to the desired detection limits was possible only for the largest Tur1 zones in a 449
limited number of crystals. Moreover, the tourmaline cores (Tur0) were too small for them to be 450
reliably analyzed, so analyses were restricted to the two external rims, Tur1a and Tur1b. A total of 451
77 spots, in 47 crystals from 7 samples were analyzed for their trace element concentrations. The 452
REE concentrations were also analyzed, but to obtain the required signal, a laser beam diameter of 453
120 µm was necessary, and therefore only two crystals, from two samples, could be analyzed for 454
the REE. This yielded an average composition of Tur1a and Tur1b zones from the two crystals. The 455
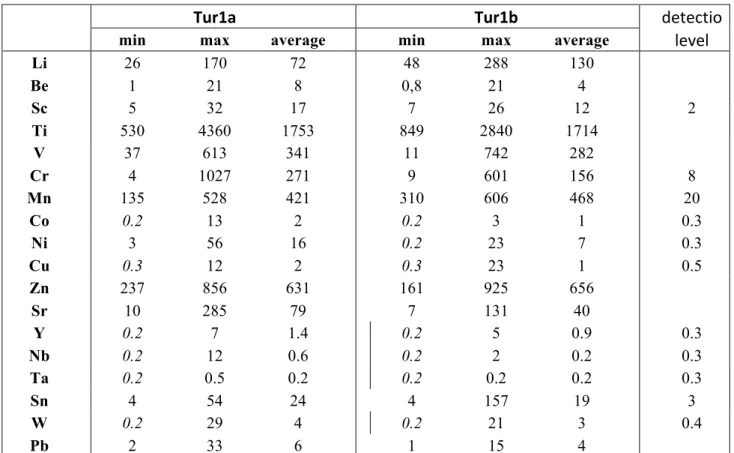
results are summarized in Table 1 and detailed in Appendix A4 (Table A4). 456
For some elements, several LA-ICP-MS spectra displayed anomalous peaks (anomalous values 457
in Table A4), interpreted as recording the presence of concealed micro- to nano-inclusions. Thus, a 458
Mn outlier at 2,600 ppm was likely due to siderite, and a Zn outlier at 8,500 ppm is interpreted to be 459
due to sphalerite. Several W anomalies record the presence of W-bearing minerals: W-bearing 460
rutile, where correlated with both Ti and Nb-Ta-Sn anomalies; cuprotungstite, where correlated 461
Tur1a Tur1b detectio
min max average min max average level
Li 26 170 72 48 288 130 Be 1 21 8 0,8 21 4 Sc 5 32 17 7 26 12 2 Ti 530 4360 1753 849 2840 1714 V 37 613 341 11 742 282 Cr 4 1027 271 9 601 156 8 Mn 135 528 421 310 606 468 20 Co 0.2 13 2 0.2 3 1 0.3 Ni 3 56 16 0.2 23 7 0.3 Cu 0.3 12 2 0.3 23 1 0.5 Zn 237 856 631 161 925 656 Sr 10 285 79 7 131 40 Y 0.2 7 1.4 0.2 5 0.9 0.3 Nb 0.2 12 0.6 0.2 2 0.2 0.3 Ta 0.2 0.5 0.2 0.2 0.2 0.2 0.3 Sn 4 54 24 4 157 19 3 W 0.2 29 4 0.2 21 3 0.4 Pb 2 33 6 1 15 4
Table 1. Summary of LA-ICP-MS trace element analyses for the Panasqueira tourmalines. All contents in ppm. For
462
the purpose of average calculations, the bdl (below detection level) in Table A4 were taken at half the detection level
463
values (i.e., the without bias best estimates) when needed (italics). As a result, the averages for Nb (0.2 ppm) and Ta
464
(0.2 ppm) are not provided in the table.
465 466
with a Cu anomaly (a rare occurrence); and wolframite, where no correlation was observed with 467
either Ti or Cu. Most of these W anomalies were found in the Tur1b zones. 468
The results of the trace element analyses are illustrated in Figure 10-A (trace elements except 469
REE) and Figure 11 (REE profiles). As seen in Figure 10-A, Ti, (530 to 4,360 ppm), Zn (160 to 930 470
ppm) and Mn (135 to 600 ppm) are the most abundant trace elements, followed by Li (40 to 330 471
ppm), V (10 to 740 ppm) and Cr (10 to 1,000 ppm). Strontium (7 to 285 ppm) and Sn (4 to 160 472
ppm), are present in lower concentrations, followed by Sc (5 to 30 ppm), Be (3 to 20 ppm), and Pb 473
(1 to 18 ppm). Concentrations of other elements were commonly below the detection level (bdl), 474
e.g., Ni (up to 56 ppm), Co (up to 13 ppm) and Y (up to 7 ppm). Most measured tungsten 475
concentrations were between 0.4 and 30 ppm, but for ~25 % of analyses of Tur1a and 50 % of 476
Tur1b, the W concentration was below the detection level of 0.4 ppm. The measured concentrations 477
for Nb are between 0.1 and 3.2 ppm, but for ~ 75% of the analyses, they were below the detection 478
level of 0.3 ppm; the few measured Ta values were between 0.3 and 1.6 ppm; the overwhelming 479
majority of analyses yielded values below the detection level of 0.3 ppm. From the limited REE 480
data, the ∑REE concentration is low (between 1.2 and 12 ppm), and the REE profiles are 481
characterized by high LaN to YbN ratios of 6.37 to 6.77, and slightly negative EuN/Eu*N anomalies 482
(0.65 to 0.83) (Fig. 11). 483
484
Figure 10. Trace-element patterns in Panasqueira tourmaline 1. A. Box plots of LA-ICP-MS results for tourmaline 1a
485
and 1b. The full box represents the lower quartile to upper quartile interval. The whiskers represent the 5%-95%
486
interval. Black circle: average value, black vertical line: median value. Open circle: outlier value, comprised in the 5%
487
lowest or highest data. Inset: normalization of average values of Tur1a to the Tur1b reference. B. Comparison of
trace-488
element distribution (average values) between Panasqueira tourmaline 1a and Beira schists. The elements are arranged
489
from left to right in accordance with their increasing concentration in tourmaline 1a. Data for Beira schists are from De
490
Amorin (2017), Bussink (1984), Oosterom et al. (1984), Pinto (2014) and Valladares et al. (2002).
491 492
From Figure 10-A, it can be seen that Tur1a and Tur1b compositions are quite similar, although 493
there are minor but significant differences between them with most of the trace elements being 494 Ti Zn 104 103 102 10 1 0.1 Mn V Cr Sn Sc Be W Pb Cu Co Y Nb Ta Ni ppm Pinto Beira schists Tur1a De Amorin Bussink Oosterom Valladares 0.1 1 10 100 1000 ppm Ti Zn Mn V Cr Li Sr Sn Sc Ni Pb Be W Cu Co Y Ta Sr Li Sr W Y Be Pb V Mn Zn Li Ni Ta Cr Cu Sc Sn Ti Co 1 10 Tourmaline 1a outlier Tourmaline 1b +Nb Normalized averages Tur1a/Tur1b A B
495
Figure 11. Chondrite-normalized REE profile for the Panasqueira tourmaline (samples PAN-I-3-c2 and
PAN-III-8-496
c1) compared to the profiles for the Panasqueira metasediments (1: De Amorin, 2017), the fluids associated to the
497
Sarekoubu orogenic gold deposit (2: Xu et al., 2008), the Yellowstone spring water (3: Lewis et al., 1997) and
498
magmatic-derived fluids (4: Banks et al.,1994; 5: Poitrasson et al.,1995) (explanations in the text).
499 500
depleted in Tur1b relative to Tur1a. The notable exceptions to this are Li, Mn and Zn, which are 501
depleted in Tur 1a. This is also evident from the differences in the average values (Table 1, and 502
insert in Figure 10-A), and from the shift between the full boxes (lower quartile to upper quartile 503
interval) in the box plot of Figure 10-A. 504
A principal component analysis was performed on the trace element data (using the JM Pro 505
software), the results of which are presented in Figure 12. Three axes (PC1-3) explain 52.7 % of the 506
507
Figure 12. PCA analysis of the trace element composition of the Panasqueira tourmaline, allowing the definition of
508
several groups of trace elements, namely: Mn-Zn-Li, Cr-V-Sc, Co-Ni-Sr-Y-Sn, Be-Pb, and Nb-Ta (explanations in the
509
text).
510 511
variance. The first axis (PC1) clearly distinguishes Tur 1a and 1b, as well as two groups of 512
elements: a group A (Li-Mn-Zn) and a group B (nearly all other elements) reproduce, as expected, 513
the relationship observed in Figure 10. The PC2 and PC3 axes display correlations within group B, 514
providing evidence of several subgroups, namely: Co-Ni-Sr-Y-Sn, Cr-V-Sc, Nb-Ta and Pb-Be. 515
Copper, Ti, and W behave independently, and W appears uncorrelated to Nb-Ta. 516
In binary plots, elements of group A display rough linear trends expressing positive correlations 517
(when outliers are excluded), as seen for example in Figures 13-A to C, and predicted by the 518
principal component analysis. Similarly, elements of group A display negative correlations with 519
elements of group B, as seen, for example, in Figures 13-D to H. Less expected were the linear 520 1.0 0.5 0.0 -0.5 -1.0 -1.0 -0.5 0.0 0.5 1.0 Ti Nb Ta V Cr Be Sc Pb Sr Y Ni Sn Co Cu W Li Zn Mn PC1 PC2 40.1 % 14.8 % 25.3 % 10 5 0 -5 -10 -10 -5 0 5 10 PC1 PC2 25.3 % 14.8 % 40.1 % Tur 1a Tur 1b 1.0 0.5 0.0 -0.5 -1.0 -1.0 -0.5 0.0 0.5 1.0 Ti Nb Ta V Cr Be Sc Pb Sr Y Ni Sn Co Cu W Li Zn Mn PC1 PC3 38.3 % 12.6 % 25.3 % 10 5 0 -5 -10 -10 -5 0 5 10 PC1 PC3 25.3 % 12.6 % 38.3 % Tur 1a Tur 1b
521
Figure 13. Binary plots of selected trace elements from Panasqueira tourmaline, showing contrasting behaviour,
522
including positive, negative and null correlations, depending on the elements (explanation in the text).
523 524 W (ppm) Ta+Nb (ppm) 1 1 30 N O Sc (ppm) Sc (ppm) 10 100 J Sr (ppm) 100 Ta+Nb (ppm) Sn (ppm) 1 100 Li (ppm) 10 30 D Sc (ppm) 1000 100 Cr (ppm) 100 30 Li (ppm) F 10 20 Sn (ppm) 10 100 K 100 10 Sn (ppm) 100 30 Li (ppm) G 50 0 Ni (ppm) 200 300 50 Li (ppm) E 1000 100 200 35 Li (ppm) B 1 Ta+Nb (ppm) 200 100 30 Li (ppm) L Tourmaline 1a Tourmaline 1b PAN-II-8 PAN-I-3.1 PAN-I-3.2 PAN-III-8-c1 PAN-VII-6-b1 PAN-VII-6-b2 PAN-VIII-5a 10 1 W (ppm) 200 100 30 Li (ppm) M 1 10 W (ppm) 100 10 Sn (ppm) P Mn (ppm) 1000 200 Zn (ppm) C 100 1000 Li (ppm) 100 200 A Zn (ppm) Mn (ppm) 1000 30 1000 100 V (ppm) Cr (ppm) 30 100 I 10 Mn (ppm) 1 10 Ni (ppm) H 1000 10 20
relationships between elements from the various B subgroups, as seen for example in Figures 13-I 525
to K. The rare metals (W, Nb, Ta) behave differently. Whereas Nb-Ta show a very loose negative 526
correlation with Li (Fig.13-L), there is no correlation between W and Li (Fig. 13-M), nor between 527
W and Nb-Ta (Fig. N). Finally, Sn is not correlated with Nb-Ta (Fig. O) or with W (Fig. 13-528 P). 529 530 Rutile composition: 531
The composition and zoning of the Panasqueira rutile have been described in detail in Carocci et 532
al. (2019) and only a summary is given here. This rutile contains variable proportions of: Fe from 533
0.18 to 2.95 wt%, V from <1000 ppm to 3.48 wt%, Cr from <1000 ppm to 2.41 wt%, Nb from 534
<1000 ppm to 1.64 wt%, Ta from <1000 ppm to 2.17 wt%, and W from 0.20 to 10.7 wt%. Despite 535
locally high values, Nb and Ta concentrations are usually low; the Nb+Ta content is usually < 0.5 536
wt% and the Nb/Nb+Ta ratio varies from 0.05 to 0.97 (on average 0.6). 537
The crystals display marked sector zoning, exhibited mostly by W and Fe and, to a lesser extent, 538
by Nb and Ta; Sn, V (and Cr), and display less evidence of zoning (Fig. 6- C to G). The maximum 539
W concentration varies from 1.12 to 10.7 wt.% in the metal-rich sectors, depending on the sample; 540
W concentrations in the metal-poor sectors vary between 0.26 to 1.40 wt %. As metal-rich sectors 541
reach their highest W contents in wall rocks adjacent to veins in which wolframite is abundant, 542
whereas in barren wall rocks the metal-rich sectors are less endowed in W (no more than 3.5 wt% 543
W), it would appear that the W enrichment in rutile is related to the wolframite endowment in the 544
nearby veins. Association of a very W-rich rutile with wolframite was also observed in the Puy-les-545
Vignes breccia-pipe tungsten deposit in the French Massif Central (Harlaux, 2016). 546
The sector zoning is superimposed on a conspicuous compositional zoning, expressed from the 547
crystal scale down to the 10 µm to µm scale of the doublets characteristic of oscillatory zoning (Fig. 548
6-C). The zoning, however, is qualitatively and quantitatively the same irrespective of the rutile 549
setting. All the minor elements, W, Nb(Ta), Fe, V, Cr and Sn, are involved in the compositional 550
zoning. At all scales, W and Nb(Ta) are inversely-correlated, whereas Sn and V display inconsistent 551
behavior, being either correlated with Nb(Ta) and inversely-correlated with W or the opposite. 552
The bulk evolution during crystal growth was variable from one crystal to the next, even at the 553
sample scale. In some crystals, there is continuous evolution from a Nb-rich and W-poor core to a 554
Nb-poor and W-rich rim, whereas the opposite is observed in others. Most commonly, however, the 555
zoning displays moderate deviations from the average W content. 556
557
Age determinations
559
Figure 14. Results of U-Pb age determinations of wall-rock Panasqueira rutile (Tera-Wasserburg Concordia
560
diagrams). Note the highly discordant behaviour of the rutile. A. All data, showing the importance of lead loss in the
561
rutile crystals. B. Data remaining after elimination of analyses more affected by lead loss. C. Idem, with data
562
constrained to be consistent with the common lead value of Stacey and Kramers (1975) at c. 300 Ma. Explanations in
563
the text.
564 565
Rutile: Petrographic examination suggests that rutile from both the tourmalinized wall rocks and
566
the Qcs veinlets were coeval with the early tourmaline and the earliest wolframite deposition. 567
Unfortunately, the number of rutile crystals suitable for U-Pb dating was limited by the size of the 568
laser spot (45 µm). Some crystals from Qcs crack-seal veins are large enough to be analyzed, but 569
very few crystals in the wall rocks reach 50 µm in diameter. Thus, only 22 crystals from 5 samples 570
could be analyzed for their U-Pb isotopic compositions. 571
The analyzed crystals have variable concentrations of common lead, and low radiogenic Pb 572
contents (Appendix 6, Table A6). On a Tera-Wasserburg diagram they plot in a discordant to a very 573
discordant position, except for one sample (PAN-III-8-c1), which plots close to the Concordia 574
curve. Figure 14 illustrates three regression lines: (i) using all the data, the regression line results in 575
a discordia with a lower intercept at 302.7 ±8.9 Ma (2σ, MSWD =5.3) (Fig. 14-A), the poor quality 576
of this age determination being due to large lead losses, (ii) a discordia in which data corresponding 577
to the greater lead losses were ignored (Fig. 14-B), passes through the concordant data and yields a 578
lower intercept at 305.2 ± 5.7 Ma (2σ, MSWD = 1.9), the upper intercept yielding a common lead 579
207Pb/206Pb ratio of 0.906, which is slightly higher than the 0.855 value predicted by the Stacey and
580
Kramers (1975) model for the same age; and (iii) a discordia, anchored to the Stacey and Kramers 581
composition at 305 Ma, yielding a lower intercept at 303.7 ± 6.6 Ma (2σ, MSWD = 3.9) (Fig. 14-582
C). A similar date of 303.7 ± 6.6 Ma, with a slightly higher MSWD value of 3.9 is obtained by 583
constraining the regression to fit the Stacey and Kramers (1975) common lead composition,. A 584
critical issue is the 207Pb/206Pb value of the common lead in the CIZ at c 305 Ma. At c. 320 Ma, the
585
207Pb/206Pb ratio of the Ediacaran and Tremadocian metasediments was between 0.885 and 0.96
586
(calculated from Nägler et al. 1993, 1995 data). It thus evident that the 0.906 value for the common 587
lead in the Panasqueira rutile is in accordance with the regional values, and, consequently, the date 588
of 305.2 ± 5.7 Ma is interpreted as the best estimate for the crystallization age of the rutile. As 589
Polya et al. (2000) demonstrated that the Qcs veins immediately preceded the main opening of the 590
quartz vein system and wolframite deposition, the age of c. 305 Ma is also interpreted to be the age 591
of the main wolframite deposition. 592
593
Figure 15. Synthesis of radiometric ages for the Panasqueira deposit, comparing results of the present work with
594
those of Snee et al. (1988). Explanation in the text.
595 596
Complementary dating: To complement the U-Pb age determinations, a muscovite selvage
597
(sample PAN-XIV-181-1) was dated using the 39Ar/40Ar method at the University of Manitoba
(Canada) and yielded a good plateau age of 296±2 (1σ) Ma, which is indiscernible within the limits 599
of error (Appendix A7-Table A7) from the preceding 39Ar/40Ar age of 296.3±0.6 Ma (1 σ) obtained
600
by Snee et al. (1988) on muscovite selvages. Until now, this age was considered to be the age of the 601
main mineralization (OSS stage of Polya et al., 2000), assuming that this muscovite preceded 602
wolframite deposition. The new results show, however, that the muscovite selvages are at least 2 603 Ma younger. 604 605 Discussion 606 607
Tourmalinization: one or two fluids?
608
Tourmaline as a fluid proxy
609
According to von Goerne et al. (2001), van Hinsberg (2011), Berryman et al. (2016) and 610
Vereshchagin et al. (2018), the trace element partition coefficients between tourmaline and the 611
medium from which it crystallizes are close to unity. Thus, the relative proportions of the trace 612
elements in tourmaline reflect the relative proportions of trace elements in the fluid from which it 613
crystallized. Fluorine concentration is subject to crystallographic constraints, because of its 614
dependence on the X-charge in the structural formula (Henry and Dutrow, 2011). Within these 615
constraints, the incorporation of F into the tourmaline structure is controlled by external factors, in 616
particular, the F availability, and thus tourmaline may also be considered a F proxy. 617
In the absence of measurable fluid inclusions (FI) in the tourmalinized wall rocks at Panasqueira, 618
information on the nature of the fluids responsible for the tourmalinization can be obtained 619
indirectly, using the tourmaline composition. The major and trace element concentrations differ 620
from Tur1a to Tur1b, pointing to a change in the fluid composition. Consideration of Figure 8-A 621
and 10-A shows a shift from a Co, (Cu), Pb, Sc, Sr, V, Cr, Sn, Nb, Ta package in Tur1a, towards a 622
Li, Fe, Mn, Zn, W rich package in Tur1b. The correlations shown in Figure 13 are clear evidence of 623
a continuous evolution. This evolution could, however, have resulted from either the differentiation 624
of a single fluid or the mixing between two fluid end-members. 625
Discussion of single fluid models
626
Single fluid models for the Panasqueira system have been favored by previous workers (Bussink, 627
1984; Lecumberri-Sanchez et al., 2017; Codeço et al., 2017). Codeço et al. (2017) assumed that the 628
Fe# increase was the result of a decrease in the temperature of a single fluid, from ~ 480°-460°C 629
during alteration of the wall rocks to 360°-230°C in the mineralized quartz veins. The former 630
temperature was estimated using the Ti-in-quartz thermometer (Codeço et al., 2017), whereas the 631
latter come from earlier fluid inclusion studies (e.g., Kelly and Rye, 1979). Recent fluid inclusion 632