HAL Id: halshs-00334343
https://halshs.archives-ouvertes.fr/halshs-00334343
Submitted on 25 Oct 2008
HAL is a multi-disciplinary open access
archive for the deposit and dissemination of
sci-entific research documents, whether they are
pub-lished or not. The documents may come from
teaching and research institutions in France or
abroad, or from public or private research centers.
L’archive ouverte pluridisciplinaire HAL, est
destinée au dépôt et à la diffusion de documents
scientifiques de niveau recherche, publiés ou non,
émanant des établissements d’enseignement et de
recherche français ou étrangers, des laboratoires
publics ou privés.
French Prominence: a Probabilistic Framework
Nicolas Obin, Xavier Rodet, Anne Lacheret
To cite this version:
Nicolas Obin, Xavier Rodet, Anne Lacheret. French Prominence: a Probabilistic Framework.
Inter-national Conference on Acoustics, Speech, and Signal Processing (ICASSP), Mar 2008, Las Vegas,
United States. pp.3993-3996, �10.1109/ICASSP.2008.4518529�. �halshs-00334343�
FRENCH PROMINENCE: A PROBABILISTIC FRAMEWORK
Nicolas Obin, Xavier Rodet
IRCAM
Analysis-Synthesis team,
1, place Stravinsky,
75004 Paris
Anne Lacheret-Dujour
Universit´e Paris X, MoDyCo lab,
92001 Nanterre
& Institut Universitaire de France,
75005 Paris
ABSTRACT
Identification of prosodic phenomena is of first importance in prosodic analysis and modeling. In this paper, we introduce a new method for automatic prosodic phenomena labelling. The au-thors set their approach of prosodic phenomena in the framework of prominence. The proposed method for automatic prominence labelling is based on well-known machine learning techniques in a three step procedure: i) a feature extraction step in which we propose a framework for systematic and multi-level speech acoustic feature extraction, ii) a feature selection step for identifying the more relevant prominence acoustic correlates, and iii) a modelling step in which a gaussian mixture model is used for predicting prominence. This model shows robust performance on read speech (84%).
Index Terms— Prosody, prominence, acoustic correlates, fea-ture selection, classification, gaussian mixfea-ture model
1. INTRODUCTION
The identification of prosodic phenomena is an essential task in the analysis of prosody as well as for its modeling in the context of text-to-speech systems. Understanding acoustic correlates of these phe-nomena in order to automatically detect them from speech is of great help for prosodic models. Recent automatic prosodic annotation re-search has focused on prominence instead of accent [1, 2, 3]. In this paper, we present a prominence identification method based on a statistical model that enables the automatic emergence of acous-tic correlates of prominence and then their automaacous-tic classification. This paper is organized as follows: firstly, we define the notion of prominence and how this is favorable to the concept of accent. In the second section, we clarify the protocol for the manual annotation of a reference corpus. In the third section, we explain the proba-bilistic framework based on well-known pattern matching methods: feature extraction, feature selection, and bootstrap learning method for prominence modeling with a gaussian mixture model.
2. WHAT IS PROMINENCE?
The transcription of prosodic phenomena is usually carried out us-ing the notion of accentuation. Several systems for the transcription of prosody (ToBI [4] and RFC [5] for English annotation; INTSINT [6, 7] and [8] for French annotation) are based on this notion. This strategy takes a priori theoretical knowledge for granted and sup-poses an already-known phonological representation as well as its acoustic correlates and the associated prototypes. This definition of prosodic phenomena has several drawbacks: firstly, it supposes that the phonological system is already known, meaning their acoustic
NP P Total NP 3385 543 3928 P 707 1670 2377 Total 4092 2213
Table 1. Confusion matrix for P/NP decision task
correlates, their type and their associated function are known. How-ever, such phonological representations are not unanimous and the resulting annotations show large interindividual variations that con-tradict the strength of these models [9]. Recent studies have favored the notion of prominence over that of accent. By prominence, we refer to the definition stated in [10]: “prominence is the property by which linguistic units are perceived as standing out from their en-vironment”. In this paper, we will use the methodology defined in [3]: prominence is a perceptive phenomena that does not refer to a phonological system and of which one does not presuppose the acoustic correlates, nor the arrangement of the spoken chain. The considered prominent unit here is the syllable.
3. PROMINENCE ANNOTATION
Prominence being a perceptive phenomenon, the first step of its mod-eling is the creation of a reference corpus based on a manual an-notation. We have defined the following annotation protocol: two non-specialist individuals were simultaneously annotating a single speaker corpus of 466 read sentences containing 6305 syllables in sentences ranging from 2 to 66 syllables, with an average and stan-dard deviation of 13.5 and 9.5 syllables. The annotation task was defined as follows: in each sentence, subjects were asked to note the group of syllables “P” for prominent or “NP” for non-prominent. Subjects could listen to each sentence as many times as they wished and using different temporal scales before making their decision. We present in table 1 the confusion matrix between the two annotators.
We define the agreement measure as being the mean of promi-nent and non-promipromi-nent f-measure. This measure i) gives compro-mise on recall and accuracy measures and ii) neutralizes the datas proportion effect (roughly 64% non-prominent and 36% prominent syllables). The result demonstrates agreement in discriminating prominent / non-prominent syllables (78.6% mean f-measure) and validates the concept of prominence as a robust perceptive correlate for a prosodic phenomena annotation task. Only syllables which show agreement during annotation were set as prominent for the rest of the paper.
4. ACOUSTIC CORRELATES OF PROMINENCE Recent research shows that prosodic phenomena result from the in-teractions of acoustic cues that are more complex than pitch and du-ration. Local speech rate [11], loudness [2], and subbands energy [12] should be taken into consideration for such phenomena analy-sis. These studies indicate that prosodic acoustic correlates should not be restricted a priori. At the same time, prominence detection methods focusing on the search of new acoustic correlates are still based on arbitrary feature subsets: f0and duration [3]; f0, duration
and energy [1]; f0, phone duration, loudness, aperiodicity and
spec-tral slope [2], and f0, duration and subbands energy [12]. This
sec-tion introduces a systematic framework for the extracsec-tion of features with the goal of determining the acoustic correlates of prominence without a priori knowledge.
4.1. Methodology for acoustic features extraction
We propose to define a systematic framework for the description of speech acoustic properties as follows: i) statement of primitive acoustic features, ii) measurement of characteristic values for each feature over a given syllable, and iii) comparison of the considered syllable features according to different surrounding syllables tempo-ral horizon.
4.1.1. Primitive acoustic features
The first step lies in the choice of the speech primitive acoustic features computed from the signal: pitch (fundamental frequency or f0), duration features (syllable duration, nucleus duration, local
speech rate [11] , intensity (energy and loudness), and spectral fea-tures (voiced/unvoiced cutoff frequency, spectral centroid, spectral slope, specific loudness).
4.1.2. Definition of characteristic values
The second step consists of defining the measurements that enable the description of these features over a given temporal segment - here the syllable. We defined three distinct groups of measurement: • global characteristics: maximum value, minimum value, mean
value, value sumation over unit,
• dynamic characteristics which give rough information on feature movement in the considered temporal segment: range and start to end value difference,
• shape features: first and second polynomial approximation, legen-dre polynomial approximation, 3rd order splines, hu moment and
zernike moment). The last two features are derived from image
shape analysis and have been added for their property of scale in-variance, which appears to be convenient for prosodic shape clus-tering.
4.1.3. Analysis of multi-level features
As we have said previously, prominence is not only defined by intrin-sic properties. It is essentially characterized as a salience in relation to syllables that surround it. Today, the temporal horizon of promi-nence processing has not been defined in publications. We suggest to heuristically define different temporal horizons for the comparison of acoustic data relevant for prominence detection. We have orga-nized these temporal horizons into a hierarchy from the smallest to the largest. The characteristic values calculated over a given syllable segment are compared to those of: i) adjacent syllables (previous,
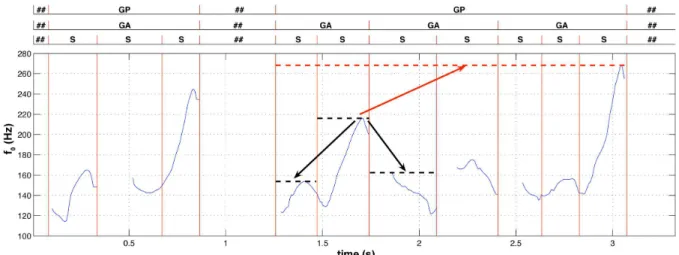
following, and mean of both previous and following), ii) accentual group including the current syllable (excluding itself), iii) prosodic group including the current syllable (excluding itself), and iv) a sen-tence including the current syllable (excluding itself). We define the accentual group as being the segment between two consecutive prominences and the prosodic group as a set of accentual group fol-lowed by a silence. The accentual group was only considerd during the feature selection step where prominence annotation were avail-able; it was set equal to the prosodic group when such information were not available. Such multi-level comparisons are illustrated in Figure 1 for fundamental frequency.
4.2. Acoustic correlates of prominence with a feature selection algorithm
Our feature extraction protocol results in the extraction of 1490 fea-tures. These features are obviously not all of equal importance ac-cording to prominence. We therefore propose to find the subset of features that best explain prominence phenomena. Our strategy for identifying these features from the complete feature set (as defined in the previous section) is based on a feature selection method. The goal of feature selection methods is basically to derive an optimal subset of features from an initial set following a given criterion.
The proposed method is based on Inertia Ratio Maximization
using Feature Space Projection[13]. This method is based on
iter-atively finding the feature that maximizes the Inertia Ratio and then projecting the data orthogonally to this feature. Let K be the total number of classes - here 2, prominent and non-prominent -, Nkthe
number of total feature vectors accounting for the training data from class k and N the total number of feature vectors. Let Xi,nkbe the
nk-th feature vector along dimension i from the class k, mi,kand mi
respectively the mean of the vectors of the class k(Xi,nk)1<i<Nk
and the mean of all training vectors(Xi,nk)1<i<Nk,1<k<K.
The Inertia Ratio is defined as the ratio of the Between-class-inertia Bito the average radius of the scatter of all classes Ri:
ri= Bi Ri = PK k=1 Nk Nkmi,k− mik PK k=1( 1 Nk PNk nk=1kxi,nk− mi,kk) (1)
The method is iterative: at each step, the selected feature ioptis
the one which maximizes the Inertia Ratio. Then features are orthog-onally projected along the ioptfeature. This projection step ensure
non-redundancy in the selected features subset. Before computing feature selection, feature vectors were first normalized according to their standard deviation over the class k. This treatment normalizes distance measures during the feature selection procedure.
In Table 2, we summarize the 10 most relevant prominence acoustic features in order of relevance. The main relevant features of prominence are: duration features (syllable duration, local speech rate and nucleus duration), pitch feature (f0), and spectral features
(specific loudness). This result does not validate results for loudness predominance [2] in case of french prominence. Secondly, it indi-cates that prominence perception results from a complex interaction of features: this phenomen involves absolute features as well as relative features over different temporal horizons (previous syllable, next syllable, accentual group), as well as shape features. It can be somewhat surprising that shape features do not appear there, when f0shape is expected to be a relevant feature for prominence
identi-fication. This could be explained for two reasons: i) f0shape is not
relevant for prominence identification, ii) the shape representations chosen here are not able to catch what distinguish prominent from prominent f0shape. This remains to be investigated.
Fig. 1. Comparison of fundamental frequency local maxima over several temporal horizons: the local maxima over syllable is compared with local maxima over adjacent syllables and parent prosodic group.
(S: Syllable segment, GA: Accentual Group and GP: Prosodic Group.)
Feature name ri
duration 37.46 f0mean / around f0mean 5.81
nucleus duration 4.65 spec loud 1 mean / next spec loud 1 mean 1.68 spec loud 18 mean / prev spec loud 18 mean 1.36 lsr min / ag lsr min 1.32 lsr curve 0.90 lsr mean / around syl lsr mean 0.59 energy mean 0.51 lsr slope 0.40 Table 2. Selectionned features according to IRMFSP with respective inertia ratio. For clarity, spec loud = specific loudness with respec-tive band, lsr = local speech rate. When not mentionned the temporal horizon is the syllable; ag is the accentual group
5. PROMINENCE MODEL
Once the most relevant acoustic correlates on the reference corpus have been determined, we need to model the prominent and non-prominent classes for class prediction. We chose the well-known
Gaussian mixture model(GMM) for data modeling.
5.1. Gaussian mixture model
For each prominent and non-prominent class, the distribution of the P-dimensional feature vectors is modeled by a Gaussian mixture density. Then for a given feature vector x, the mixture density for class k is defined as:
P(x|k) = M X i=1 ωkib i k(x) (2)
where the weighting factors ωki are positive scalars satisfying
PM
i=1ω i
k = 1. The density is then a weighted linear
combina-tion of M gaussian densities bikwith mean vector µ i
kand covariance
matrixΣk
i. The model parameters θk = {µik; Σik; ωki}i=1,...,M are
estimated with the Expectation-Maximization (EM) algorithm [14]. Classification is then made using the Maximum a posteriori
Proba-bility(MAP) decision rule. Models were trained with the first 100
features issued from the preceding feature selection step (section 4). 5.2. Learning procedure
Our proposed learning method is a two-step method: in a first su-pervised step, model parameters θk,0are estimated on a reference
corpus for the prominent and non-prominent classes. These param-eters are used as initialization in an iterative unsupervised predic-tion/learning procedure. Given an iteration i of the method, a class label sequence is first estimated according to the MAP decision with the previous models θi−1= {θj,i−1}j=1,...,K. Then, model
param-eters are reestimated for each class k according to the predicted class label sequence with initialisation model θk,i−1and prior probability
equal to posterior probability of the θk,i−1model. This reestimation
of the model parameters gives the model θi. Iteration is computed
until model convergence.
For this procedure we have built three corpora for model initial-ization, learning, and validation steps. Firstly, the reference corpus has been equally split into an initialization corpus and a validation corpus.Secondly, a non-annotated corpus was used for the unsuper-vised model learning step. This last corpus contains 69688 syllables distributed into 3615 sentences from 2 to 74 syllables with a mean and standard deviation respectively of 19 and 9 syllables.
We define the performance measure as the mean of prominence and non-prominence fmeasure - this for the same reasons that stated in Section 3.
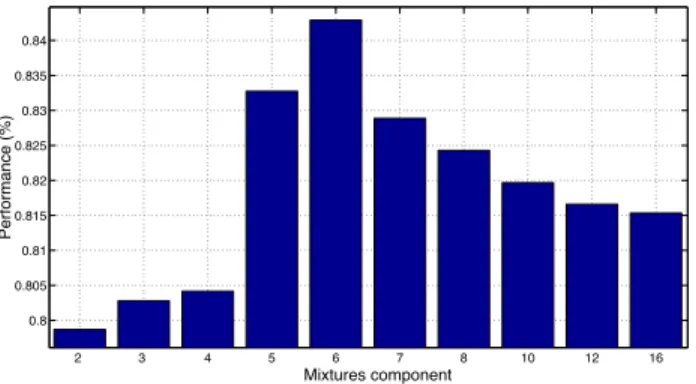
Initialization and validation corpora have both been used for per-formance measures: the perfomance on initialization corpus indi-cates the learning ability of our model, whereas performance on the validation corpus indicates generalization ability. The performance measure is computed at each step of the learning procedure. Dif-ferent mixture componants have been tested on the same procedure from 2 to 16 components; as well as different learning corpus sizes equally spaced from 20% to 100% of the whole corpus. Finally, ini-tialization and validation corpora were inverted in a cross-validation procedure.
2 3 4 5 6 7 8 10 12 16 0.8 0.805 0.81 0.815 0.82 0.825 0.83 0.835 0.84 Mixtures component Pe rf o rma n ce (% )
Fig. 2. Mean performance in prominence detection as a function of mixtures component. The mean was computed on the performance according to data ratio in learning corpus.
1 1.5 2 2.5 3 3.5 4 4.5 5 86 88 90 92 % m e a n fm e a s u re o n r e fe re n c e c o rp u s 1 1.5 2 2.5 3 3.5 4 4.5 5 79 80 Iterations % m e a n fm e a s u re o n v a li d a ti o n c o rp u s
Fig. 3. Evolution of mean performance during unsupervised learn-ing. In plain line, mean recall on initialization corpus and in broken line, mean recall on validation corpus
5.3. Results and discussion
Figure 2 summarizes our model mean performance results. Our model has an overall mean performance of 83% on the initialization corpus and 80% on the validation corpus. Maximum performace is of 89% on the validation corpus, which is encouraging result. The optimal model was found to be a 6 components mixture with 84% mean generalization performance and 89% maximum general-ization performance. Then the performance decreases with model order as the model starts to overfit data and loses generalization ability. Figure 3 presents an example of the evolution of perfor-mance as a function of the iteration step during unsupervised learn-ing. The model improves generalization performance since learning performance decreases. This means that i) the model is learning prominence structure on the unknown dataset and ii) the model is learning general prominence characteristics instead of corpus depen-dant ones. The cross-validation procedure gives comparable perfor-mances with 85% on the initialization corpus and 82% on the valida-tion corpus. This means that the learning procedure is robust since model performance does not depend on the initialization dataset.
6. CONCLUSION AND FUTURE WORKS
We have shown with a feature selection algorithm that prominence phenoma results from a complex interaction of acoustic correlates.
Our proposed model for automatic prominence prediction shows good and robust performances. In the feature selection step, it could be expected that prominence relies on multiple and specific acoustic cues which define the so-called prominence type. This stated, the feature selection should account for such type characteristics by pre-processing the prominence class with clustering methods or directly with unsupervised feature selection methods. In the modelling step, the choice of both feature number and classifier for detection were arbitrary set. In future research, we are interested in i) investigating the effect of both feature number and classifier type on the detection performance in order to estimate an optimal model for prominence detection, ii) modelling acoustic prominence type with clustering methods, iii) defining a prominence strengh measure that would be used for prosody modeling and prediction from text structure.
7. REFERENCES
[1] Tamburini F., “Automatic detection of prosodic prominence in contin-uous speech,” in Proc. Third International Conference on Language Resources and Evaluation (LREC’2002), Las Palmas, Canary Islands, Spain, 2002, pp. 301–306.
[2] G. Kochanski, E. Grabe, J. Coleman, and B. Rosner, “Loudness pre-dicts prominence: fundamental frequency lends little,” J. Acoust. Soc. Am., vol. 118, pp. 1038–1054, 2005.
[3] M. Avanzi, J.-P. Goldman, A. Lacheret-Dujour, A.-C. Simon, and A Auchlin, “M´ethodologie et algorithmes pour la d´etection automa-tique des syllabes pro´eminentes dans les corpus de franc¸ais parl´e,” Cahiers of French Language Studies, vol. 13, no. 2, 2007.
[4] M. Beckman, J. Hirschberg, and S. Shattuck-Hufnagel, “The original tobi system and the evolution of the tobi framework,” in Prosodic mod-els and transcription: Towards prosodic typology, pp. 9–54. Oxford University Press, Oxford, 2004.
[5] P. Taylor, “The rise/fall/connection model of intonation,” Speech Com-munication, vol. 15, no. 1-2, pp. 169–186, 1994.
[6] D. Hirst, N. Ide, and J. Veronis, “Coding fundamental frequency pat-terns for multi-lingual synthesis with intsint in the multext project,” in Proceedings of the 2nd ESCA/IEEE Workshop on Speech Synthesis, New Paltz, NY, 1994, pp. 77–81.
[7] B. Post, E. Delais-Roussarie, and A-C. Simon, “Ivts, un syst`eme de transcription pour la variation prosodique,” Bulletin PFC, vol. 6, pp. 51–68, 2006.
[8] S-A. Jun and C. Fougeron, “A phonological model for french intona-tion,” in Intonation: Analysis, Modeling and Technology, A.Botinis, Ed., pp. 209–242. Kluwer, Dordrecht, 2000.
[9] C. Wightman, “Tobi or not tobi?,” in Proceedings of the First Inter-national Conference on Speech Prosody (SP’2002), Aix-en-Provence, France, 2002, pp. 25–29.
[10] J. Terken, “Fundamental frequency and perceived prominence,” J. Acoust. Soc. Am., vol. 89, pp. 1768–1776, 1991.
[11] H. Pfitzinger, “Local speech rate as a combination of syllable and phone rate,” in Proc. of International Conference on Speech Language Pro-cessing (ICSLP’1998), Sydney, Australia, 1998, vol. 3, pp. 1087–1090. [12] A. Rosenberg and J. Hirschberg, “Detecting pitch accent using pitch-corrected energy-based predictors,” in Interspeech, Antwerp, Belgium, 2007, pp. 2777–2780.
[13] G Peeters, “Automatic classification of large musical instrument databases using hierachical classifiers with inertia ratio maximization,” in AES 115th Convention, 2003.
[14] Dempster A.P., Laird N.M., and Rubin D.B, “Maximum likelihood from incomplete data via the em algorithm,” Journal of the Royal Sta-tistical Society, vol. B, no. 39, pp. 1–38, 1977.