Does Familial Non-Medullary Thyroid Cancer
Adversely Affect Survival?
Frederic Triponez, MD,
2,4Mariwil Wong, BS,
1Cord Sturgeon, MD,
1Nadine Caron, MD,
1David G. Ginzinger, PhD,
2Mark R. Segal, PhD,
3Electron Kebebew, MD,
1Quan-Yang Duh, MD,
1Orlo H. Clark, MD
11
Endocrine Surgical Oncology, UCSF / Mount Zion Medical Center, San Francisco, CA 94143-1674, USA
2
Advanced Research Technologies, Applied Biosystems, 850 Lincoln Center Drive, MS 447, Foster City, CA 94404-1105, USA
3
Epidemiology and Biostatistics, UCSF, San Francisco, CA 94143-0560, USA
4
Thoracic and Endocrine Surgery, University Hospital of Geneva, Rue Micheli-du-Crest 24, Geneva 14, 1211, Switzerland
Abstract
Background: Familial non-medullary thyroid cancer (FNMTC) is associated with a higher rate of multifocality and a higher recurrence rate than sporadic thyroid cancer. However, the effect of FNMTC on life expectancy is unknown.
Material and Methods: Using data from our FNMTC database, we calculated life expectancy and survival rates after diagnosis of FNMTC and compared the results with the rates for unaffected family members and for the standard US population. Overall life expectancy and survival rates were calculated using the Kaplan–Meier method. We compared patients from families with 2 affected members with patients from families with ‡3 affected members. We also compared patients diagnosed in a known familial setting (index cases and subsequent cases) with patients diagnosed before the familial setting was recognized.
Results: There were 139 affected patients with 757 unaffected family members. The mean age at diagnosis was 40.8– 13.9 years and the mean follow-up time was 9.4 – 11.7 years. Ten patients died of thyroid cancer during follow-up. The life expectancy of patients with FNMTC was similar to that of their unaffected family members. Survival was significantly shorter for patients with 3 or more affected family members, for patients diagnosed before the familial setting was recognized, and for patients with anaplastic cancer.
Conclusions: Our results suggest that FNMTC may be more aggressive than sporadic thyroid cancer, particularly in families with 3 or more affected members. However, when recognized and treated appropriately, it does not significantly shorten the overall life expectancy of the affected patients.
M
ost thyroid cancers of follicular cell origin (papillary thyroid carcinoma, follicular thyroid carcinoma andHurthle cell carcinoma) are sporadic; however, familial clustering of non-medullary thyroid cancer (NMTC) has been shown in epidemiological studies, indicating a familial relative risk of 4.23–10.3.1–4Because the genetic abnormality leading to familial NMTC (FNMTC) is un-known,5 the current definition of FNMTC is based on
Frederic Triponez, MD, is supported in part by a grant from the Uni-versity Hospital of Geneva, Switzerland.
Correspondence to: Frederic Triponez, MD, e-mail: frederic.triponez @hcuge.ch
having 2 direct relatives affected by thyroid cancer who do not have other familial syndromes such as Cowden disease (multiple hamartoma syndrome), familial adeno-matous polyposis (FAP), or Carney complex.6 However, because of the high prevalence of thyroid cancer in the general population, it has been estimated that if 2 family members are affected with NMTC, there is a 53% chance that this cancer is familial in origin and a 47% chance that it is sporadic. If 3 or more family members are affected, there is a 99.9% chance that the disease is familial.7,8
Familial NMTC accounts for 3%–7% of differentiated thyroid cancer and is a recognized clinical entity char-acterized by a more aggressive phenotype.7,9,10FNMTC occurs at a younger age, is more often multifocal, and recurs more often than its sporadic counterpart.9–13 However, its effect on mortality is still unclear.9,14 Therefore, we analyzed the FNMTC database of pa-tients seen either at our institution (University of Cali-fornia, San Francisco, UCSF) and at several other institutions in the United States. Survival and life expectancy of FNMTC patients with 2 affected family members or ‡3 affected members were compared with those of unaffected family members. Survival was also compared with the estimated survival of the standard US population.
PATIENTS AND METHODS
We retrospectively analyzed data on cases in the FNMTC Database at UCSF that were diagnosed between 1974 and 2004. Data on patients with FNMTC and their family members have been collected prospectively in this database. Cases that are defined as familial if 2 first-degree relatives were affected by histopathologically confirmed thyroid cancer of follicular cell origin, are initially reported by UCSF physicians and surgeons and by collaborating physicians and surgeons in the US. The database variables consist of the demographics of the patients, a pedigree with the family history, the operation, pathology, and clinic visit reports of the affected family members. Additional data for this study was extracted from patientsÕ medical records and updated either by di-rect patient contact (follow-up visit or telephone call) or by sending questionnaires to the patient, the reporting phy-sician or surgeon, or both. Patients with occult thyroid cancer discovered by pathologic examination after thy-roidectomy for a benign condition were considered to be affected with FNMTC because previous studies have suggested that even microcarcinomas have a more
se-vere prognosis in a familial setting.12 Family members were considered non-affected when they had a benign thyroid disease or no known thyroid disease and were considered affected when they had a histopathologically proven thyroid cancer.
Patients were separated into 2 initial groups for analy-sis: one group consisted of patients from families with 2 members affected by FNMTC (Group 2); the other con-sisted of patients from families with‡3 affected members (Group ‡3). Within each family, patients were also sep-arated into 2 groups: those with FNMTC diagnosed in a recognized familial setting (the index case and sub-sequent cases in that family; the ‘‘Post-index’’ Group) and those diagnosed before the index case (the ‘‘Pre-index’’ Group). In order to compare the survival of patients with FNMTC with that of the standard US population, for each patient with FNMTC, a control case was created with the average number of years of life remaining derived from the United States life tables, specific for gender, race, and decennial period.15 The study endpoints were age and status at the last follow-up. The study was approved by the UCSF Committee on Human Research.
Results are presented as mean values– standard deviation (SD) unless otherwise stated. Comparisons between groups were made using the Chi-square test, FisherÕs exact test, StudentÕs t-test or analysis of variance (ANOVA). When overall comparisons showed a signifi-cant difference, pairwise comparisons were carried out using BonferroniÕs correction. Overall life expectancy and survival after FNMTC diagnosis were analyzed using the Kaplan–Meier method and groups were compared using the log-rank test. Follow-up times were analyzed up to 25 years after FNMTC diagnosis because <10% of patients were remaining after that time point. P values <0.05 were considered statistically significant. Statistical analyses were performed and graphs were generated with SPSS software version 11.0.1 (SPSS, Chicago, IL, USA). Leg-ends and numbers at risk were added on the graphs using Adobe Photoshop Elements (Adobe Systems Incorporated, San Jose, CA, USA).
RESULTS
Life Expectancy
Of the 199 patients with FNMTC in the database, 139 (69.8%) had a pedigree available with data on age and health status for them and their 757 non-affected family members. Characteristics of the 139 patients with FNMTC are given in Table 1. The overall life expectancy
of male and female FNMTC patients was not signifi-cantly shorter than that of their same-sex non-affected family members (Figs. 1, 2). The mean (95% confidence interval) life expectancy was 81 (72–89) years for female patients, 80 (77–82) years for their non-affected female family members, 78 (70–82) years for male patients, and 73 (70–76) for their non-affected male family members.
Survival after FNMTC Diagnosis
The mean follow-up time after FNMTC diagnosis was 9.4– 11.7 years. By the end of follow-up, 10 patients had died of thyroid cancer (7.2%, 4 females and 6 males; age 60.3– 14.2 years). Seven additional patients
(5.0%, 4 females and 3 males, age 75– 13.6 years) had died of other causes. Although the overall mortality rate for FNMTC patients was significantly higher than that for standard US controls during the first 30 years after FNMTC diagnosis, the overall difference was not sta-tistically significant. (Fig. 3). The mean (95% CI) overall survival was slightly but not significantly better for wo-men than for wo-men [at 10 years: 91% (83–99) vs. 86% (76–96), at 20 years: 87% (76–96) vs. 67% (42–92), P = 0.11].
Figure 2. Kaplan–Meier curves representing life expectancy of male patients with FNMTC and their unaffected male family members. The number of patients and unaffected family members remaining at each time point is shown below the graph.
Table 1.
Characteristics of the 139 familial non-medullary thyroid cancer (FNMTC) patients
Characteristic Statistic
Age at FNMTC diagnosis (years) 40.8– 13.9
Sex ratio (male/female) 0.47 (45/94)
Average follow-up time (years) 9.4– 11.7
Number belonging to families with...
2 affected members 61 (46.9%) ‡3 affected members 69 (53.1%) Tumor type Papillary 114 (85.7%) Follicular 10 (7.5%) Hurthle cell 6 (4.5%) Anaplastic 3 (2.3%)
Results are shown as mean– SD or values (percent).
Figure 1. Kaplan–Meier curves representing life expectancy of female patients with familial non-medullary thyroid cancer (FNMTC) and their unaffected female family members. The number of patients and unaffected family members remaining at each time point is shown below the graph.
Figure 3. Kaplan–Meier curves representing overall and dis-ease-specific cumulative mortality of FNMTC patients according to follow-up time after FNMTC diagnosis and of control cases derived from standard US population life tables. The number of patients remaining at each time point is shown below the graph. Comparison was made between the overall mortality of the patients and the controls.
Prognostic Factors
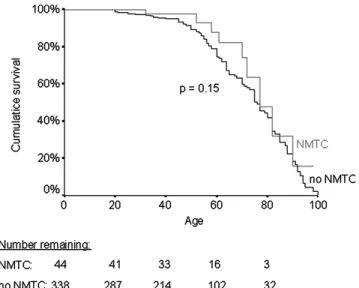
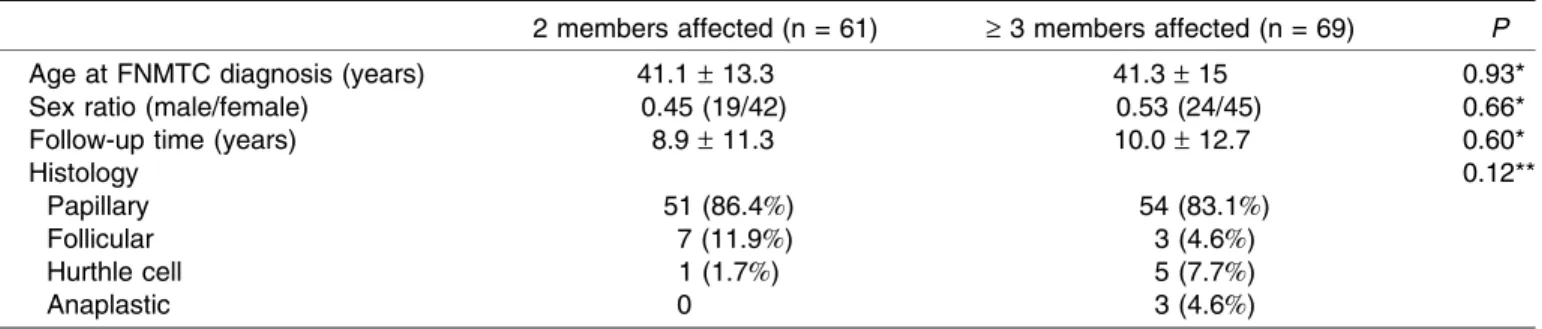
Although their demographic and histology characteris-tics were similar (Table 2), patients in Group ‡3 had a shorter survival time than patients in Group 2 (P = 0.02). Moreover, the survival rates of patients in Group‡3 were significantly lower than those of the controls (Fig. 4), while the survival rates of patients in Group 2 were similar to those of the controls (Fig. 5). The survival rates of patients in the pre-index group were significantly lower than those of the patients in the post-index group (Fig. 6). In fact, none of the patients died in the post-index group after a mean follow-up time of 6.5– 9.2 years. As ex-pected, the proportion of patients who died during follow-up differed significantly according to tumor histology: 6 out of 114 patients with papillary thyroid cancer, 0 out of 10 with follicular thyroid cancer, 1 out of 6 with Hurthle cell
thyroid cancer, and 3 out of 3 with anaplastic thyroid cancer. Pairwise comparison testing showed that the proportion who died of anaplastic cancer was significantly different from the 3 other types of tumors (P < 0.01), but not among the 3 types of differentiated thyroid cancer.
DISCUSSION
Our retrospective study shows that after treatment, FNMTC does not significantly affect the overall life expectancy or survival of patients when compared with their non-affected family members or with the standard US population. However, among patients with FNMTC, those from families with 3 or more affected members had significantly shorter survival times than those from
Table 2.
Characteristics of FNMTC patients from families with 2 or‡ 3 affected members
2 members affected (n = 61) ‡ 3 members affected (n = 69) P
Age at FNMTC diagnosis (years) 41.1– 13.3 41.3– 15 0.93*
Sex ratio (male/female) 0.45 (19/42) 0.53 (24/45) 0.66*
Follow-up time (years) 8.9– 11.3 10.0– 12.7 0.60*
Histology 0.12**
Papillary 51 (86.4%) 54 (83.1%)
Follicular 7 (11.9%) 3 (4.6%)
Hurthle cell 1 (1.7%) 5 (7.7%)
Anaplastic 0 3 (4.6%)
Results are mean– SD or values (percent). *StudentÕs t-test, **PearsonÕs Chi-square test.
Figure 4. Kaplan–Meier curves representing the cumulative survival of FNMTC patients from families with 3 or more affected members and of control cases derived from standard US population life tables. The number of patients remaining at each time point is shown below the graph.
Figure 5. Kaplan–Meier curves representing the cumulative survival of FNMTC patients from families with 2 affected members and of control cases derived from standard US population life tables. The number of patients remaining at each time point is shown below the graph.
families with only 2 affected members. Similarly, patients who were diagnosed before the index case (the ‘‘pre-index’’ group) had significantly shorter survival times than those with a known family history of thyroid cancer (the ‘‘post index’’ group). Moreover, anaplastic thyroid cancer was a significant factor of death in this study.
Our study included patients with anaplastic cancer be-cause we considered the occurrence of anaplastic thyroid cancer to be a probable de-differentiation of papillary thyroid cancer. One patient with anaplastic thyroid cancer came from a family in which 2 other members had pap-illary thyroid cancer. The 2 other patients came from the same family, in which 11 other members had papillary thyroid cancer. Because these 3 patients accounted for 30% of the disease-specific deaths in our study, if we excluded them from the analysis, the survival rates and the life expectancy for patients with FNMTC would in-crease.
Patients with differentiated thyroid cancer have an excellent 10-year survival rate, ranging between 80% and 95%.16,17 This high survival rate makes statistical com-parisons between different groups of patients or even between patients and the normal population difficult, particularly when the groups (and therefore the sub-groups) are relatively small. Moreover, most of the stud-ies on thyroid cancer, like ours, use overall mortality (death from any cause) and not the specific mortality (death from thyroid cancer) as their endpoints. We pre-viously reported that about 50% of the deaths in patients
with differentiated thyroid cancer are due to the thyroid cancer and 50% to other causes.18 Moreover, the stan-dard survival curves express survival in years alive, irre-spective of age.19However, we believe age at diagnosis should also be taken into account because, for example, the overall 10-year expected mortality rate for a healthy 20-year-old woman is much lower than that of a healthy 70-year-old man and thyroid cancer occurs throughout all decades of life.19 In our study, the youngest patient was diagnosed at age 10 and the oldest was diagnosed at age 80.
To address these problems, we first used overall life expectancy to compare groups of patients. As a result, age at death was analyzed, irrespective of the age at diagnosis, thereby giving an indication of the influence of FNMTC on life expectancy. When life expectancy is used, a patient who is diagnosed at age 20 and dies 5 years later has a bigger influence on the resulting life expec-tancy than a patient who is diagnosed at age 70 and dies 5 years later, whereas both patients would have the same influence on standard survival curves that express sur-vival in terms of years alive. We chose the non-affected family members as controls in this life expectancy anal-ysis because, in our opinion, they are better controls than the standard population as a result of being ‘‘naturally’’ matched not only for age, sex and race, which are known factors influencing life expectancy and which can be found in standard life tables, but also for economic status, for exposure to environmental factors like tobacco smoke, and for genetic background. All of these factors are known to influence life expectancy, but cannot be adjusted for in standard life tables. We found that life expectancy was similar for FNMTC patients and their non-affected family members, suggesting that overall and after treatment, FNMTC does not significantly adversely affect the life expectancy of patients. However, life expectancy analysis also has several limitations.
As the gene or genes involved in FNMTC are not known, all the family members who were not diagnosed with thyroid cancer were considered to be unaffected. However, previous studies have shown that when sys-tematic ultrasound is performed in family members of FNMTC patients, 77 (52%) of the 149 patients examined had at least one nodule and 15 (10%) of the 18 patients undergoing thyroidectomy had thyroid cancer,20 sug-gesting that, as in the case of sporadic NMTC, FNMTC can be unrecognized for a long period of time. Moreover, as only the patients with proven NMTC were included in the affected group for our study, all the other family members who died of other causes, perhaps before developing FNMTC, were included in the non-affected
Figure 6. Kaplan–Meier curves representing the cumulative survival of FNMTC patients diagnosed in a known familial setting (post-index group) and patients diagnosed before the familial setting was recognized (pre-index group) according to the follow-up time after diagnosis. The number of patients at risk at each time point is shown below the graph.
group. We found that 19 controls (13 men and 6 women) in the non-affected group died between the ages of 10 and 40. However, even when these controls were ex-cluded, life expectancy did not differ between the FNMTC patients and their non-affected relatives (P = 0.94 for the females and 0.30 for the males).
To address the problem of standard survival curves that express survival in years alive, irrespective of age, we used cases that were matched to patients by age, sex, decennial period at diagnosis, and race. By comparing survival of FNMTC patients with that of these controls took age at diagnosis into account because the 2 groups have the same age distribution at diagnosis. We found that the survival of patients from families with 2 affected members had similar survival rates as controls, but that patients from families with ‡3 affected members had significantly lower survival rates than controls, suggesting that FNMTC is more aggressive when‡3 family members are affected. Although worse disease-free survival has been shown in patients from families with 3 or more af-fected members,6,10 our finding of a worse overall sur-vival is new and, in our opinion, reflects a more significant impact of FNMTC. The aggressiveness of FNMTC is controversial, including the impact on survival; however, none of the previous studies addressed the survival of FNMTC patients from families with ‡3 affected mem-bers.9,21Based on the prevalence of thyroid cancer in the general population, CharkesÕ hypothesis that 47% of the families with only 2 affected members could be consid-ered sporadic cases of NMTC8 suggests that there may be a dilution effect in the group of patients from families with 2 affected members. Therefore, the aggressiveness of FNMTC could be underestimated by the presence of a significant number of sporadic NMTC patients in this group and our analysis of patients from families with ‡3 affected members thus provides more precise data on the effect of FNMTC on survival than an analysis of all pa-tients from families with 2 or more affected members.
Two additional factors were significantly associated with death during follow-up in this study. First, all 3 pa-tients with anaplastic cancer died of their disease, as expected. The second factor we identified was that compared with being diagnosed with NMTC before the familial group is recognized, being diagnosed in a known familial setting appears to be associated with a better outcome. The important clinical implication of this finding is that an accurate family history could be a more important prognostic factor than the extent of surgery in a significant number of patients with thyroid cancer. How-ever, because our study was retrospective and patients from throughout the United States were included in the
database, it was not possible to analyze whether the physicians who cared for these patients and their rela-tives were more aggressive about follow-up or treatment protocols for patients with FNMTC and their relatives than they were for patients who were not diagnosed in a familial setting. For relatives of FNMTC patients being followed at our institution, we recommend regular ultra-sound examination of the thyroid and yearly follow-up or total thyroidectomy when a nodule is found. This recom-mendation is based on the fact that FNMTC is often multifocal and that we have previously shown that fine-needle aspiration cytology was not as accurate in patients with FNMTC as in patients with sporadic NMTC.22In that study, 3 (12%) FNMTC patients had a false negative cytology. However, this aggressive approach is only jus-tified when thyroidectomy is associated with a very low risk of hypoparathyroidism and recurrent nerve injury.7
In conclusion, this study documents that FNMTC does not significantly affect the overall life expectancy of trea-ted patients compared with their non-affectrea-ted relatives or with the US population. However, being from a family in which 3 or more members are affected with thyroid can-cer is associated with a significantly lower survival, as does being diagnosed with NMTC before it is recognized as a familial disease. Further studies are needed to determine the optimal management of patients with FNMTC; however, patients with 3 or more affected family members possibly deserve a more aggressive surgical and follow-up management than patients with sporadic thyroid cancer.
ACKNOWLEDGEMENTS
We are very grateful to Pamela Derish for her very helpful editorial comments on this manuscript. We would also like to thank all of the physicians who collaborated with us by sending samples for genetic testing (S. Adams, MD, J. Attie, MD, O. Davis, MD, P. Detwiler, MD, C. Greenlee, MD, R. Harmick, MD, R. Komorn, MD, C. Lykins, MD, B. Miscall, MD, J.L. Ponce Marco, MD, J.A. Recabaren, MD, G. Zenger, MD), the Friends of Endocrine Surgery, the Jerrold Heller Family Founda-tion, the Helen and Sanford Diller FoundaFounda-tion, and the Albert G. Clark Foundation.
REFERENCES
1. Hemminki K, Li X. Familial risk of cancer by site and his-topathology. Int J Cancer 2003;103(1):105–109.
2. Goldgar DE, Easton DF, Cannon-Albright LA, Skolnick MH. Systematic population-based assessment of cancer risk in first-degree relatives of cancer probands. J Natl Cancer Inst 1994;86(21):1600–1608.
3. Pal T, Vogl FD, Chappuis PO, et al. Increased risk for nonmedullary thyroid cancer in the first degree relatives of prevalent cases of nonmedullary thyroid cancer: a hospital-based study. J Clin Endocrinol Metab 2001;86(11):5307– 5312.
4. Hemminki K, Eng C, Chen B. Familial risks for nonmedul-lary thyroid cancer. J Clin Endocrinol 2005;90(10):5747– 5753.
5. Brunaud L, Zarnegar R, Wada N, et al. Chromosomal aberrations by comparative genomic hybridization in thyroid tumors in patients with familial nonmedullary thyroid cancer. Thyroid 2003;13(7):621–629.
6. Sturgeon C, Clark OH. Familial nonmedullary thyroid can-cer. Thyroid 2005;15(6):588–593.
7. Alsanea O, Clark OH. Familial thyroid cancer. Curr Opin Oncol 2001;13(1):44–51.
8. Charkes ND. On the prevalence of familial nonmedullary thyroid cancer. Thyroid 1998;8(9):857–858.
9. Uchino S, Noguchi S, Kawamoto H, et al. Familial nonme-dullary thyroid carcinoma characterized by multifocality and a high recurrence rate in a large study population. World J Surg 2002;26(8):897–902.
10. Grossman RF, Tu SH, Duh QY, et al. Familial nonmedullary thyroid cancer. An emerging entity that warrants aggressive treatment. Arch Surg 1995;130(8):892–897.
11. Takami H, Ozaki O, Ito K. Familial nonmedullary thyroid cancer: an emerging entity that warrants aggressive treat-ment. Arch Surg 1996;131(6):676.
12. Lupoli G, Vitale G, Caraglia M, et al. Familial papillary thy-roid microcarcinoma: a new clinical entity. Lancet 1999;353(9153):637–639.
13. Alsanea O, Wada N, Ain K, et al. Is familial non-medullary thyroid carcinoma more aggressive than sporadic thyroid cancer? A multicenter series. Surgery 2000;128(6):1043– 1050.
14. Loh KC, Lo JC, Greenspan FS, et al. Familial papillary thyroid cancer: a case report. Ann Acad Med Singapore 1997;26(4):503–506.
15. Arias E. United States life tables, 2002. Ntl Vital Stat Rep 2004;53(6):1–38.
16. Schlumberger MJ. Papillary and follicular thyroid carci-noma. N Engl J Med 1998;338(5):297–306.
17. Sherman SI. Thyroid carcinoma. Lancet
2003;361(9356):501–511.
18. Wu HS, Young MT, Ituarte PH, et al. Death from thyroid cancer of follicular cell origin. J Am Coll Surg 2000;191(6):600–606.
19. Links TP, van Tol KM, Jager PL, et al. Life expectancy in differentiated thyroid cancer: a novel approach to survival analysis. Endocr Relat Cancer 2005;12(2):273–280. 20. Uchino S, Noguchi S, Yamashita H, et al. Detection of
asymptomatic differentiated thyroid carcinoma by neck ultrasonographic screening for familial nonmedullary thyroid carcinoma. World J Surg 2004;28(11):1099–1102.
21. Maxwell EL, Hall FT, Freeman JL. Familial non-medullary thyroid cancer: a matched-case control study. Laryngo-scope 2004;114(12):2182–2186.
22. Vriens MR, Sabanci U, Epstein HD, et al. Reliability of fine-needle aspiration in patients with familial nonmedullary thyroid cancer. Thyroid 1999;9(10):1011–1016.