HAL Id: hal-02664169
https://hal.inrae.fr/hal-02664169
Submitted on 31 May 2020
HAL is a multi-disciplinary open access
archive for the deposit and dissemination of
sci-entific research documents, whether they are
pub-lished or not. The documents may come from
teaching and research institutions in France or
abroad, or from public or private research centers.
L’archive ouverte pluridisciplinaire HAL, est
destinée au dépôt et à la diffusion de documents
scientifiques de niveau recherche, publiés ou non,
émanant des établissements d’enseignement et de
recherche français ou étrangers, des laboratoires
publics ou privés.
self-incompatibility locus
Stéphanie Mariette, Muriel Tavaud, Uraiwan Arunyawat, Gaëlle Capdeville,
Muriel Millan, Franck Salin
To cite this version:
Stéphanie Mariette, Muriel Tavaud, Uraiwan Arunyawat, Gaëlle Capdeville, Muriel Millan, et al..
Population structure and genetic bottleneck in sweet cherry estimated with SSRs and the gametophytic
self-incompatibility locus. BMC Genetics, BioMed Central, 2010, 11, 13 p. �10.1186/1471-2156-11-77�.
�hal-02664169�
R E S E A R C H A R T I C L E
Open Access
Population structure and genetic bottleneck in
sweet cherry estimated with SSRs and the
gametophytic self-incompatibility locus
Stéphanie Mariette
1,5,7*, Muriel Tavaud
2, Uraiwan Arunyawat
1,6, Gaëlle Capdeville
1, Muriel Millan
3, Franck Salin
4Abstract
Background: Domestication and breeding involve the selection of particular phenotypes, limiting the genomic diversity of the population and creating a bottleneck. These effects can be precisely estimated when the location of domestication is established. Few analyses have focused on understanding the genetic consequences of domestication and breeding in fruit trees. In this study, we aimed to analyse genetic structure and changes in the diversity in sweet cherry Prunus avium L.
Results: Three subgroups were detected in sweet cherry, with one group of landraces genetically very close to the analysed wild cherry population. A limited number of SSR markers displayed deviations from the frequencies expected under neutrality. After the removal of these markers from the analysis, a very limited bottleneck was detected between wild cherries and sweet cherry landraces, with a much more pronounced bottleneck between sweet cherry landraces and modern sweet cherry varieties. The loss of diversity between wild cherries and sweet cherry landraces at the S-locus was more significant than that for microsatellites. Particularly high levels of differentiation were observed for some S-alleles.
Conclusions: Several domestication events may have happened in sweet cherry or/and intense gene flow from local wild cherry was probably maintained along the evolutionary history of the species. A marked bottleneck due to breeding was detected, with all markers, in the modern sweet cherry gene pool. The microsatellites did not detect the bottleneck due to domestication in the analysed sample. The vegetative propagation specific to some fruit trees may account for the differences in diversity observed at the S-locus. Our study provides insights into domestication events of cherry, however, requires confirmation on a larger sampling scheme for both sweet cherry landraces and wild cherry.
Background
Most of the edible species were domesticated from wild species, generally several thousand years ago. The first cultivated populations directly sampled from wild popu-lations were then improved, through breeding, to obtain landraces, which were further selected to produce mod-ern varieties. The evolutionary history of a cultivated species results from a complex interaction between genetic and demographic factors. This history can be precisely rebuilt when the location of early
domestication is known. A single origin is generally hypothesized, and was demonstrated for example in maize [1]. However, in other crop species, such as bar-ley, multiple domestications explain genetic data better than a single domestication event [1].
Domestication and breeding have two major impacts on the diversity of plant genomes. Firstly, traits conveni-ent for human use, such as developmconveni-ent of organs used by man, or adaptation to new environments, have been selected, resulting in selection signatures at specific loci. For example, an analysis of single nucleotide poly-morphisms (SNP) in 774 maize genes showing 2 to 4% of these genes had been subject to artificial selection [2]. The second major impact is a bottleneck affecting the entire genome, due to the demographic sampling of
* Correspondence: [email protected]
1INRA, Unité de Recherche sur les Espèces Fruitières, Domaine de la Grande
Ferrade, 71 avenue Edouard Bourlaux, BP 81, 33883 Villenave d’Ornon Cedex, France
Full list of author information is available at the end of the article
© 2010 Mariette et al; licensee BioMed Central Ltd. This is an Open Access article distributed under the terms of the Creative Commons Attribution License (http://creativecommons.org/licenses/by/2.0), which permits unrestricted use, distribution, and reproduction in any medium, provided the original work is properly cited.
individuals during domestication and breeding. This process decreases diversity. However, the degree of diversity loss differs considerably between crop plants: 34% based on SNP diversity in soybean and 38% in maize, but as much as 70 to 90% in wheat (69% in bread wheat and 84% in durum wheat) and 80 to 90% in rice, depending on the sample studied and the mole-cular markers used [3-6].
Genetic mutation may also modify the diversity of culti-vated plants. A general loss of diversity at all genetic loci is expected when a wild plant is domesticated, but some loci may display new variation due to mutations occurring after domestication. The observed loss of diversity may also differ between loci in the genome and, consequently, between molecular markers, as a function of mutation rates. Such differences have been observed for microsatel-lite markers, in particular. Dinucleotide microsatelmicrosatel-lites underestimate the bottleneck in maize, due to a high rate of mutation, regenerating diversity at these loci after domestication [7]. In this case, comparing with teosinte only a moderate loss of diversity is observed in maize (19%). Similarly, in sorghum, a post-domestication increase in diversity has been observed for some genes [8].
Moreover, domestication may lead to reproductive iso-lation between the domesticated form and its wild rela-tive (e.g. mating system modification, geographic isolation). However, gene flow between cultivated and wild forms after domestication, even at very low levels, may have a marked impact on the dynamics of culti-vated plant diversity [9,10].
Despite the worldwide cultivation of fruit trees, few stu-dies have analysed the genetic domestication and breeding history of these species. The most obvious change between wild forest species and fruit trees is the change of repro-duction system. Fruit tree crops are generally propagated vegetatively, rather than by seed [11]. Many fruit trees were cultivated in classical times, (e.g. olive, grapevine, fig, date palm, pomegranate, sycamore fig), but others were domesticated much later (e.g. apple, pear, plum, cherry), probably because grafting is necessary for the cultivation of these species [12]. As grafting has been used to propa-gate selected individuals, it is thought that cultivated clones persisted for many years, and few genetic changes due to selection would therefore be expected [12]. How-ever, breeding programmes based on selection were inves-tigated for several fruit species in the 20thCentury, with the aim of improving fruit quality and disease resistance. The impact of human selection over the last few decades may therefore be much greater. The use of grafting may have led to the propagation of a limited number of highly interesting genotypes, provoking a marked bottleneck in these species. Furthermore, a limited number of varieties in modern selection programmes may also result in a stronger bottleneck due to breeding.
Sweet cherry is the domesticated form of wild cherry (Prunus avium L.). The fruits of the domesticated and wild form are very similar but differ by the size of the fruit and of the stone [12]. As wild cherry is distributed throughout Europe, human populations probably picked wild cherries in forests long before they began cultivat-ing sweet cherry fruit trees. Sweet cherry cultivation was introduced in Europe by the Romans [12]. Pliny the Elder (23-79 AD) wrote in his Natural history that the Roman general Lucullus brought cherries back to Italy when he returned from the Pontus region in Turkey. Based on morphological and genetic studies, there is evidence that sweet cherry was present in Europe in Roman and early medieval times [13-15]. Consequently, the proof of a single domestication event was not estab-lished for this species. Multiple domestications events and introgression from the wild form after domestica-tion cannot be excluded.
Moderate genetic differentiation between popula-tions was observed in wild cherry, based on several isozymes and microsatellites studies [16-19]. Recent studies have also provided insight into the reproduc-tion system of this species. Clonal reproducreproduc-tion by root suckering has been observed in many popula-tions, accounting for the heterozygote excess observed within populations [16,20-24]. Sexual reproduction is controlled by a Gametophytic Self-Incompatibility (GSI) system, which is now well described in this spe-cies [19,21,25-27].
The genetic diversity of sweet cherry varieties has also been analysed with both dominant and codominant markers [28-31]. Comparisons of wild and cultivated cherry pools on the basis of chloroplast DNA led to the identification of 16 haplotypes in wild cherries and three haplotypes in sweet cherries, suggesting a marked bot-tleneck in the species [32]. Even there are several studies on cherry but still little is known about cherry domesti-cation and improvement.
Therefore in this study, we aimed to analyse the genetic structure of sweet cherry and assess the impacts of selection and bottlenecks in sweet cherry. Based on Prunus avium L. genetic material conserved in French repositories, we addressed this issue using two types of marker: microsatellites or SSRs and the S-locus. We chose this last locus because the number of S-alleles is directly linked to effective population size [33-35]. Besides, it can be hypothesized that domestication and breeding may have been modified the frequency of allele, according to varieties that were propagated and crosses that were performed among genotypes. We spe-cifically addressed the following questions:
1/ what is the genetic structure of sweet cherry land-races and modern varieties conserved in French repositories?
2/ is there any genetic contribution of French wild cherry to analysed sweet cherries?
3/ what is the genetic variation among the identified genetic pools, as estimated with SSRs and theS-locus? Results
Cherry genetic structure
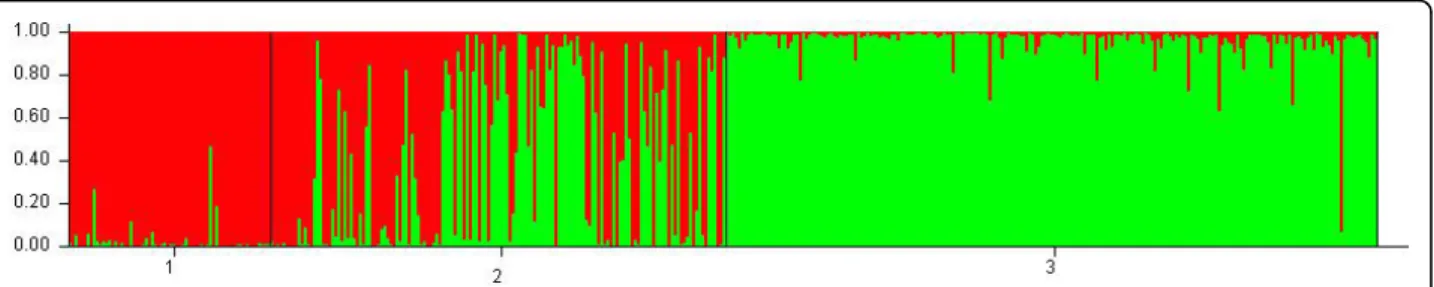
When Structure was performed on the whole data set, a maximum value of the rate of change in the log prob-ability of data was revealed at K = 2, using Evanno’s method [36]. For K = 2, wild cherry was composed of one unambiguous population, with some significant admixture from the second population for some indivi-duals (e.g. one wild cherry individual being clearly from the second population). Modern sweet cherries were the second population with some admixture from the first population. Obviously, landraces were a mixture of indi-viduals from both populations (Figure 1).
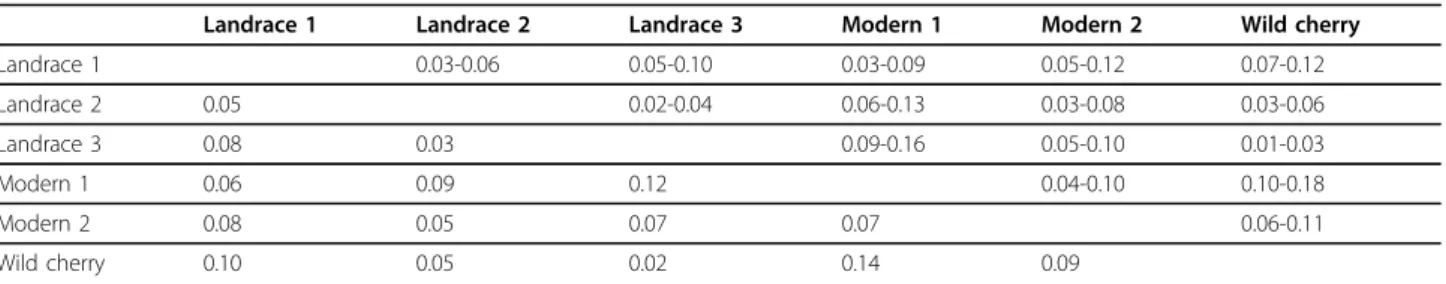
For K = 3, the results were congruent, suggesting however a more complex structure of sweet cherries with three possible groups: one group linked with the wild cherry pool (green on Figure 2) and two other groups (red and blue). For this analysis, landraces were composed of individuals from the three groups (red blue and green), and modern varieties only from two groups (red and blue). The group of wild cherry (green) was admixed by the two groups of sweet cherries, and rever-sely, the two groups of modern sweet cherries were admixed by wild cherry (see Additional file 1, Table S1). Pairwise FST values provide additional information on the relationships among the identified sub-populations. Comparing wild cherry and landraces, the lowest FST value (0.022) was logically observed between wild cherry and landrace 3 group, suggesting less differentiation between them, whereas landrace 1 group was the most differentiated group from wild cherry (FST ~ 0.10, this value being significantly different from the FST calcu-lated between wild cherry and landrace 3 group), and the differentiation between landrace 2 group and wild cherry was intermediate. Moreover, the highFST values between the wild cherry group and the two groups of
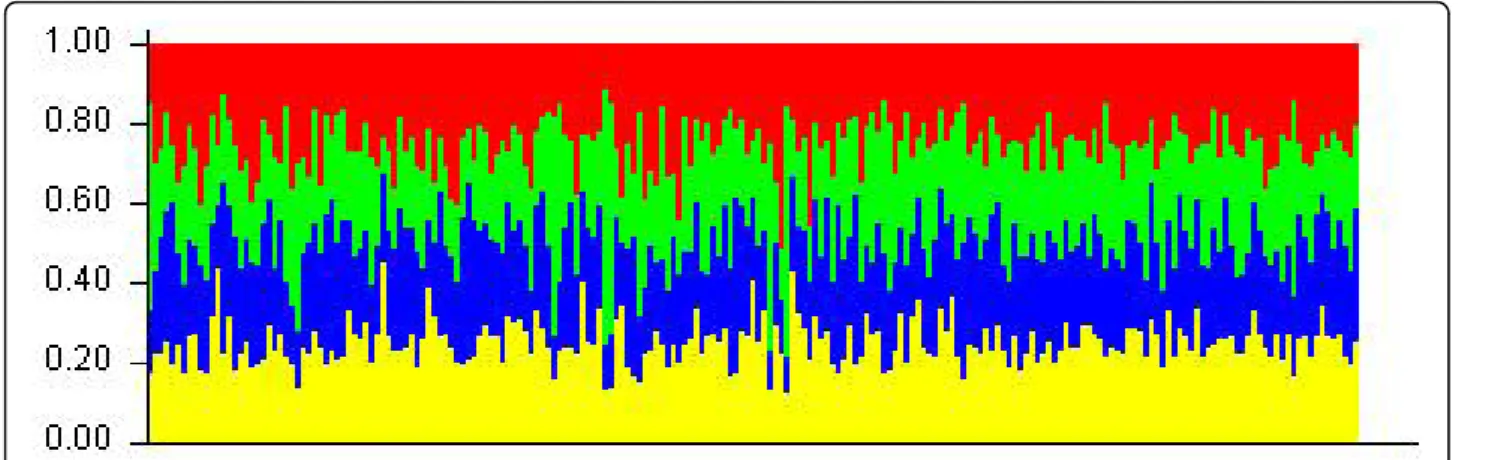
modern varieties also confirmed that modern varieties are not genetically based on this origin (Table 1). When Structure was then run on wild cherries only, the more probable number of populations was 4. However, considering the results, each individual was an admix-ture of all populations with equal contribution of each population (Figure 3). This was also true for K = 2 and K = 3. Therefore, the wild cherry pool was considered as unstructured population.
When Structure was run on sweet cherries and land-races separately, the more probable number of populations was 2, with groups in correspondence with the results obtained on the pooled data set for K = 3 (Figure not shown). Lastly, when Structure was performed on modern varieties, the most likely number of populations was 2, with groups in correspondence with the results obtained on the pooled data set for K = 3 (Figure not shown).
Interestingly, the first subgroup of individuals in mod-ern varieties included all cultivars coming from the Summerland (Canada) breeding program. Moreover, many self-compatible cultivars were in this group, hav-ing then Stella, the first self-compatible cultivar, as a parent or grand-parent. Also, when parents of this first group were known, we found that Van variety was par-ent of about 10% of trees.
The second modern varieties subgroup was formed of cultivars with different origins (France, USA but none of them coming from Canada) with Burlat variety being the parent for 15% of varieties.
Based on Structure results, wild cherry was constituted of only one population, three groups in landraces and two groups in modern varieties were distinguished. The group for each studied sweet cherry individual is pro-vided in Additional file 2, Table S2. The individuals were attributed to each group based on the results within each group, and confirmed by comparing the results with the analysis on the complete data set. Indi-viduals were assigned to a group when the results obtained on the complete data set and on each cherry group were congruent. Note that some landraces were assigned as Lmixed group because the results from both
Figure 1 Structure bar plot results obtained on the whole set of data at K = 2. 1 is population identification for modern varieties, 2 is population identification for landraces and 3 is population identification for wild cherries.
analyses were not congruent. These strongly admixed landraces (Lmixed group) were removed from further analyses.
Estimation of genetic diversity in the cherry genetic pools
The average number of alleles, means of observed and expected heterozygosities as well as inbreeding coeffi-cient are reported in Table 2.
The number of alleles was slightly lower for SSRs developed inPrunus avium than for SSRs developed in other species, (7.6 vs 8.1 in wild cherry, 8.8 vs 9.3 in sweet cherry, 7.4 vs 7.9 in landraces), except in modern varieties (4.3vs 3.9). The number of alleles was also a bit lower in complex SSRs than in dinucleotide SSRs (7 vs 7.6 in wild cherry, 8 vs 8.9 in sweet cherry, 6.7 vs 7.6 in landraces and 3.8vs 4.1 in modern varieties).
An excess of heterozygosity was observed at SSRs in landraces and modern varieties, and it was significant in modern varieties. In wild cherry, theFISvalue was low but significant. As expected, the excess of heterozygosity was observed in each group at theS-locus.
Deviation of markers from neutral expectations
To obtain a neutral subsample of markers, we conducted the Fdist2 analysis on three comparisons of populations based on Structure results. We compared (1) modern varieties and landraces from the first group identified with Structure, (2) modern varieties and landraces from the second group identified with Structure, and (3) the wild cherry population and landraces that grouped together with wild cherry in the Structure analysis.
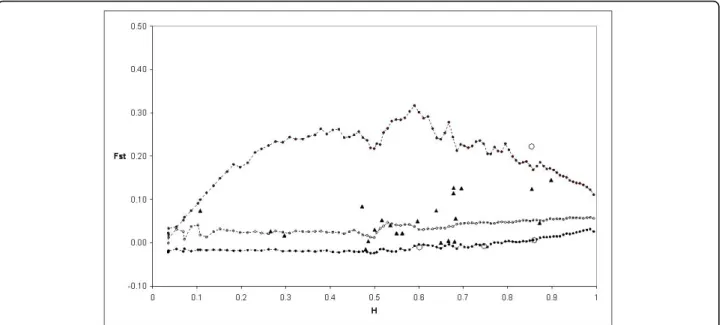
TheFST calculated by Fdist2 between Modern 1 and Landrace 1 groups was 0.059222. Based on the first analy-sis, four outlier loci were detected at the 95% level: PS12A02, EMPAS11, EMPAS14 and theS-locus. These outliers were removed for a second analysis. No outlier was detected and theFSTvalue was 0.059099. Then thisFST value was used to perform again the analysis, and the same four outliers were detected from this final run (Figure 4).
A similar analysis was done on Modern 2 and Land-race 2 groups. TheFSTwas 0.053816 and three outliers were detected at the 95% level: PCHGMS1, UDP98409 and EMPA026. After removing these three loci, theFST value was 0.048377 and no outlier was detected. How-ever, the same three outliers were detected in the last analysis using theFSTvalue of 0.048377 (Figure 5).
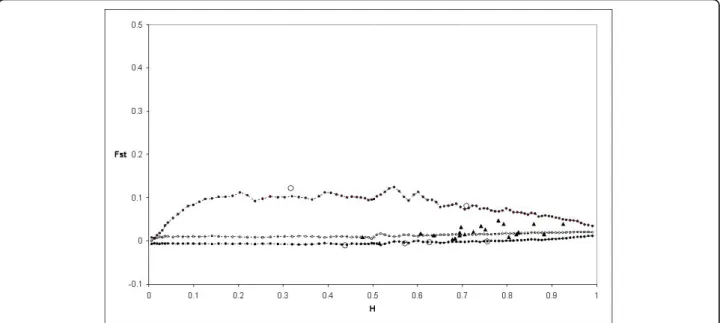
Finally, using the same procedure, the FST between Landrace 3 and wild cherry groups was 0.022269. Six outliers were detected at the 95% level: EMPA002, PCHGMS1, EMPAS11, UDP96001, EMPA004 and UDP98409. TheFSTafter removing them was 0.021650 and the same six outliers were detected using this last value ofFST(Figure 6).
Estimation of the relative loss of diversity due to domestication and breeding
Allelic richness
A larger relative loss of diversity was observed for the S-locus (24%) than for microsatellites (3%), when wild cherry was compared with landraces. A similar result was obtained when comparing wild cherry with the third group of landraces (Table 3).
Figure 2 Structure bar plot results obtained on the whole set of data at K = 3. 1 is population identification for modern varieties, 2 is population identification for landraces and 3 is population identification for wild cherries.
Table 1 PairwiseFSTand confidence interval calculated on subpopulations defined by Structure analysis
Landrace 1 Landrace 2 Landrace 3 Modern 1 Modern 2 Wild cherry Landrace 1 0.03-0.06 0.05-0.10 0.03-0.09 0.05-0.12 0.07-0.12 Landrace 2 0.05 0.02-0.04 0.06-0.13 0.03-0.08 0.03-0.06 Landrace 3 0.08 0.03 0.09-0.16 0.05-0.10 0.01-0.03 Modern 1 0.06 0.09 0.12 0.04-0.10 0.10-0.18 Modern 2 0.08 0.05 0.07 0.07 0.06-0.11 Wild cherry 0.10 0.05 0.02 0.14 0.09
Breeding had a stronger impact on diversity than domestication (Table 4). Comparisons of landraces with modern varieties revealed a loss of diversity of about 30% for the S-locus, whatever the comparison (all land-races compared with all modern varieties, or modern 1 with landrace 1, and modern 2 with landrace 2). For microsatellites, the loss of diversity was about 40% com-paring between all landraces and all modern varieties, and only 13% and 12% for landrace1/modern1 and land-race2/modern2 comparisons, respectively.
Observed heterozygosity
Unlike the number of alleles, the observed level of het-erozygosity was somewhat affected by domestication and breeding. TheS-locus is always heterozygous, cer-tainly there was no loss of observed heterozygosity, whatever the comparison (Table 3 and Table 4). For microsatellites, no loss of observed heterozygosity was observed when comparing wild cherry and landraces. A moderate decrease in microsatellite observed heterozyg-osity was observed when modern varieties were com-pared to landraces (9%), this loss being higher when comparing landrace 1 and modern 1 (20%) and slightly smaller when comparing landrace 2 and modern 2 (5%).
Expected heterozygosity
Unlike the decrease in the number of alleles, expected heterozygosity at the S-locus decreased smoothly (between 2% and 8%). The loss of expected heterozygos-ity was also moderate for microsatellites for compari-sons of wild cherry and landraces (5% and even no loss when comparing wild cherry and Landrace 3). This loss was larger for comparisons of landraces and modern varieties (between 10 and 14%).
Diversity and differentiation at the gametophytic self-incompatibility locus
We identified all theS-alleles described in wild and cul-tivated Prunus avium L., with the exception of S27 to
S32, which were originally described in non-native material in England and probably originate from Middle Eastern countries [37]. In the sweet cherry landraces pool, S17, S20, S21 and S22 alleles were identified twice, three times, twice and once, respectively.
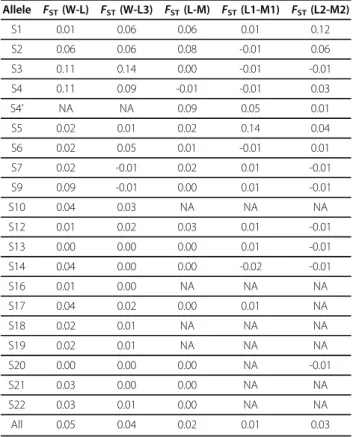
Table 5 shows the level of genetic differentiation at the S-locus. The FST between wild cherry and sweet cherry landraces was 0.05 (theFST was 0.04 when con-sidering wild cherry and landrace 3 groups). The differ-entiation between sweet cherry landraces and modern sweet cherry varieties was small (FST = 0.02), likewise between landrace 1 and modern 1 (FST = 0.01) and between landrace 2 and modern 2 (FST= 0.03). In addi-tion, FST varied considerably between alleles at this locus. High FSTvalues (>0.10) were observed for alleles S1, S3 and S4 and moderate values (between 0.05 and 0.10) were observed for alleles S2 and S9.
Discussion
One or several events of domestication of sweet cherries?
According to Pliny the Elder, cherry did not exist in Italy prior to its introduction by Lucullus from Turkey (Natural history, 15th
book). This unique reference about cherry cultivation during the Roman times implies a single introduction of cherries into western European countries, and consequently a domestication in the Mid-dle East. When considering the analysis of the whole set of data with K = 2, our analysis suggested that cherries were composed of two main groups, with admixture of the two groups for many individuals. One of the groups was genetically identical to the wild cherry we analysed and the other was independent. When considering the analysis with three populations, up to three groups of cherries were detected, but one of the groups was still genetically identical to the wild cherry group. Two sce-narios can be deduced from our results. Either a single event of domestication and then intense gene flow from
wild cherry occurred, forming differentiated groups of landraces, or secondary domestications occurred based on western wild cherry material. When looking carefully at Figure 2, we can hypothesize that both gene flow and secondary domestications may have happened. Indeed, some landraces are a clear admixture between the wild and sweet cherries groups. Moreover, some other land-races are clearly attributed to the group of wild cherries. Instead of a single domestication event, the domestica-tion of sweet cherry would then be a complex process, that may include several origins and may result from
clonal propagation of desirable genotypes and sexual reproduction with local wild cherry. This would be con-gruent with the hypothesis developed by other authors to explain the evolutionary history of clonally propa-gated domesticated plants [38].
Concerning the differentiation of material, groups 1 and 2 of sweet cherries were genetically different from the wild cherry we analysed, whereas the third group was genetically close to the wild cherry group. Neverthe-less, the differentiation between wild cherry and the first group of landraces was much higher than the differen-tiation with the second group of landraces (analysis with K = 3, differentiation in Table 1). We interpreted our results cautiously since we knew that our sampling was limited to the material conserved in French repositories. However, the differentiation of wild cherry in the wes-tern part of Europe is low [18]. Thus, under the assumption that the wild cherry we sampled is a good genetic representation of western Europe, the origin of the first group of cherries should be searched in Cauca-sia or Middle East countries. The origin of the second group of cherries may be geographically closer. Also the genetic differentiation that was observed between sweet cherries and wild cherry may result from the drift on allelic frequencies due to domestication and breeding. Our study may not offer the final conclusion because of the sampling limitation.
A significant loss of alleles during domestication and breeding
Domestication and breeding generally cause a loss of diversity due to bottleneck and genetic drift. We per-formed two types of bottleneck analyses. First, we assumed that a comparison of wild cherry and sweet cherry landraces could be used to estimate the domesti-cation bottleneck, whereas a comparison between sweet cherry landraces and modern sweet cherry varieties would estimate the breeding bottleneck. However, these comparisons can be biased by selection and by the pre-sence of structure in the genetic groups. Within popula-tion structure can also influence the detecpopula-tion of selection [39]. Therefore, we also compared diversity within the different groups identified by the Structure analyses after removing outlier loci (wild cherry/landrace 3 to assess the domestication bottleneck, modern 1/ landrace 1 and modern 2/landrace 2 to assess the breed-ing bottleneck). Results were congruent among the two types of analyses since the bottleneck associated with cherry domestication was much weaker than that asso-ciated with modern breeding, for all SSR markers and all diversity estimators (allelic richness, observed hetero-zygosity, expected heterozygosity). The magnitude of the breeding bottleneck was obviously different among the two types of analyses (pooledversus within group). This
Table 2 Average estimations of genetic diversity in wild cherry and sweet cherry genetic pools
A HO HE FIS
Wild cherry Mean (all SSRs) 9 0.65 0.68 0.04 Mean (SSRs developed in P.
avium)
8.79 0.64 0.66 0.03 Mean (SSRs developed in other
species)
9.25 0.65 0.69 0.06 Mean (dinucleotide SSRs) 8.86 0.62 0.65 0.05 Mean (complex repeat motif
SSRs)
8.10 0.67 0.70 0.04 S-locus 19 1.00 0.93 -0.08 Sweet cherry Mean (all SSRs) 7.85 0.63 0.63 -0.00
Mean (SSRs developed in P. avium)
7.64 0.63 0.62 -0.02 Mean (SSRs developed in other
species)
8.08 0.64 0.64 0.02 Mean (dinucleotide SSRs) 7.64 0.58 0.59 0.03 Mean (complex repeat motif
SSRs)
7 0.68 0.65 -0.04 S-locus 15 1.00 0.86 -0.16 Landraces Mean (all SSRs) 7.62 0.66 0.64 -0.02
Mean (SSRs developed in P. avium)
7.36 0.65 0.63 -0.03 Mean (SSRs developed in other
species)
7.92 0.66 0.65 0.01 Mean (dinucleotide SSRs) 7.57 0.59 0.60 0.04 Mean (complex repeat motif
SSRs) 6.70 0.73 0.67 -0.09 S-locus 15 1 0.86 -0.16 Modern varieties Mean (all SSRs) 4.12 0.59 0.56 -0.05 Mean (SSRs developed in P. avium) 4.29 0.57 0.54 -0.08 Mean (SSRs developed in other
species)
3.92 0.61 0.59 -0.04 Mean (dinucleotide SSRs) 4.07 0.56 0.52 -0.08 Mean (complex repeat motif
SSRs)
3.80 0.58 0.57 -0.03
S-locus 9 1 0.84 -0.19
A is the allelic richness (number of alleles), HOis the observed heterozygosity, HEis the unbiased expected heterozygosity and FISis the inbreeding coefficient, as calculated in the Genetix 4.05.2 software [48].
difference is due to the diversity present in the third group of landraces that increased the diversity in the whole group of landraces when comparing all modern varietiesversus all landraces.
Diversity after a bottleneck depends on the ratio of wild population size to cultivated population size and
the duration of the bottleneck [4,5]. In the case of cherry, as for other fruit trees, the bottleneck is probably recent because domestication occurred relatively late, so the duration of the bottleneck is likely to have been short [12]. If domestication took place in several places, there may also have been a large number of founders,
Figure 4 Distribution of FSTvalues as a function of expected heterozygosity (H) using the FSTbetween modern 1 and landrace 1
groups (0.059099). The envelope of values corresponding to neutral expectations with the infinite allele model was constructed as described by [53]. Dotted lines with plain circles represent the 0.5(1 - 0.95) and 0.5(1 + 0.95) quantiles. Dotted lines and circles represent the median of values. Triangles represent the observations not significant at 5%. Circles represent the observations significant at 5%.
Figure 5 Distribution of FSTvalues as a function of expected heterozygosity (H) using the FSTbetween modern 2 and landrace 2
groups (0.048377). The envelope of values corresponding to neutral expectations with the infinite allele model was constructed as described by [53]. Dotted lines with plain circles represent the 0.5(1 - 0.95) and 0.5(1 + 0.95) quantiles. Dotted lines and circles represent the median of values. Triangles represent the observations not significant at 5%. Circles represent the observations significant at 5%.
accounting for the small loss of diversity. By contrast, modern breeding has had a significant impact on the level of diversity, with as many as 40% of the alleles pre-sent in wild cherry lost in modern cherry varieties, for all microsatellites tested. This finding suggests that only small numbers of individuals are used as parents in cherry breeding programs. For example, in North Amer-ican breeding programs, only five founding clones are frequently used, resulting in high levels of inbreeding [40]. The use of a small number of clones in modern cherry breeding may account for the higher level of allele differentiation observed for some alleles of the S-locus than for this S-locus itself.
Nevertheless, our sampling was geographically limited, with the wild cherry sample taken from French popula-tions only. We may therefore have underestimated the bottleneck due to domestication. Based on cpDNA mar-kers, only three haplotypes were identified in sweet cherry cultivars and up to 16 haplotypes in wild cherry populations, suggesting a much more severe bottleneck [32]. However, their sweet cherry sample included
mostly modern breeding varieties, accounting for this discrepancy. Further studies should include samples cov-ering a larger geographic distribution of wild cherries, because genetic diversity in Caucasia (Georgia) may be greater than that in Europe [18] [Frédérique Santi, per-sonal communication]. Local landraces from many countries should also be included, as far as possible. Additionally, it would be useful to identify the potential ancestors of sweet cherries among wild cherry popula-tions, to obtain more insight into the genetic bottleneck.
Specific impact of domestication and breeding on genetic diversity at the S-locus
In the present study, we found 19, 15 and 9S-alleles in wild cherry, landraces and modern varieties, respectively. Consequently, based on our analysis, the domestication bottleneck was about 20%, the breeding bottleneck was about 30% and the total bottleneck was approximately 50%.
Thirteen alleles are usually described in cultivated sweet cherry, plus the S4’ allele generated by mutation
Figure 6 Distribution of FSTvalues as a function of expected heterozygosity (H) using the FSTbetween wild cherries and modern
sweet cherry varieties (0.021650). The envelope of values corresponding to neutral expectations with the infinite allele model was constructed as described by [53]. Dotted lines with plain circles represent the 0.5(1 - 0.95) and 0.5(1 + 0.95) quantiles. Dotted lines and circles represent the median of values. Triangles represent the observations not significant at 5%. Circles represent the observations significant at 5%.
Table 3 Relative loss of diversity due to domestication
AR HO HE
Number of alleles S-locus SSRs S-locus SSRs S-locus SSRs
Relative loss of diversity (Wild cherry/All landraces) 0.24 0.03 0 -0.04 0.07 0.05 Relative loss of diversity (Wild cherry/Landrace 3) 0.22 -0.04 0 -0.04 0.08 0
The loss of diversity was estimated with the allelic richness (AR), the observed heterozygosity (HO) and the expected heterozygosity (HE) in wild cherry, landraces and the third group of landraces (Landrace 3). It was estimated using all SSRs markers for the comparison between the wild cherry and all landraces, and using only markers under the assumption of neutrality for the comparison between wild cherry and the third group of landraces.
in the sweet cherry pool [41]. These alleles, except S4’, also present in wild cherry together with two additional series: S17 to S22 in Belgian wild cherries, and S27 to S32 in non-native wild cherries from Middle Eastern origin [25,37]. Then up to now, 25 alleles were described in wild cherry. Considering between 13 alleles in sweet cherry and 25 alleles in wild cherry, the total bottleneck at theS-locus is about 50%. Interestingly, this approximation is very similar to our estimate based on a limited sampling.
In this study, we identified several previously unde-scribed alleles (S17, S20, S21 and S22) in the sweet
cherry landraces pool. Similarly, S19 and S22, which have previously been identified mainly in wild cherry, were only found to be present at very low frequency in a German sweet cherry collection [42]. Thus, as for SSRs, the breeding bottleneck significantly reduced the diversity at theS-locus now used in breeding program.
Though the exact bottleneck due to domestication only is difficult to estimate, the loss of diversity at the S-locus with respect to wild cherry was greater than that at microsatellites, with a loss of 22-24% for the S-locus in sweet cherry landraces. This observation may be explained by the change of reproduction regime occur-ring duoccur-ring domestication, with the introduction of grafting– a vegetative propagation technique – and the limited use of seed production for cherry crops and for other fruit trees. Two studies have suggested that the number of alleles at a self-incompatibility locus should decrease with increasing clonality within populations [43,44]. Indeed, balancing selection on the S-locus, which promotes high allelic diversity, occurs only during sexual reproduction events. Then allelic diversity at the S-locus is expected low in highly clonal populations. This effect is reinforced further in conditions of strong drift [44]. By contrast, no loss of alleles with increasing clonality would be expected at neutral loci, since poly-morphism is protected within individuals due to fixed heterozygosity [45]. The use of grafting may therefore help to account for the continuous loss of diversity observed at the S-locus, illustrating the modification of evolutionary dynamics of sexual reproduction expected in clonally propagated crop species [38].
Conclusions
Several domestication events may have happened in sweet cherry or/and intense gene flow from local wild cherry was probably maintained along the evolutionary history of the species. A marked bottleneck due to breeding was detected with all markers in the modern sweet cherry gene pool. The bottleneck due to domesti-cation was not picked up with microsatellites, in the sample analysed here. The vegetative propagation speci-fic to some fruit trees may explain the loss of diversity observed at theS-locus during domestication.
Table 4 Relative loss of diversity due to breeding
AR HO HE
Number of alleles S-locus SSRs S-locus SSRs S-locus SSRs
Relative loss of diversity (Landraces/Modern varieties) 0.29 0.38 0 0.09 0.02 0.14 Relative loss of diversity (Landrace 1/Modern 1) 0.34 0.13 0 0.20 0.06 0.11 Relative loss of diversity (Landrace 2/Modern 2) 0.26 0.12 0 0.05 0.05 0.10
The loss of diversity was estimated with the allelic richness (AR), the observed heterozygosity (HO) and the expected heterozygosity (HE) in landraces, in modern varieties and in the sub-populations detected by Stucture. The relative loss of diversity was estimated using all SSRs markers for the comparison between the landraces and modern varieties, and using only markers under the assumption of neutrality for the comparisons between Landrace 1 and Modern 1, and between Landrace 2 and Modern 2.
Table 5FSTvalues at each allele of theS-locus
Allele FST(W-L) FST(W-L3) FST(L-M) FST(L1-M1) FST(L2-M2) S1 0.01 0.06 0.06 0.01 0.12 S2 0.06 0.06 0.08 -0.01 0.06 S3 0.11 0.14 0.00 -0.01 -0.01 S4 0.11 0.09 -0.01 -0.01 0.03 S4’ NA NA 0.09 0.05 0.01 S5 0.02 0.01 0.02 0.14 0.04 S6 0.02 0.05 0.01 -0.01 0.01 S7 0.02 -0.01 0.02 0.01 -0.01 S9 0.09 -0.01 0.00 0.01 -0.01 S10 0.04 0.03 NA NA NA S12 0.01 0.02 0.03 0.01 -0.01 S13 0.00 0.00 0.00 0.01 -0.01 S14 0.04 0.00 0.00 -0.02 -0.01 S16 0.01 0.00 NA NA NA S17 0.04 0.02 0.00 0.01 NA S18 0.02 0.01 NA NA NA S19 0.02 0.01 NA NA NA S20 0.00 0.00 0.00 NA -0.01 S21 0.03 0.00 0.00 NA NA S22 0.03 0.01 0.00 NA NA All 0.05 0.04 0.02 0.01 0.03
The level of genetic differentiation for each allele at the S-locus was estimated with the Fstat 2.9.3.2 software [52]. W is for wild cherry, L is for landraces, M for modern varieties; L1, L2 and L3 are respectively for the group 1, group 2 and group 3 of landraces as defined by the Structure software; M1 and M2 are respectively for the group 1 and group 2 of modern varieties as defined by the Structure software.
This study provides insights into domestication events and evolutionary history of cherry, however, requires confirmation on a larger sampling scheme for both sweet cherry landraces and wild cherry.
Methods
Plant materials
We assessed sweet cherry diversity based on 207 vari-eties sampled from the INRA Bordeaux Prunus Genetic Resources Centre, the INRA Bordeaux sweet cherry breeding collection and the CTIFL collection. This sam-ple consisted of 141 landraces and 66 modern varieties. Many landraces were of unknown origin, but the sample included varieties from very probable origin in France, Belgium, the Czech Republic, Germany, Hungary, Spain, Italy, Iran, Romania and Turkey. The origin of modern varieties was more evident since they were obtained from various breeding programs (Australia, Canada, the Czech Republic, France, Italy, and USA). Detailed infor-mation on varieties was provided in Additional file 2, Table S2. The 211 studied wild cherry individuals were sampled from the INRA Orléans collection. Trees were originally collected in France, with sampling from most regions.
Choice of markers and molecular genotyping
Individuals were genotyped for 26 SSRs and the gameto-phytic self-incompatibility locus. For SSRs, markers were chosen on the basis of the ease of amplification in cherry, their location onPrunus maps and the type of polymorphism of each marker (dinucleotides or other repeats). The list of SSR markers is given in Table 6.
For six markers (UDP96001, UDP96005, UDP98409, PCHGMS1, PCEGA34 and PS12A02), we used data obtained by simplex amplification and silver staining analysis [18,46]. For the other 20 markers, the protocol was as follows. DNA was extracted from leaves using the DNeasy® 96 plant kit (QIAGEN, Germany). Multi-plex PCR was carried out with the Type It Microsatellite PCR Kit® (QIAGEN, Germany). PCR was carried out in a volume of 20μl, containing 4 ng genomic DNA, 1× multiplex PCR master mix and between 0.12 and 0.48 μM of each primer. Tests were first carried out to opti-mise the amount of primer used for each marker. Four multiplex PCRs were used to amplify all 20 markers. PCR conditions were as recommended by the kit manu-facturers. The PCR products were diluted (1/400), sub-jected to agarose gel electrophoresis and analysed with an ABI 3730 sequencer, according to the manufacturer’s instructions. Allele sizes were determined with Gene-mapper software (Applied Biosystems, USA).
We analysed variability at the gametophytic self-incompatibility locus, using fluorescently labelled pri-mers to amplify both the SFB intron and the first intron
of the S-RNase gene[26,27]. For each sweet cherry land-race, the genotypes of which had not previously been determined for these two loci, data were acquired from two independent clones (two trees of the same landrace were sampled and two DNA extractions, two PCR amplifications and two sequencer runs were then carried out). The runs were independently read by two people, to confirm the results obtained.
Structure analysis of the genetic pool
In order to understand the distribution of genetic diver-sity in our sample, we used a model-based clustering approach as implemented in Structure software version 2.3.1 to infer population structure of wild and sweet cherries [47]. For each analysis, Structure was run with different values of the number of clusters (K) varying from 1 to 8 under the admixture model with no prior
Table 6 Information concerning the markers used Marker name Linkage group Repeat motif Reference
UDP96005 1 (AC)16TG(CT)2CA(CT)11 [54]
EMPA002 1 (AG)13 [55]
EMPA003 1 (AC)8 [55]
EMPA005 1 (CT)3CAT(CT)12T(AC)23 [55]
PCHGMS1 2 (AC)12(AT)6 [56] PCEGA34 2 NA [57] UDP98411 2 (TC)16 [58] BPPCT034 2 (GA)19 [46] EMPA017 2 (AG)19 [55] EMPaS02 3 (TTG)7ctgc(TG)10(AG)8 [59]
EMPaS12 3 (TG)10a/GA)10aa(GA)13 [59]
PS12A02 4 NA [60]
BPPCT040 4 (GA)14 [46]
EMPaS06 4 (CT)12 [59]
EMPaS10 4 (GA)28 [59]
EMPaS11 5 (TC)25 [59]
EMPaS14 5 (TC)10ccat(TC)5ccat(TC)8 [59]
UDP96001 6 (CA)17 [54]
UDP98021 6 (GA)22(CA)11 [58]
UDP98412 6 (AG)28 [58]
EMPA004 6 (GA)4AA(GA)4AA(GA)15 [55]
EMPaS01 6 (GA)9(GA)11 [59]
UCDCH14 7 (CT)18 [30]
UDP98409 8 (AG)19 [54]
EMPA018 8 (GA)18 [55]
EMPA026 8 complex (CT) [61]
Linkage group position is given based on information published for a cherry map (inter-specific cross Prunus avium’Napoleon’ × P. nipponica), except for BPCCT034 for which the position is given based on a work published on another cherry map [61,62].
The repeat motif of each marker is given based on information provided, or not, by the original reference that published primers for the marker.
population information. To verify the consistency of the results, we performed 10 independent runs per K value with 50,000 burn-in period and 50,000 MCMC replica-tions. The run with the maximum likelihood was used to assign the most probable number of subpopulations, which was determined using an ad hoc statistic based on the rate of change in the log probability of data between successive K values [36].
The Structure analysis was performed on the whole dataset to test whether wild and sweet cherries pools can be identified. It was run afterwards on four separate groups: 1/ wild cherries, 2/ sweet cherries, and, within sweet cherries, 3/ landraces, 4/ modern varieties.
To assess the level of differentiation among sub-groups identified by Structure, pairwise FSTand confi-dence intervals were calculated using Genetix 4.05 soft-ware [48].
Analysis of the genetic variation among identified genetic clusters
After characterising the genetic structure of cherries, our second aim was to assess the bottleneck possibly due to breeding and domestication. However, strictly speaking, the domestication bottleneck estimation should be done using the wild cherry sub-population from which domestication was performed. Similarly, the breeding bottleneck can be estimated either considering the whole set of landraces and modern varieties or com-paring between landraces and modern varieties from the same ancestral group.
Besides, selection is an evolutionary force that can affect the estimation of bottleneck, and a natural set of markers should be obtained before analysing bottleneck due to successive samplings. Nonetheless, within popu-lation structure can modify the detection of selected locus [39].
Consequently, after the basic analysis of diversity in each group (wild cherry, sweet cherry, landraces, mod-ern varieties), we performed two types of comparisons. First we compared diversity (1) between wild cherry and all landraces and (2) between landraces and modern varieties, without testing for selection because of sub-structure in landraces and modern varieties. Second, after testing markers for selection, we compared one of the group of landraces with wild cherry since these two groups were genetically connected (see the Results sec-tion), modern varieties and landraces from the same first group (see the Results section), and finally modern varieties and landraces from the same second group (see the Results section).
Basic diversity analysis
The number of alleles (A), the allelic richness (AR), the observed heterozygosity (HO), the unbiased heterozygos-ity (HE) and the inbreeding coefficientFISwere assessed
for each locus on wild cherry, sweet cherries, modern varieties and landraces, but also on each group as defined using Structure (two groups of modern varieties and three groups of landraces). See definitions of esti-mators in [49-51]. Mean values and standard deviations were calculated for each population.
Since markers were developed on different species, and this may influence marker polymorphims, we also compared the mean values between the set of markers developed in sweet cherries and the set of markers developed in other species. Finally, we also calculated the mean values of dinucleotide markers and the mean values of complex repeat motif.
Most estimators were calculated using Genetix 4.05 software, except for the allelic richness that was esti-mated using Fstat 2.9.3.2 software [48,52].
Constituting sub-samples of neutral markers
Selection at or near a marker may affect the diversity and differentiation of that marker, accounting for some of the observed variation between groups. Since we are interested in characterizing the variation of diversity mainly due to domestication or breeding bottleneck, we thus tested for selection to define a sub-sample of neu-tral markers on which we made the genetic diversity analysis. For this purpose we used the method devel-oped by [53]. This method involves the detection of unusually high or low levels of FST, by plotting FST against heterozygosity on the set of markers.
As we compared diversity between wild cherry, land-races and modern varieties, Fdist2 was conducted on three population pairs: 1/ wild cherry/landraces that may originate from France (see the Results section), and two comparisons of landraces and modern varieties with the same origin (see the Results section). For each com-parison, we ran 50,000 simulations using the infinite allele model for markers. A first analysis revealed a first set of outliers. They were removed and a newFST was calculated, which was used to make a new analysis, revealing a possible second set of outliers. The analysis was iterated until no further locus fell outside of the expected distribution. The last value ofFSTwas used as the neutral value to detect outliers on the whole set of data.
Diversity comparisons
The relative loss of diversity was estimated based on neutral markers as defined before. The relative loss of diversity was estimated with three diversity estimators: the allelic richness, the observed heterozygosity and the expected heterozygosity as described by [7]. For each estimator, the relative loss of diversity was estimated by calculating 1-(DIV1/DIV2), where DIV1is the estimator of diversity in the supposed derivating genetic pool and DIV2 is the estimator of diversity in the supposed origi-nating genetic pool. The relative loss of diversity was
estimated between wild cherry and landraces and between landraces and modern varieties. The relative loss of diversity was also estimated between the wild cherry and the landraces that may originate from France (see the Results section), between landraces and modern varieties with the same origin (see the Results section).
Allelic composition and differentiation at the gametophytic self-incompatibility locus
The frequency of eachS-allele was calculated in each group (wild cherry, landraces and modern varieties and also in each subgroup indentified by Structure). More-over, the level of genetic differentiation for each allele at the S-locus was estimated using Fstat 2.9.3.2 software [52].
Additional material
Additional file 1: Table S1. Information on the level of admixture in groups defined with the Structure software. Proportion of
membership of each pre-defined population in each of the three clusters (results from one run of Structure on the complete dataset). Colors (green, red and blue) refer to Figure 2.
Additional file 2: Table S2. Information on studied sweet cherry varieties. The code indicates the reference of the variety in the national register of introduction for cherries. The name is the one with which the variety was introduced in the INRA (or CTIFL) collection. The exact origin is given when known by the authors. A large group of studied landraces are included in the“French cherries national collection” but this means that varieties were usually cultivated in France, this does not mean that they were domesticated in France, or created in France. The partition between landrace and modern was done based on the available information on varieties (varieties known before the 20thbreeding
programs were put in the landrace group and varieties developed after, and especially recent hybrids, were put in the modern group). The group was assigned based on Structure analysis within each cherry group, and confirmed by comparing the results with the analysis on the complete data set. Individuals were assigned to a group when the results obtained on the complete data set and on each cherry group were congruent. M1 and M2 are the two groups identified for modern varieties, L1, L2 and L3 are the three groups identified for landraces. Note that some landraces were assigned as Lmixed group because the results from both analyses were not congruent.
Acknowledgements
We thank François Hubert (BIOGECO), Claire Thiéry (CTIFL), Sandra Cortijo (UREF) and Mohamed-Amine Belka (UREF) for their help in acquiring genetic data. We thank Emilie Balsemin, Hélène Christmann and Jacques Joly for helping to sample leaves from the INRA sweet cherry collections (Genetic Resources Centre and breeding collections). We thank Frédérique Santi and Jean Dufour for helping to sample leaves from the INRA wild cherry collection (breeding collection). We thank Stéphane Decroocq for helpful discussions on microsatellite multiplex PCR. We also thank Véronique Decroocq for her help in acquiring funding for Uraiwan Arunyawat. Finally, we thank the INRA Plant Genetics and Breeding Department for funding this work (PrunusDiv genotyping project) and the Region Aquitaine for funding Uraiwan Arunyawat.
Author details
1
INRA, Unité de Recherche sur les Espèces Fruitières, Domaine de la Grande Ferrade, 71 avenue Edouard Bourlaux, BP 81, 33883 Villenave d’Ornon Cedex, France.2INRA, UMR GDPP, Domaine de la Grande Ferrade, 71 avenue
Edouard Bourlaux, BP 81, 33883 Villenave d’Ornon Cedex, France.3INRA,
UMR DIAPC, Domaine de Melgueil, 34130 Mauguio, France.4Centre
technique interprofessionel des fruits et légumes, DSTFL-équipe Fruits, Centre Ctifl de Balandran, BP32, 30127 Bellegarde, France.5INRA, UMR
BIOGECO 1202, Domaine de l’Hermitage, BP45, 33611 Gazinet-Cestas Cedex, France.6Department of Genetics, Faculty of Science, Kasetsart University,
Bangkok 10900, Thailand.7INRA, UMR GDPP, Domaine de la Grande Ferrade, 71 avenue Edouard Bourlaux, BP 81, 33883 Villenave d’Ornon Cedex, France. Authors’ contributions
SM conceived of the study, participated in molecular genetic studies and in statistical analyses and drafted the manuscript. MT participated in the design of the study, participated in molecular genetic studies and helped to draft the manuscript. UA participated in statistical analyses and helped to draft the manuscript. GC carried out the molecular genetic studies. MM participated in the design of the study and participated in S-locus characterization. FS participated in the design of the molecular genetic studies. All authors read and approved the final manuscript.
Received: 20 April 2010 Accepted: 20 August 2010 Published: 20 August 2010
References
1. Glémin S, Bataillon T: A comparative view of the evolution of grasses under domestication. New Phytol 2009, 183:273-290.
2. Wright SI, Bi IV, Schroeder SG, Yamasaki M, Doebley JF, McMullen MD, Gaut BS: The effects of artificial selection of the maize genome. Science 2005, 308:1310-1314.
3. Hyten DL, Song QJ, Zhy YL, Choi IY, Nelson RL, Costa JM, Specht JE, Shoemaker RC, Cregan PB: Impacts of genetic bottlenecks on soybean genome diversity. P Natl Acad Sci USA 2006, 103:16666-16671. 4. Tenaillon MI, U’Ren J, Tenaillon O, Gaut BS: Selection vs demography: A
multilocus investigation of the domestication process in maize. Mol Biol Evol 2004, 21:1214-1225.
5. Haudry A, Cenci A, Ravel C, Bataillon T, Brunel D, Poncet C, Hochu I, Poirier S, Santoni S, Glemin S, David J: Grinding up wheat: A massive loss of nucleotide diversity since domestication. Mol Biol Evol 2007, 24:1506-1517.
6. Zhu QH, Zheng XM, Luo JC, Gaut BS, Ge S: Multilocus analysis of nucleotide variation of Oryza sativa and its wild relatives: Severe bottleneck during domestication of rice. Mol Biol Evol 2007, 24:875-888. 7. Vigouroux Y, Mitchell S, Matsuoka Y, Hamblin M, Kresovich S, Smith JSC,
Jaqueth J, Smith OS, Doebley J: An analysis of genetic diversity across the maize genome using microsatellites. Genetics 2005, 169:1617-1630. 8. Figueiredo LFD, Calatayud C, Dupuits C, Billot C, Rami JF, Brunel D,
Perrier X, Courtois B, Deu M, Glaszmann JC: Phylogeographic evidence of crop neodiversity in sorghum. Genetics 2008, 179:997-1008.
9. MacHugh DE, Shriver MD, Loftus RT, Cunningham P, Bradley DG: Microsatellite DNA variation and the evolution, domestication and phylogeography of taurine and Zebu cattle (Bos taurus and Bos indicus). Genetics 1997, 146:1071-1086.
10. Papa R, Gepts P: Asymmetry of gene flow and differential geographical structure of molecular diversity in wild and domesticated common bean (Phaseolus vulgaris L.) from Mesoamerica. Theor Appl Genet 2003, 106:239-250.
11. Zohary D, Spiegel-Roy P: Beginnings of fruit growing in Old World. Science 1975, 187:319-327.
12. Zohary D, Hopf M: Fruit trees and nuts. Domestication of plants in the Old World. The origin and spread of cultivated plants in West Asia, Europe and the Nile Valley Oxford University Press, 3 2000, 142-191.
13. Sostaric R, Kuster H: Roman plant remains from Veli Brijun (island of Brioni), Croatia. Veg Hist Archaeobot 2001, 10:227-233.
14. Pollmann B, Jacomet S, Schlumbaum A: Morphological and genetic studies of waterlogged Prunus species from the Roman vicus Tasgetium (Eschenz, Switzerland). J Archaeol Sci 2005, 32:1471-1480.
15. Rosch M: New aspects of agriculture and diet of the early medieval period in central Europe: waterlogged plant material from sites in south-western Germany. Veg Hist Archaeobot 2008, 17:S225-S238.
16. Frascaria N, Santi F, Gouyon PH: Genetic differentiation within and among populations of chestnut (Castanea sativa Mill.) and wild cherry (Prunus avium L.). Heredity 1993, 70:634-641.
17. Mariette S, Lefranc M, Legrand P, Taneyhill D, Frascaria-Lacoste N, Machon N: Genetic variability in wild cherry populations in France. Effects of colonizing processes. Theor Appl Genet 1997, 94:904-908. 18. Tavaud M: Diversité génétique du cerisier doux (Prunus avium L.) sur son aire
de répartition: Comparaison avec ses espèces apparentées (P. cerasus et P. × gondouinii) et son compartiment sauvage ENSAM-Montpellier PhD 2002. 19. Stoeckel S, Castric V, Mariette S, Vekemans X: Unequal allelic frequencies
at the self-incompatibility locus within local populations of Prunus avium L.: an effect of population structure? J Evolution Biol 2008, 21:889-899. 20. Ducci F, Santi F: The distribution of clones in managed and unmanaged
populations of wild cherry (Prunus avium L.). Can J For Res 1997, 27:1998-2004.
21. Stoeckel S, Grange J, Fernandez-Manjarres JF, Bilger I, Frascaria-Lacoste N, Mariette S: Heterozygote excess in a self-incompatible and partially clonal forest tree species - Prunus avium L. Mol Ecol 2006, 15:2109-2118. 22. Vaughan SP, Cottrell JE, Moodley DJ, Connolly T, Russell K: Clonal structure
and recruitment in British wild cherry (Prunus avium L.). Forest Ecol Manag 2007, 242:419-430.
23. Vaughan SP, Cottrell JE, Moodley DJ, Connolly T, Russell K: Distribution and fine-scale spatial-genetic structure in British wild cherry (Prunus avium L.). Heredity 2007, 98:274-283.
24. Höltken AM, Gregorius HR: Detecting local establishment strategies of wild cherry (Prunus avium L.). BMC Ecol 2006, 6-13.
25. De Cuyper B, Sonneveld T, Tobutt KR: Determining self-incompatibility genotypes in Belgian wild cherries. Mol Ecol 2005, 14:945-955. 26. Sonneveld T, Robbins TP, Tobutt KR: Improved discrimination of
self-incompatibility S-RNase alleles in cherry and high throughput genotyping by automated sizing of first intron polymerase chain reaction products. Plant Breeding 2006, 125:305-307.
27. Vaughan SP, Russell K, Sargent DJ, Tobutt KR: Isolation of S-locus F-box alleles in Prunus avium and their application in a novel method to determine self-incompatibility genotype. Theor Appl Genet 2006, 112:856-866.
28. Gerlach HK, Stosser R: Patterns of random amplified polymorphic DNAs for sweet cherry (Prunus avium L.) cultivar identification. J Appl Bot Food Qual 1997, 71:212-218.
29. Struss D, Boritzki M, Glozer K, Southwick SM: Detection of genetic diversity among populations of sweet cherry (Prunus avium L.) by AFLPs. J Hortic Sci Biotech 2001, 76:362-367.
30. Struss D, Ahmad R, Southwick SM, Boritzki M: Analysis of sweet cherry (Prunus avium L.) cultivars using SSR and AFLP markers. J Am Soc Hortic Sci 2003, 128:904-909.
31. Lacis G, Rashal I, Ruisa S, Trajkovski V, Iezzoni AF: Assessment of genetic diversity of Latvian and Swedish sweet cherry (Prunus avium L.) genetic resources collections by using SSR (microsatellite) markers. Sci Hortic 2009, 121:451-457.
32. Panda S, Martin JP, Aguinagalde I, Mohanty A: Chloroplast DNA variation in cultivated and wild Prunus avium L.: a comparative study. Plant Breeding 2003, 122:92-94.
33. Richman AD, Kohn JR: Self-incompatibility alleles from Physalis: Implications for historical inference from balanced genetic polymorphisms. P Natl Acad Sci USA 2000, 96:168-172.
34. Glémin S, Bataillon T, Ronfort J, Mignot A, Olivieri I: Inbreeding depression in small populations of self-incompatible plants. Genetics 2001, 159:1217-1229.
35. Igic B, Bohs L, Kohn JR: Historical inferences from the self-incompatibility locus. New Phytol 2003, 161:97-105.
36. Evanno G, Regnaut S, Goudet J: Detecting the number of clusters of individuals using the software STRUCTURE: a simulation study. Mol Ecol 2005, 14:2611-2620.
37. Vaughan SP, Boskovic RI, Gisbert-Climent A, Russell K, Tobutt KR: Characterisation of novel S-alleles from cherry (Prunus avium L.). Tree Genet Genomes 2008, 4:531-541.
38. McKey D, Elias M, Pujol B, Duputié A: The evolutionary ecology of clonally propagated domesticated plants. New Phytol 2010, 186:318-332. 39. Excoffier L, Hofer T, Foll M: Detecting loci under selection in a
hierarchically structured population. Heredity 2009, 103:285-298. 40. Choi C, Kappel F: Inbreeding, coancestry and founding clones of sweet
cherries from North America. J Am Soc Hortic Sci 2004, 129:535-543. 41. Lewis D, Crowe LK: Structure of the incompatibility gene. IV. Types of
mutations in Prunus avium L. Heredity 1954, 8:357-363.
42. Schuster M, Flachowsky H, Kohler D: Determination of self-incompatible genotypes in sweet cherry (Prunus avium L.) accessions and cultivars of the German Fruit Gene Bank and from private collections. Plant Breeding 2007, 126:533-540.
43. Vallejo-Marín M, Uyenoyama MK: On the evolutionary modification of self-incompatibility: implications of partial clonality for allelic diversity and genealogical structure. Self-Incompatibility in Flowering Plants. Evolution, Diversity, and Mechanisms Franklin-Tong VE 2008, 53-71.
44. Navascués M, Stoeckel S, Mariette S: Genetic diversity and fitness in small populations of partially clonal self-incompatible plants. Heredity AOP 2010.
45. Balloux F, Lehmann L, de Meeus T: The population genetics of clonal and partially clonal diploids. Genetics 2003, 164:1635-1644.
46. Dirlewanger E, Cosson P, Tavaud M, Aranzana MJ, Poizat C, Zanetto A, Arus P, Laigret F: Development of microsatellite markers in peach [Prunus persica (L.) Batsch] and their use in genetic diversity analysis in peach and sweet cherry (Prunus avium L.). Theor Appl Genet 2002, 105:127-138. 47. Pritchard JK, Stephens M, Donnelly P: Inference of population structure
using multilocus genotype data. Genetics 2000, 155:945-959.
48. Belkhir K, Borsa P, Chikhi L, Raufaste N, Bonhomme F: GENETIX 4.05, logiciel sous Windows TM pour la génétique des populations Laboratoire Génome, Populations, Interactions, CNRS UMR 5171, Université de Montpellier II, Montpellier (France) 1996.
49. Petit RJ, El Mousadik A, Pons A: Identifying populations for conservation on the basis of genetic markers. Conserv Biol 1998, 12:844-855.
50. Nei M: Estimation of average heterozygosity and genetic distance from a small number of individuals. Genetics 1978, 89:583-590.
51. Weir BS, Cockerham CC: Estimating F-statistics for the analysis of population structure. Evolution 1984, 38:1358-1370.
52. Goudet J: FSTAT (vers. 1.2): a computer program to calculate F-statistics. J Hered 1995, 86:485-486.
53. Beaumont MA, Nichols RA: Evaluating loci for use in the genetic analysis of population structure. P Roy Soc B-Biol Sci 1996, 263:1619-1626. 54. Cipriani G, Lot G, Huang WG, Marrazzo MT, Peterlunger E, Testolin R: AC/GT
and AG/CT microsatellite repeats in peach [Prunus persica (L.) Batsch]: isolation, characterisation and cross-species amplification in Prunus.. Theor Appl Genet 1999, 99:65-72.
55. Clarke JB, Tobutt KR: Development and characterization of polymorphic microsatellites from Prunus avium’Napoleon’. Mol Ecol Notes 2003, 3:578-580.
56. Sosinski B, Gannavarapu M, Hager LD, Beck LE, King GJ, Ryder CD, Rajapakse S, Baird WV, Ballard RE, Abbott AG: Characterization of microsatellite markers in peach [Prunus persica (L.) Batsch]. Theor Appl Genet 2000, 101:421-428.
57. Downey SL, Iezzoni AF: Polymorphic DNA markers in black cherry (Prunus serotina) are identified using sequences from sweet cherry, peach, and sour cherry. J Am Soc Hortic Sci 2000, 125:76-80.
58. Testolin R, Marrazzo T, Cipriani G, Quarta R, Verde I, Dettori MT, Pancaldi M, Sansavini S: Microsatellite DNA in peach (Prunus persica L. Batsch) and its use in fingerprinting and testing the genetic origin of cultivars. Genome 2000, 43:512-520.
59. Vaughan SP, Russell K: Characterization of novel microsatellites and development of multiplex PCR for large-scale population studies in wild cherry, Prunus avium. Mol Ecol Notes 2004, 4:429-431.
60. Joobeur T, Periam N, Vicente MC, King GJ, Arus P: Development of a second generation linkage map for almond using RAPD and SSR markers. Genome 2000, 43:649-655.
61. Clarke JB, Sargent DJ, Boskovic RI, Belaj A, Tobutt KR: A cherry map from the inter-specific cross Prunus avium’Napoleon’ × P. nipponica based on microsatellite, gene-specific and isoenzyme markers. Tree Genet Genomes 2009, 5:41-51.
62. Olmstead JW, Sebolt AM, Cabrera A, Sooriyapathirana SS, Hammar S, Iriarte G, Wang D, Chen CY, van der Knaap E, Iezzoni AF: Construction of an intra-specific sweet cherry (Prunus avium L.) genetic linkage map and synteny analysis with the Prunus reference map. Tree Genet Genomes 2008, 4:897-910.
doi:10.1186/1471-2156-11-77
Cite this article as: Mariette et al.: Population structure and genetic bottleneck in sweet cherry estimated with SSRs and the gametophytic self-incompatibility locus. BMC Genetics 2010 11:77.