HAL Id: halshs-01339815
https://halshs.archives-ouvertes.fr/halshs-01339815v2
Submitted on 7 Dec 2016
HAL is a multi-disciplinary open access
archive for the deposit and dissemination of
sci-entific research documents, whether they are
pub-lished or not. The documents may come from
teaching and research institutions in France or
L’archive ouverte pluridisciplinaire HAL, est
destinée au dépôt et à la diffusion de documents
scientifiques de niveau recherche, publiés ou non,
émanant des établissements d’enseignement et de
recherche français ou étrangers, des laboratoires
Are critical slowing down indicators useful to detect
financial crises?
Hayette Gatfaoui, Isabelle Nagot, Philippe de Peretti
To cite this version:
Hayette Gatfaoui, Isabelle Nagot, Philippe de Peretti. Are critical slowing down indicators useful to
detect financial crises?. 2016. �halshs-01339815v2�
Documents de Travail du
Centre d’Economie de la Sorbonne
Are critical slowing down indicators useful to
detect financial crises?
Hayette G
ATFAOUI,Isabelle N
AGOT, Philippe D
eP
ERETTI2016.45R
Are critical slowing down indicators useful to
detect …nancial crises?
Hayette Gatfaoui, Isabelle Nagot
y, Philippe de Peretti
z,
November 15, 2016
Abstract
In this article, we consider …nancial markets as complex dynamical systems, and check whether the critical slowing down indicators can be used as early warning signals to detect a phase transition. Using various rolling windows, we analyze the evolution of three indicators: i) First-order autocorrelation, ii) Variance, and iii) Skewness. Using daily data for ten European stock exchanges plus the United States, and focusing on the Global Financial Crisis, our results are mitigated and depend both on the series used and the indicator. Using the main (log) indices, critical slowing down indicators seem weak to predict to Global Financial Crisis. Using cumulative returns, for almost all countries an increase in variance and skewness does precede the crisis. However, …rst-order autocorrela-tions of both log-indices and cumulative returns do not provide any useful
IESEG School of Management (LEM-CNRS), Centre d’Economie de la Sorbonne (CES) and Labex ReFi, Socle de la Grande Arche 1 Parvis de La Défense - F-92044 Paris La Défense cedex. email: [email protected], [email protected]
yCentre d’Economie de la Sorbonne (CES), Université Paris1 Panthéon-Sorbonne and Labex ReFi, 106-112 Boulevard de l’Hôpital, 75013 Paris. email: [email protected].
zCorresponding Author. Centre d’Economie de la Sorbonne (CES), Université Paris1 Panthéon-Sorbonne, 106-112 Boulevard de l’Hôpital, 75013 Paris. email: [email protected].
information about the Global Financial Crisis. Thus, only some of the reported critical slowing down indicators may have informational content, and could be used as early warnings.
Keywords:Critical slowing down, Complex dynamical system, Global …nancial crisis, Phase transition.
JEL codes: C1, C4.
1
Introduction
The rapid succession of …nancial crises over these recent years has created a strong incentive to build some tools able to predict crises, i.e. early warning signals. One very appealing framework, widely used with success in ecology, climatology (Dakos et al. [DAK 08]) or physics is to consider that systems are complex or self-critically organized (Sornette [SOR 09]). Under such a frame-work, systems can switch between multiple equilibria without external forces (Sche¤er [SCH 09], [SCH 12]). In other words, the complex dynamic interplay between each particle of the system will lead to a phase transition or a bifurca-tion (Kuehn [KUE 11]).
Within complex systems, the critical slowing down (CSD) concept is useful to predict critical transitions. Critical slowing down refers to the fact that a system becomes less and less able to absorb shocks and then to come back to an equilibrium state. In particular, the accumulation of shocks can alter the resilience of the system, driving it towards a critical transition, i.e. the system will switch to an other state. Before that transition, the changes will become slower and slower and as a consequence, for a particular series, the auto-correlation at lag one will increase, as well as the variance, and maybe other higher moments. Critical slowing down is therefore appealing because it allows for studying phase transitions within a theoretical framework with very simple tools, and without having to specify the particular underlying model.
The goal of this paper is to empirically investigate the CSD concept, when applied to …nancial markets. For this prospect, we focus on stock exchanges for
ten European countries plus the United States, from the post Dot.com bubble up to the beginning of the Global Financial Crisis (GFC). We focus on two kinds of data, the main indices, in log-form, as suggested by Diks et al. [DIK 15] within a similar framework, and the cumulative returns, which are considered as a re-scalling of main indices. Then, we analyze whether auto-correlations at lag one, as well as moments of orders two and three increase before the crisis, thus signaling a phase transition. Following Lenton et al. [LEN 12], our study is performed on large rolling windows of size T =2 and T =4, T being the length of the whole sample period, and on detrended data, using a Gaussian kernel with a low bandwith.
Whereas CSD has turned to be very useful in other domains, our results are here quite mitigated. Compared to Diks et al. [DIK 15], we …rst show that us-ing log-indices, basus-ing our analysis on …rst-order autocorrelations, leads to false alarms. At best, and unexpectedly the analysis might have an informational content about the May 2006 market crash, but not about the Global Financial Crisis, i.e. not about a phase transition. There is no information in the evolution of the variances and skewness, which questions the use of log-indices in this kind of analysis. Applied to cumulative returns, indicators, do provide an important information about the GFC, but only through upward trends in variances and sudden downward trends in skewness. But still, …rst-order autocorrelations pro-vide no useful information. Since upward trends in variances have been reported by several authors, such as Hens and Schenk-Hoppe [HEN 09] in other frame-works, and since …rst-order autocorrelations are considered as the main indicator of CSD, concluding about the validity of CSD is by far not straightforward.
Our paper is organized as follows. Section 2 focuses on theoretical as-pects while introducing CSD concept, indicators and related measurement tools. Then, section 3 implements the empirical analysis and displays CSD indicators. Finally, section 4 proposes concluding remarks.
2
Theory
Over past and recent history, …nancial markets have been subject to several sudden changes, i.e. regime shifts. Such abrupt changes depict critical transi-tions from a non-depressed or normal state to a depressed or crisis state and conversely. Shifts occur when the considered system, such as a given set of …nan-cial markets, reaches a critical threshold frequently named tipping point (Dakos et al. [DAK 08]). In particular, the system converges towards a tipping point around which it becomes more and more unable to absorb small shocks (Kuehn [KUE 11]). As a result, its ability to recover from such perturbations slows down (see for example the fold catastrophe model, Sche¤er [SCH 09]), so that its potential for recovery becomes also low, i.e. zero recovery rate and increas-ing recovery time are observed (van Nes and Sche¤er [NES 07]). Indeed, the dynamical system exhibits a decreasing resilience (Dai et al. [DAI 12]). Under such a low resilience regime, the system loses e¢ ciency and accumulative small perturbations1 can trigger the system’s shift to a depressed state, i.e. a critical
transition (Carpenter et al. [CAR 11], Sche¤er [SCH 09]). Such phenomenon is called critical slowing down (van Nes and Sche¤er [NES 07], Sche¤er [SCH 09], Wissell [WIS 84]).
Under a slowing down regime, the pattern of data ‡uctuations undergoes modi…cations, which can be characterized by a set of three indicators. Such indicators signal the closeness of the system to a tipping point. Firstly, among predicted changes, data auto-correlation should increase (Livina and Lenton [LIV 07], Ives [IVE 95]). When the system converges towards a tipping point, it becomes less able to recover from perturbations and remains therefore close to its previous state. As a result, data auto-correlation should increase in the short run, i.e. lag-1 auto-correlation. Such memory phenomenon will help trap the system in the depressed state. For example, the higher the lag-1 auto-correlation becomes, the slower the recovery of the system is (Ives [IVE 95],
1Such perturbations can consist of a possible combination of additive and multiplicative noises.
van Nes and Sche¤er [NES 07]). Such a characteristic can be observed a long time before the critical transition (Dakos et al. [DAK 08]). Secondly, critical slowing down can also translate into an increase and sometimes a decrease in variance (Berglund and Gentz [BER 06], Carpenter and Brock [CAR 06], Dakos et al. [DAK 12]). In the vicinity of a tipping point, shocks keep the same mag-nitude and accumulate within the system, which increases the variance of the system’s fundamentals. Alternatively, following its low recovery rate, the sys-tem shouldn’t be able to ‡uctuate too much around its prevailing state so that fundamentals’variance should decrease. Under the …rst scenario, the increase in variance happens before the occurrence of a critical transition. Thirdly, an in-crease in ‡uctuations’asymmetry, i.e. skewness, can arise before the occurrence of a catastrophic bifurcation. Under the fold catastrophe model for example, the system can reach two alternative stable equilibrium states (solid lines) and one intermediate unstable equilibrium state (dashed line, see …gure 1). Speci…cally, unstable equilibria illustrate the border between the basins of attractions of the two previous stable states. When slowing down, the system stays more often in an unstable equilibrium than in a stable equilibrium, generating therefore asymmetry.
As a result, …rst-order auto-correlation, variance and asymmetry can indi-cate the vicinity of a tipping point when a dynamical system gets closer to a critical transition (Carpenter and Brock [CAR 06], Carpenter et al. [CAR 11], Dakos et al. [DAK 08], [DAK 12], Drake and Gri¤en [DRA 10]). As such, they can be considered as critical slowing down indicators, or equivalently, early warning signals, which predict a signi…cant future transition in the dynami-cal system’s state (van Nes et al. [SCH 12]). Hence, such indicators can help predict forthcoming downward shifts in …nancial markets, i.e. …nancial crises. For example, …nancial markets’ reversals can happen after a period of either increased volatility (Hens and Schenk-Hoppe [HEN 09]) or decreased volatility (Arvedlund [ARV 02]). Moreover, variance and …rst-order autocorrelations are linked in …nancial markets (Campbell et al. [CAM 93]).
indica-Figure 1: Fold catastrophe model and critical transition (F1 and F2 are
bifur-cation points, source: Sche¤er [SCH 09]).
tors can indeed anticipate critical transitions in …nancial markets such as the beginning of a major crisis.
3
Data and empirical application
In this section, we set the focus on the ability of critical slowing down indica-tors to predict the Global Financial Crisis. We consider stock market indices for the U.S. stock market and for ten European stock exchanges such as Bel-gium, France, Germany, Greece, Ireland, Italy, Netherlands, Portugal, Spain and U.K. Data span from October 10th, 2002 to July 2nd, 2007 (i.e. 10OCT02-02JUL07 period), which starts at the end of the Dot.com bubble and terminates at the beginning of the GFC (see 1). Speci…cally, we implement the analysis on computed log-indices and on cumulative returns of indices.
To extract the relevant information in view of our critical slowing down study, we follow the methodology of Dakos et al. (2008). In their paper, they propose a two-step methodology while analyzing univariate time series. First,
Table 1: Stock market indices Country Index label Belgium BEL20 France CAC40 Germany DAX Greece ASE Ireland ISEQ Italy FTSEMIB Netherland AEX Portugal PSI Spain IBEX U.K. UKX USA SP500
detrend daily log-indices and cumulative returns over the 10OCT02-02JUL07 period. Second, de…ne rolling windows with two di¤erent sizes, T =2 and T =4; where T = 1122. Over each rolling window, considering detrended time series, compute: a) First-order auto-correlations by ordinary least squares, b) The second moment, c) The third moment.
To detrend series, we employ a classical moving-average process. For a given series fytgTt=1, the corresponding detrended series fxtgTt=1is computed as:
xt= yt M At (1)
where M Atis a signal, computed as:
M At= Pt 1 i=t TG(i)yt i t 1P i=t T G(i) (2)
and G(:) is a gaussian kernel de…ned as: G(i) = p1
2 e
i2
2 2 (3)
In (3), is the bandwidth parameter, which is normally assumed to range from 10 to 20. According to …gure (2), a high value of the bandwidth parameter such as setting = 20 tends to slightly oversmooth the series, possibly introducing
an arti…cially high auto-correlation. Hence in the sequel of the study, the lowest bandwidth value = 10 will be applied.
Figure 2: SP500 (log), trends for tw o di¤ eren t bandwidths and corresp onding detrended series.
We compute the three critical slowing down indicators of detrended log-indices. We …rst report results for the log-indices and then for cumulative re-turns.
Log-indices
First-order auto-correlation First-order auto-correlation is considered as the major indicator of phase transitions. Figure (3) summarizes the results for the two rolling windows using log-indices. It provides heatmaps, which illustrate the magnitude of autocorrelations over time for each stock exchange under consideration. The darker the colour, the stronger the …rst-order auto-correlation is. Clearly, there is no empirical evidence of an increase in the …rst-order dependence of stock market indices, except maybe for Portugal, before the GFC. Heatmaps rather suggest that auto-correlations decrease for some countries, in particular France and the United-States, which invalidates the announcement of the GFC contrary to what happened later to these countries. Moreover, the result is robust, whatever the considered rolling window is.
Nevertheless, it is obvious that …rst-order correlations, based on T =2 trigger a false alarm in late 2005, early 2006, where at best it might provide an informa-tional content concerning the May 2006 market crash, for some countries such as Ireland, Belgium, Netherland, or UK. The May 2006 market crash being not a phase transition. Figure (4) clearly shows a sharp increase in the magnitude of the autocorrelations, followed by a plateau up to early May 2006. Nevertheless, on the end of the period sample, there is no information concerning the GFC.
Figure 3: First-order auto correlation of log-indices for tw o rolling windo ws: T = 2 (left), T = 4 (righ t).
Figure 4: Smo othed auto corr elat io n s of log-indices based on rolling windo ws (T = 2 ). V ertical reference 10MA Y06.
Variance The second critical slowing down indicator consists of the second moment of detrended time series. According to the theory, we expect here again an upward increase or decrease in variance before a tipping point occurs. Figure (5) plots corresponding heatmaps, and highlights the strong lack of evidence that variances increase or decrease before the GFC. Again, such feature seems to invalidate the use of a variance increase or decrease as a forthcoming crisis warning.
Figure 5: Second momen t of log-indices for tw o rolling windo ws: T = 2 (left), T = 4 (righ t).
Skewness The last indicator consists of skewness. Such indicator is not directly linked to critical slowing down but rather describes instability proper-ties in catastrophic bifurcations. Close to a tipping point, probability distrib-utions may become highly asymmetric, resulting in a non-null skewness. The alternance of regimes before a phase transition, i.e. ‡ickering, might also drive skweness away from zero. Skewness may increase or decrease, depending on the di¤erences between the two possible states. As shown by Figure (6), skewness converges towards zero for all countries. Results are obvious for the …rst rolling window of size T =2 whereas skewness becomes slightly negative, but close to zero, under the second rolling window of size T =4.
Figure 6: Third momen t of log-indices for tw o rolling windo ws: T = 2 (left), T = 4 (righ t).
Cumulative returns We now focus on the study of cumulative returns, and similarly check if we can extract predictive information about the GFC.
First-order auto-correlation Strictly in line with our previous …ndings, …rst-order autocorrelations still provide no empirical evidence about the forth-coming GFC, except maybe for Portugal.
Figure 7: First-order auto correlation of cum ulativ e returns for tw o rolling windo ws: T = 2 (left), T = 4 (righ t).
Variance Contrary to previous analysis, variance indicators do provide early warning signals whatever the rolling window under consideration. In par-ticular, cumulative returns’variances exhibit a sharp increase before the GFC for almost all stock market places. Indeed, heatmaps in …gure (8) show a clear increase in the magnitude of variances since corresponding colors get darker as we get closer to the GFC. As an extension, …gure (9) illustrates further this result while providing the variance trends of four stock exchanges such as Bel-gium, Greece, Ireland and Spain. Such …ndings are in line with observed market reversals, which follow a variance increase (Hens and Schenk-Hoppe [HEN 09]).
Figure 8: Second momen t of cum ulativ e returns for tw o rolling windo ws: T = 2 (left), T = 4 (righ t).
Figure 9: Smo othed v ariances of cum ulativ e re tur n s based on rolling windo ws (T = 2 ).
Skewness Analogously to previous variance analysis, skewness indicators exhibit a predictive signal about the forthcoming GFC (see …gure 10). Indeed, corresponding heatmaps and smoothed skewness estimates (for example, see …gure 11) exhibit a sudden decreasing trend and strong deviation from the zero threshold just before the beginning of the GFC for several countries. Our …ndings provide an early warning signal about a forthcoming crisis in line with the increased asymmetry.
Figure 10: Third momen t of cum ulativ e re turns for tw o rolling windo ws: T = 2 (left), T = 4 (righ t).
Figure 11: Smo othed third momen ts of cum ulativ e returns based on rolling windo ws (T = 2 ).
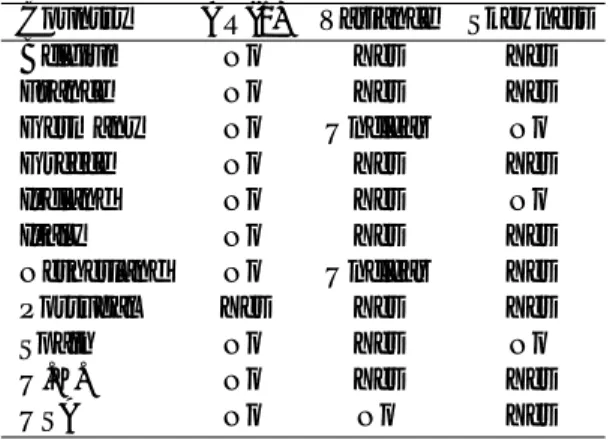
Table (2) summarizes our …ndings for both log-indices and cumulative re-turns.
Table 2: Usefulness of indicators to predict the GFC Country AR(1) Variance Skewness Belgium No Yes Yes France No Yes Yes Germany No Unclear No Greece No Yes Yes Ireland No Yes No
Italy No Yes Yes
Netherland No Unclear Yes Portugal Yes Yes Yes
Spain No Yes No
U.K. No Yes Yes
USA No No Yes
4
Conclusion
In this chapter, we have tested the ability of critical slowing down indicators to predict a major future crisis such as the GFC in the present case. Our results are mitigated and deeply depend on both the series used and the indicators. Using log-indices, as in Diks et al. [DIK 15], the framework clearly fails to predict the GFC, leading to a false alarm. Indeed, based on autocorrelations, we falsely predict a phase transition, whereas we only observe the May 2006 market crash, which is not a phase transition. This result holds for some countries, as shown by related heatmaps. Also, there is no clear informational content in the second and third moments. This result deeply questions the use of log-returns in this kind of analysis. Considering cumulative returns, …rst-order autocorrelations still convey no relevant information. Conversely, the analysis of trends in variance and skewness turns out to be very useful. Especially, trends in variance as well as shifts in skewness do precede the GFC.
the series used, the study performs much better on a re-scaled index than on a log-index. Second, concerning CSD indicators, whether we can have increases in variance and/or skewness without an upward trend in …rst-order autocorrelation is unclear. As a result, drawing sound conclusions about the validity of CSD for …nancial markets is by far not straightforward. Nevertheless, within or beyond the CSD, we found that increases in variance (Carpenter et al. [CAR 11]) and skewness (Guttal et al. [GUT 08]) are two useful early warning indicators. A combination of these two moments may provide a good early warning signal for …nancial markets, i.e. the probability of an upcoming …nancial crisis.
Acknowledgement 1 This work was achieved through the Laboratory of Ex-cellence on Financial Regulation (Labex ReFi) supported by PRES heSam under the reference ANR10LABX0095. It bene…ted from a French government support managed by the National Research Agency (ANR) within the project Investisse-ments d’Avenir Paris Nouveaux Mondes (investInvestisse-ments for the future Paris New Worlds) under the reference ANR11IDEX000602.
References
[ARV 02] Arvedlund, E. (2002). Calm before the storm? Low volatility often precedes market downturn. Barron’s.
[BER 06] Berglund, N., Gentz, B. (2006). Noise-Induced Phenomena in Slow-Fast Dynamical Systems - A Sample-Paths Approach, Springer. [CAM 93] Campbell, J. Y., Grossman, S. J., Wang, J. (1993). Trading
vol-ume and serial correlation in stock returns. Quarterly Journal of Eco-nomics 108, no. 4: 905-939.
[CAR 06] Carpenter, S. R., Brock, W. A. (2006). Rising variance: a leading indicator of ecological transition. Ecol. Lett. 9, 308–315.
[CAR 11] Carpenter, S. R., Cole, J. J., Pace, M. L., Batt, R., Brock, W. A., Cline, T., Coloso, J., Hodgson, J. R., Kitchell, J. F., Seekell, D. A., Smith, L., Weidel, B. (2011). Early warnings of regime shifts: A whole-ecosystem experiment. Science 332(6033):1079–108.
[DAI 12] Dai, L., Vorselen, D., Korolev, K. S., Gore, J. (2012). Generic indica-tors for loss of resilience before a tipping point leading to population collapse. Science 336(6085):1175–1177.
[DAK 08] Dakos, V., Sche¤er, M., van Nes, E. H., Brovkin, V., Petoukho, V., Held, H. (2008): Slowing down as an early warning signal for abrupt climate change. The National Academy of Sciences of the USA, 105, 14308–14312.
[DAK 12] Dakos, V., van Nes, E. H., D’Odorico, P., Sche¤er, M. (2012). Robust-ness of variance and autocorrelation as indicators of critical slowing down. Ecology 93:264–271.
[DIK 15] Diks, C., Hommes, C., Wang, J. (2015): Critical Slowing Down as Early Warning Signals for Financial Crises? Working Paper, Depart-ment of Quantitative Economics, University of Amsterdam.
[DRA 10] Drake, J. M., Gri¤en, B. D. (2010). Early warning signals of extinc-tion in deteriorating environments. Nature 467(7314):456–459. [GUT 08] Guttal, V., Jayaprakash, C. (2008). Changing Skewness: An early
warning signal of regime shifts in ecosystems. Ecol. Lett. 9, 311-318. [HEN 09] Hens, T., Schenk-Hoppe, K. R. (eds) (2009). Handbook of Financial
Markets: Dynamics and Evolution, North-Holland.
[IVE 95] Ives, A. R. (1995). Measuring resilience in stochastic systems. Ecol. Monogr. 65, 217–233.
[KUE 11] Kuehn, C. (2011): A mathematical framework for critical transitions: Bifurcations, fast-slow systems and stochastic dynamics. Physica D: Nonlinear Phenomena, 240, number 12, 1020–1035.
[LEN 12] Lenton, T. M., Livina, V. N., Dakos, V., van Nes, E. H., Sche¤er, M. (2012). Early warning of climate tipping points from critical slowing down: comparing methods to improve robustness. Phil. Trans. R. Soc. A, 370, 1185-1204.
[LIV 07] Livina, V. N., Lenton, T. M. (2007). A modi…ed method for detecting incipient bifurcations in a dynamical system. Geophys. Res. Lett. 34, L03712.
[NES 07] van Nes, E. H., Sche¤er, M. (2007). Slow recovery from perturbations as a generic indicator of a nearby catastrophic shift. Am. Nat. 169, 738–747.
[SCH 09] Sche¤er, M., Bascompte, J., Brock, W. A., Brovkin, V., Carpenter, S. R., Dakos, V., Held, H., van Nes, E. H., Rietkerk, M., Sugihara, G. (2009): Early-warning signals for critical transitions. Nature, 461, number 7260, 53–59.
[SCH 12] Sche¤er, M., Carpenter, S. R., Lenton, T. M., Bascompte, J., Brock, W., Dakos, V., van de Koppel, J., van de Leemput, I. A., Levin, S. A., van Nes, E. H., Pascual, M., Vandermeer, J. (2012). Anticipating critical transitions. Science, 338, number 6105, 344–348.
[SOR 09] Sornette, D. (2009): Why stock markets crash: critical events in complex …nancial systems. Princeton University Press.
[WIS 84] Wissel, C. (1984). A universal law of the characteristic return time near thresholds. Oecologia 65, 101–107.
![Figure 1: Fold catastrophe model and critical transition (F 1 and F 2 are bifur- bifur-cation points, source: Sche¤er [SCH 09]).](https://thumb-eu.123doks.com/thumbv2/123doknet/13168260.390398/8.918.230.852.228.415/figure-fold-catastrophe-critical-transition-cation-points-source.webp)