Automated method for the determination of a new matrix
metalloproteinase inhibitor in ovine plasma and serum by coupling of
restricted access material for on-line sample clean-up to liquid
chromatography
P. Chiapa,1, M. Pietteb,1, B. Evrardb, F. Frankennec, B. Christiaensa, G. Pielb, D. Cataldoc, J.-M. Foidartc, L. Delattreb, J. Crommena, Ph. Huberta
a Department of Analytical Pharmaceutical Chemistry, Institute of Pharmacy, University of Liège, CHU, B36, B-4000 Liège 1, Belgium b Department of Pharmaceutical Technology, Institute of Pharmacy, University of Liège, CHU, B36, B-4000 Liège 1, Belgium c Laboratory of Biology of Tumors and Development, University of Liège, CHU, B23, B-4000 Liège 1, Belgium
Abstract
A fully automated liquid chromatographic method was developed for the determination of Ro 28-2653, a new synthetic inhibitor of matrix metalloproteinase s (MMPs), in ovine serum and plasma. The method was based on the coupling of a pre-column packed with restricted access material, namely LiChrospher RP-8 ADS (alkyl diol silica), for sample clean-up to an analytical column containing octyl silica stationary phase. One hundred µl of biological sample, to which 2-propanol was automatically added, were injected onto the ADS pre-column, which was then washed with a washing liquid consisting of a mixture of 25 mM phosphate buffer (pH 7.0) and
acetonitrile (90:10; v/v) for 10 min. By rotation of the switching valve, the analyte was then eluted in the back-flush mode with the LC mobile phase composed of a mixture of acetonitrile and 25 mM phosphate buffer (pH 7.0) (57:43; v/v). The UV detection was performed at 395 nm. The main parameters likely to influence the sample preparation technique were investigated. The method was then validated over a concentration range from 17.5 to 1950 ng/ml, the first concentration level corresponding to the lower limit of quantitation. At this
concentration level, the mean bias and the R.S.D. value for intermediate precision were -2.4% and 4.2%, respectively.
Keywords: matrix metalloproteinase inhibitor ; Ro 28-2653 ; plasma ; serum ; sample preparation ;
column-switching ; restricted access material ; liquid chromatography
1. Introduction
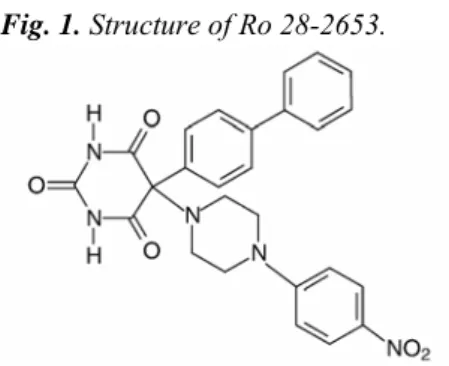
Ro 28-2653 (Fig. 1) is a new synthetic inhibitor of matrix metalloproteinases (MMPs) [1-5]. The ability of these enzymes to degrade various components of the extracellular matrix seems to play a major role in tumor invasion and metastasis [1]. Among the inhibitors of MMPs recently synthetized, Ro 28-2653 presents a high selectivity towards MMP2, MMP9 and membrane type 1-MMP [2,4]. This promising compound is able to reduce tumor growth in orthotopic prostatic cancer in rats. A significantly prolonged survival of the treated rats was also demonstrated [2]. In addition, other antitumor and antiangiogenic effects have been reported [4].
Ro 28-2653 is very poorly soluble in water. This low solubility estimated at about 0.56 µg/ml in water at 25 °C gives rise to difficulties in the pharmaceutical formulation of oral or injectable solutions [5]. Nevertheless, aqueous solutions of Ro 28-2653 have been formulated due to the good solubility of the complex obtained with a β-cyclodextrin derivative [5].
As far as we know, only one method has been described for the liquid chromatographic (LC) determination of Ro 28-2653 in rat plasma [2]. Prior to LC analysis, the sample preparation technique was liquid-liquid
extraction. When the number of biological samples to be analysed is particularly large, such as the bioavailability and pharmacokinetic studies, this manual procedure becomes tedious and time-consuming.
Therefore, in order to determine the bioavailability of Ro 28-2653 in sheep after oral and intravenous
administration of a solution and to compare the main pharmacokinetic data obtained with those observed after oral administration of a suspension, a fully automated method was developed for the LC determination of this compound in plasma and serum. Sample clean-up was performed by on-line coupling of a pre-column packed with restricted access material (RAM) to the analytical column by means of the column-switching technique. Among the restricted access sorbents, a family belonging to the group of internal surface reversed-phase (ISRP) supports, namely alkyl diol silica (ADS), packed in pre-columns has been applied successfully for the clean-up of plasma samples prior to LC analysis [6-14]. The topochemistry of the ADS sorbents has been represented
schematically elsewhere [6,8,13,15,16]. Due to the appropriate pore diameter (about 6 nm) of the silica particles, macromolecules, such as proteins, having a molecular mass larger than 15 kDa, are excluded in the void volume of the pre-column and are directly flushed into the waste. Moreover, some hydrophilic and electroneutral diol groups bound to the external surface of the particles prevent the adsorption and denaturation of proteins. On the other hand, low molecular mass compounds, such as the analytes of interest, have a free access to the internal surface of the support, on which butyryl (C4), capryloyl (C8) and stearoyl (C18) moieties are bonded, and can be retained mainly by hydrophobic interactions.
The aim of this paper was to develop a fully automated method using this kind of RAM for on-line sample clean-up prior to the LC determination of Ro 28-2653 in ovine plasma and serum. The main parameters likely to influence this sample preparation technique were studied. The determination of the retention capability of the ADS support, the optimisation of the composition of the washing liquid, the selection of the most suitable times for the rotation of the switching valve were considered. The influence of the addition of a protein releasing reagent to the biological sample on the chromatographic peak shape was also investigated. The method was then validated according to a novel approach based on accuracy profiles taking into account the total measurement error [17,18].
Fig. 1. Structure of Ro 28-2653.
2. Experimental
2.1. Chemical and reagents
Ro 28-2653 was kindly supplied by Roche Diagnostics (Penzberg, Germany) and was used without further purification. Phosphoric acid (85%; m/m), hydrochloric acid (37%; v/v), sodium hydroxide, 2-propranol were purchased from Merck (Darmstadt, Germany) and were of analytical grade. Random methyled β-cyclodextrin (Wacker, Burghausen, Germany) was also used during method development. Methanol and acetonitrile were LiChrosolv LC gradient grade solvents obtained from Merck. The water used in all experiments was purified by means of a Milli-Q system (Millipore Corporation, Bedford, MA, USA).
The pre-column containing LiChrospher RP-8 ADS (particle size: 25 µm) was supplied by Merck. The analytical and guard columns were pre-packed with LiChrospher 60 RP-Select B (particle size: 5 µm) from Merck.
2.2. Apparatus
An ASTED XL module from Gilson (Villiers-le-Bel, France), designed for the on-line coupling of dialysis and trace enrichment to LC, has been modified into a column switching system. It consisted of an auto-sampler equipped with one model 401C dilutor fitted with a 1 ml syringe and two Rheodyne model 7010 six-port switching valves (Berkeley, CA, USA), one of which being connected to a Manu-CART system containing the LiChroCART pre-column (25 mm × 4 mm, i.d.) packed with LiChrospher ADS material from Merck. The other switching valve was equipped with a 100 µl injection loop. A replaceable in-line filter (2 µm, sieve) contained in a holder from Alltech (Deerfield, IL, USA) was also installed between the injection loop and the pre-column. The LC system was composed of a model 305 pump coupled with a model 805 manometric module (Gilson) and of a model Dynamax UV-1 variable-wavelength UV-vis absorbance detector (Rainin, Woburn, MA, USA). A model 306 pump from Gilson was also used for sample preparation.
The separation was performed on a LiChroCART column (125 mm × 4 mm, i.d.) preceded by a LiChroCART guard column (4 mm × 4 mm, i.d.), both contained in a Manu-CART system from Merck. They were
thermostated at 35 ± 0.1 °C in a model 12B/VC Julabo waterbath (Seelbach, Germany).
The "715 HPLC system Controller" software loaded on an IBM compatible computer (CPU type Pentium) and the "722 Keypad" software were used for the control of the LC and the modified ASTED XL systems,
validation results.
2.3. Chromatographic conditions
The chromatographic separation was performed in the isocratic mode. The mobile phase consisted of a mixture of acetonitrile and 25 mM phosphate buffer (pH 7.0) (57:43; v/v). Prior to use, the mobile phase was degassed for 15 min in an ultrasonic bath. The chromatographic separation was performed at 35 °C using a constant flow-rate of 1.0 ml/min. The analyte was monitored photometrically at 395 nm.
2.4. Standard solutions
Stock solutions of Ro 28-2653 were prepared by dissolving 25 mg of this compound in 100 ml of methanol. These solutions were stored in a refrigerator at 4 °C when not in use and were stable for at least one week. 2.4.1. Solutions used for method development
A stock solution was first used to spike serum or plasma samples, which were then diluted with serum or plasma, respectively, in order to obtain a final concentration of about 2 µg/ml of Ro 28-2653. These biological samples were prepared daily. During method development, an aqueous solution of Ro 28-2653 at the same concentration was also prepared daily by diluting the stock solution with 25 mM random methyled β-cyclodextrin solution in 25 mM phosphate buffer of pH 7.0.
2.4.2. Solutions used for method validation
A stock solution of Ro 28-2653 was first diluted with methanol in order to obtain an intermediate solution at a concentration of 3.5 µg/ml. These two solutions were used to spike serum and plasma samples. These biological samples were then diluted with serum and plasma, respectively, in order to furnish calibration standards
containing Ro 28-2653 at four concentration levels (17 ng/ml, 30 ng/ml, 1000 ng/ml and 2000 ng/ml). Independent validation standards were also prepared at similar concentration levels from new stock and intermediate solutions. During method validation, the calibration and validation standards were treated in duplicate and triplicate, respectively. For two days, only plasma samples were prepared and analysed. Then, the preparation and the analysis of serum samples were performed for two other consecutive days.
2.5. On-line sample preparation
Plasma and serum samples stored under -80 °C were first thawed at ambient temperature and centrifuged at 3900 × g for 10 min. Between each step of the sample handling, the needle of the dilutor was rinsed with 2.0 ml of a mixture of 25 mM phosphate buffer (pH 7.0) and acetonitrile (70:30; v/v).
Unless stated otherwise, the automatic sequence was performed in the following way:
• Addition of a protein releasing reagent: a 20-µl volume of 2-propanol was added automatically to 400 µl of plasma or serum. The sample was then homogenised by air bubbling (air volume: 0.3 ml; flow-rate: 0.5 ml/min). • Loading and washing of sample matrix: 100 µl of sample were injected onto the ADS pre-column, which was then washed with a washing liquid consisting of a mixture of 25 mM phosphate buffer (pH 7.0) and acetonitrile (90:10; v/v) for 10 min at a flow-rate of 1.0 ml/min.
• Desorption and transfer: by rotation of the switching valve, the analyte was eluted in the back-flush mode with the LC mobile phase and transferred to the analytical column. Meanwhile, the injection port and the loop were rinsed successively with 1.0 ml of a mixture of water and acetonitrile (90:10; v/v), 3.0 ml of a solution consisting of the same mixture in the proportions (20:80; v/v) and 1.0 ml of the mixture used initially. • Reconditioning: 4 min later, the switching valve was returned to its initial position allowing the ADS pre-column to be re-equilibrated with the washing liquid for 5 min and the handling of the next sample started during the chromatographic analysis of the previous one.
3. Results and discussion
3.1. Selection of suitable LC conditions and an appropriate detection mode
Ro 28-2653 is a very poorly water-soluble compound. Nevertheless, an aqueous solution of Ro 28-2653 at a concentration of 2.0 µg/ml was prepared by diluting a methanolic solution with 25 mM random methyled β-cyclodextrin solution in 25 mM phosphate buffer of pH 7.0. Indeed, the β-cyclodextrins and their derivatives can be used to enhance the solubility of poorly water-soluble compounds due to the formation of soluble inclusion complexes.
The chromatographic separation of this hydrophobic compound was performed on octyl silica stationary phase with a mobile phase containing a relatively high percentage of acetonitrile. Under the experimental conditions,
the UV-vis spectrum of Ro 28-2653 exhibited a maximum absorption at two wavelengths, 262 nm and 395 nm, respectively. Since the selectivity of a bioanalytical method is usually improved when UV detection is performed at a high detection wavelength, the analyte of interest was photometrically monitored at 395 nm.
3.2. Development of the automated sample preparation method
The first step consisted of determining the retention capability of the RP-8 ADS support for Ro 28-2653 and selecting the most appropriate washing liquid. Several washing liquids composed of a mixture of 25 mM phosphate buffer (pH 3.0 or pH 7.0) and methanol or acetonitrile were tested by monitoring the UV absorbance after injection of an aqueous solution of Ro 28-2653 into the pre-column connected directly to the UV detector. The percentage of methanol or acetonitrile in the washing liquid was varied from 2.5% to 15% (v/v) and from 2.5% to 10% (v/v), respectively. Irrespective of the composition of the washing liquid, the analyte was not eluted after 100 min. In order to minimize the adsorption and enrichment of potentially interfering plasma or serum components and consequently to enhance method selectivity, it was decided to select a washing liquid containing a high proportion of organic solvent, namely 10% of acetonitrile or 15% of methanol. As recommended by the manufacturer [16], higher concentrations of these organic solvents were not tested to avoid the precipitation of the proteins. Since no significant difference was observed in the elution profiles of the biological matrix (ovine plasma or serum) monitored at 280 nm, wavelength corresponding to the maximum absorption of proteins, the selected washing liquid consisted of a mixture of phosphate buffer (pH 7.0) and acetonitrile (90:10; v/v), the two constituents of the LC mobile phase, and was delivered at a flow-rate of 1.0ml/min. Under these conditions, the elimination of the biological matrix was considered as complete after 7 min. The first time for the rotation of the switching valve was settled at 10 min.
Then, the period of time needed to elute Ro 28-2653 from the pre-column and to transfer it to the analytical column was determined by connecting directly the UV detector to the switching valve. The analyte was desorbed in the back-flush mode by the LC mobile phase delivered at a flow-rate of 1.0 ml/min in about 3 min. A period of time of 4 min was finally selected for this transfer step. Afterwards, the switching valve was returned to its initial position for 5 min, allowing the ADS pre-column to be re-equilibrated with the washing liquid. The clean-up of the next sample could be then started.
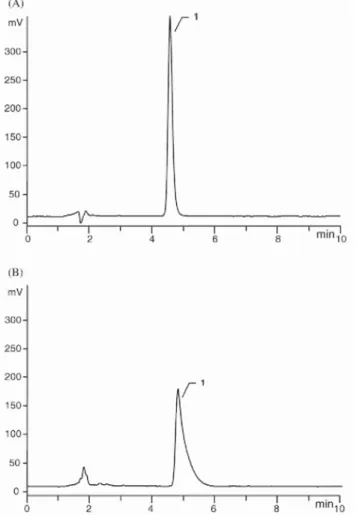
By on-line coupling of the RP-8 ADS pre-column to the analytical column for the determination of Ro 28-2653 in aqueous solution, a narrow peak corresponding to the analyte of interest was observed, as shown in Fig. 2A. Indeed, since the content of the organic modifier in the LC mobile phase was relatively high, the analyte was transferred in a narrow elution band at the top of the analytical column. On the other hand, as can be seen in Fig. 2B, a broad and asymmetrical peak corresponding to Ro 28-2653 was observed after analysis of a spiked plasma sample, probably due to a strong binding of the analyte to the proteins. The symmetry factor (AS) calculated according to the standard expression presented in the European Pharmacopoeia [19] was 4.4 instead of 1.4 when an aqueous solution of the analyte was treated. During the fractionation step, a broadening of the
chromatographic band would occur in the pre-column, which led to the phenomena observed in Fig. 2B.
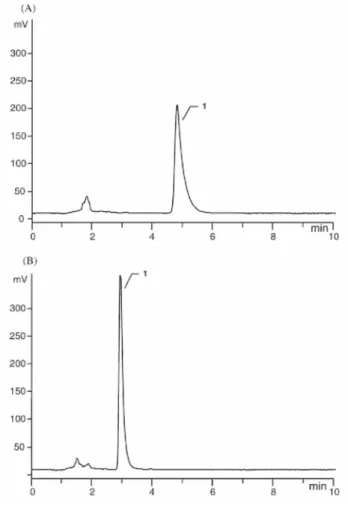
Moreover, since the size of the RAM particles is 25 µm, the peak efficiency is relatively low. Comparable results were obtained with spiked serum samples. In order to improve the peak shape, a low volume (30 µl/ml of sample) of a protein releasing agent, such as 3.5 M phosphoric acid or 1 M chlorhydric acid, was added to the biological sample prior to solid phase extraction. A slight cloudiness was observed, especially with plasma, but could be eliminated by centrifugation. Even if this change in the sample pH improved significantly the peak shape, a loss in efficiency and an irreversible increase of the back pressure were observed after analysis of only 20 acidified plasma samples. Therefore, other protein releasing reagents, such as methanol or 2-propanol, were tested. The final proportions of methanol or 2-propanol in the biological sample were 10% and 5%, respectively. Even if comparable results were observed with respect to the improvement of peak shape, 2-propanol was selected since it was demonstrated that it would bring about less protein denaturation than methanol [20]. Under these conditions, the lifetime of the pre-column was prolonged. More than 200 analyses could be performed. The comparison of the chromatograms illustrated in Figs. 2B and 3A shows the gain in peak symmetry (AS = 3.3). Similar chromatograms were obtained after handling of serum samples.
Since the solvent front was reduced and no interferences from endogenous components present in the biological fluids were observed around the peak of interest, the proportion of acetonitrile in the LC mobile phase was increased from 50% to 57% (v/v). Under these conditions, an important gain in method detectability was obtained and the peak symmetry was still improved, as illustrated in Fig. 3B (AS = 2.4).
Due to the limited solubility of the compound under the operating conditions, memory effects were observed. They gave rise to a poor repeatability of the results and a residual analyte peak on the blank chromatogram obtained after the analysis of a spiked sample. In order to eliminate these memory effects, the injection port and the loop were successively rinsed after sample handling with 1.0 ml of a mixture of water and acetonitrile (90:10; v/v), 3.0 ml of a solution consisting of the same mixture in the proportions (20:80; v/v) and 1.0 ml of the
mixture used initially. The use of the intermediate solution containing a high proportion of acetonitrile was important. Moreover, between each step of the sample preparation, the needle of the autosampler was rinsed with a mixture of 25 mM phosphate buffer (pH 7.0) and acetonitrile (70:30; v/v).
Under the final operating conditions, the extraction efficiency was about 95% over a concentration range from 50 ng/ml to 1950 ng/ml. Moreover, the analyte recoveries from plasma and serum were comparable.
Fig. 2. Typical chromatograms obtained after on-line coupling of a pre-column packed with RP-8 ADS to the analytical column. (A) Chromatogram of an aqueous solution of Ro 28-2653. (B) Chromatogram of a plasma sample spiked with Ro 28-2653. LC mobile phase: 25 mM phosphate buffer of pH 7.0/acetonitrile (50:50; v/v) (concentration of Ro 28-2653: 2 µg/ml). Other operating conditions as given in Section 2. Peak 1: Ro 28-2653.
Fig. 3. Influence of the addition of 2-propanol to the biological sample and the increase of the acetonitrile proportion in the LC mobile phase on the peak shape. (A) LC mobile phase: 25 mM phosphate buffer of pH 7.0/acetonitrile (50:50; v/v). (B) LC mobile phase: 25 mM phosphate buffer of pH 7.0/acetonitrile (43:57; v/v). Typical chromatograms of a plasma sample spiked with Ro 28-2653 (concentration: 2 µg/ml) to which 2-propanol was added prior to sample preparation. Other operating conditions given in Section 2. Peak l:Ro 28-2653.
3.3. Method validation
A novel approach using accuracy profiles based on tolerance intervals for the total measurement error (including both bias and standard deviation for intermediate precision) was applied to demonstrate the method capability instead of defining acceptance criteria only on estimates of observed bias and variance [17,18]. This strategy has been elaborated by a Société Française des Sciences et Techniques Pharmaceutiques (SFSTP) commission [18]. The concept of accuracy profile was also used to select the most appropriate regression model for calibration, to determine the lower limit of quantitation and the range over which the method can be considered as valid. 3.3.1. Stability of Ro 28-2653 in biological samples
An ANOVA test was applied to assess whether there was any influence of the storing time at room temperature and at 4 °C on the stability of Ro 28-2653 in serum. The F values calculated after analysis of two samples stored at room temperature were 3.94 and 6.66 for concentration levels of 50 ng/ml and 1950 ng/ml, respectively. As for samples stored at 4 °C, the F values were 2.79 at 50 ng/ml and 0.14 at 1950 ng/ml. Since these values were lower than the critical value shown in a F table with (k - 1) and (n - k) degrees of freedom at the 5% significance level (F(0.05;2,3) = 9.55), k and n representing the number of series (T0, T18 and T24) and the number of samples, respectively, Ro 28-2653 was stable for at least 24 h in serum samples stored under these conditions. Similar results in terms of stability were obtained for spiked plasma samples.
The analyte stability was also determined after three freeze and thaw cycles. No significant difference in peak area was observed. Indeed, by applying the Student's test, the t-values calculated after analysis of samples at concentration levels of 50 ng/ml (t = 0.99) and 1950 ng/ml (t = 0.61) were lower than the critical value shown in a t table with (n1 + n2 - 2) degrees of freedom at the 5% significance level (t(0.05;4) = 2.78), n1 and n2 representing the number of replicates.
3.3.2. Method selectivity towards endogenous components of plasma and serum
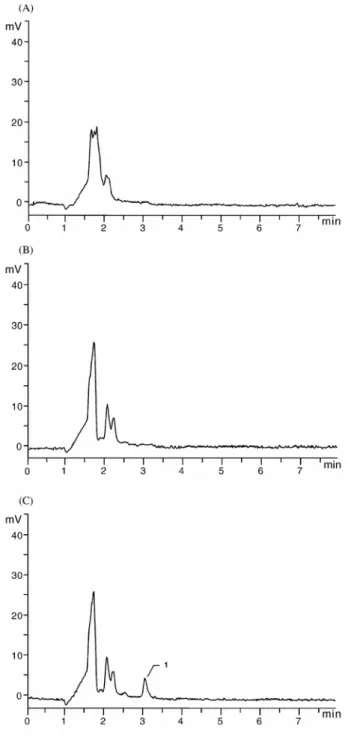
The absence of interfering endogenous components of plasma and serum at the retention time of Ro 28-2653 was demonstrated in Fig. 4, which shows typical chromatograms obtained after analysis of a serum sample spiked with Ro 28-2653 at a concentration of 30 ng/ml and blank serum and plasma samples obtained from six different sources of the same matrix.
Fig. 4. Determination of method selectivity. (A) Chromatogram of a blank plasma sample. (B) Chromatogram of a blank serum sample. (C) Chromatogram of a serum sample spiked with Ro 28-2653 (concentration: 30 ng/ml). Operating conditions as given in Section 2. Peak 1: Ro 28-2653.
3.3.3. Analysis of the response function
A calibration curve was constructed from 17 ng/ml to 2000 ng/ml by selecting four concentration levels. Two calibration standards were analysed at each concentration level for four days. The peak area corresponding to Ro 28-2653 was considered as analytical response. Independent validation standards at similar concentration levels were also treated in triplicate during the same period. For the two first days, only plasma samples were
analysed. As for serum samples, they were treated for the two last days.
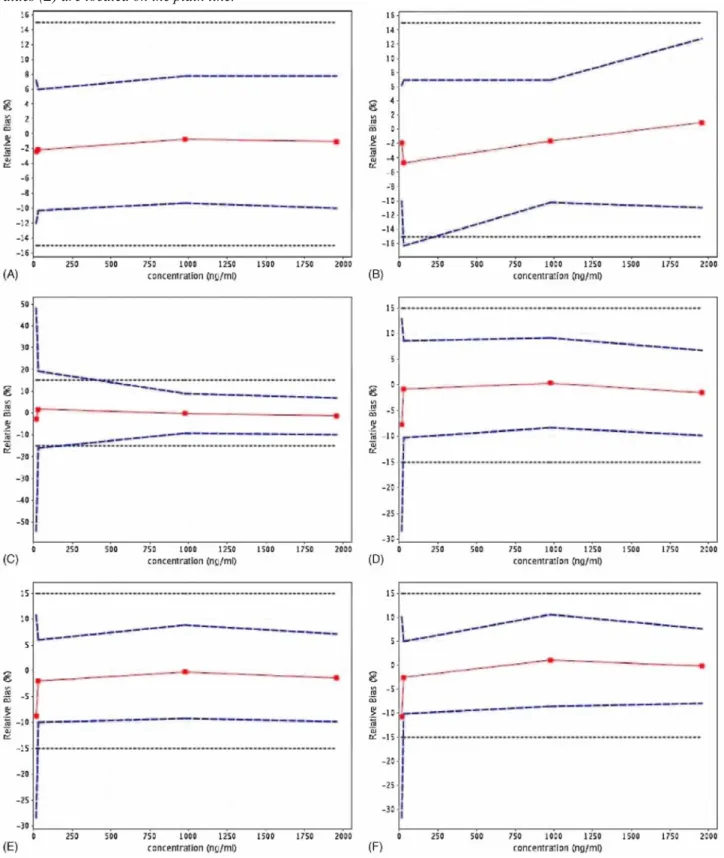
Then, several regression models were fitted. From each regression line obtained, the concentrations of the validation standards were back-calculated in order to determine, for each concentration level, the mean relative bias as well as the upper and lower β-expectation tolerance limits at 95% level by introducing the estimation of the standard deviation for intermediate precision [18]. From these data, different accuracy profiles were plotted, as illustrated in Fig. 5. The acceptance limits were set at 15% according to the regulatory requirements. Only the linear regression after square root transformation allowed demonstrating the capability of the method over the concentration range considered, since the tolerance intervals were totally included inside the acceptance limits. The regression equations obtained by applying this model are presented in Table 1. With the other models, either a greater variance or a negative bias close to 10% was obtained.
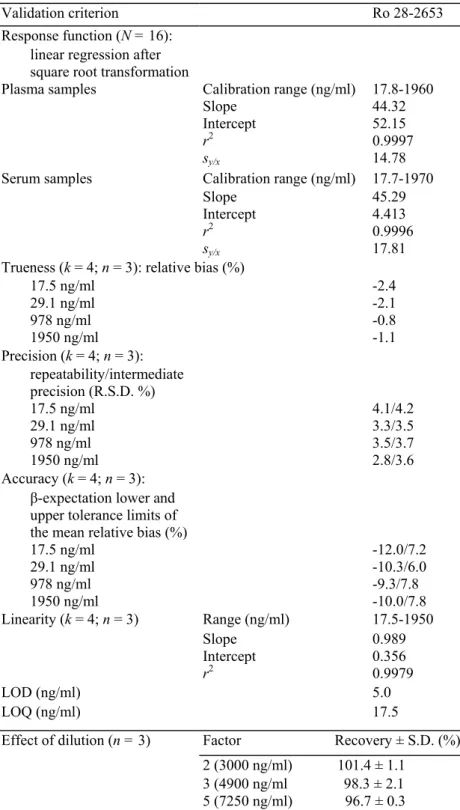
Table 1 Method validation
Validation criterion Ro 28-2653
Response function (N = 16): linear regression after square root transformation
Plasma samples Calibration range (ng/ml) 17.8-1960
Slope 44.32
Intercept 52.15
r2 0.9997
sy/x 14.78
Serum samples Calibration range (ng/ml) 17.7-1970
Slope 45.29
Intercept 4.413
r2 0.9996
sy/x 17.81
Trueness (k = 4; n = 3): relative bias (%)
17.5 ng/ml -2.4 29.1 ng/ml -2.1 978 ng/ml -0.8 1950 ng/ml -1.1 Precision (k = 4; n = 3): repeatability/intermediate precision (R.S.D. %) 17.5 ng/ml 4.1/4.2 29.1 ng/ml 3.3/3.5 978 ng/ml 3.5/3.7 1950 ng/ml 2.8/3.6 Accuracy (k = 4; n = 3): β-expectation lower and upper tolerance limits of the mean relative bias (%)
17.5 ng/ml -12.0/7.2 29.1 ng/ml -10.3/6.0 978 ng/ml -9.3/7.8 1950 ng/ml -10.0/7.8 Linearity (k = 4; n = 3) Range (ng/ml) 17.5-1950 Slope 0.989 Intercept 0.356 r2 0.9979 LOD (ng/ml) 5.0 LOQ (ng/ml) 17.5
Effect of dilution (n = 3) Factor Recovery ± S.D. (%) 2 (3000 ng/ml) 101.4 ± 1.1
3 (4900 ng/ml 98.3 ± 2.1 5 (7250 ng/ml) 96.7 ± 0.3
Fig. 5. Accuracy profiles obtained using different calibration models. (A) Linear regression model after square root transformation. (B) Linear regression model after logarithm transformation. (C) Linear regression model. (D) Quadratic regression model. (E) Weighted linear regression model with a weight equal to 1/x. (F) Weighted linear regression model with a weight equal to 1/x2. The dotted lines represent the acceptance limits (15%), the dashed lines correspond to the accuracy profile, i.e. to the β-expectation tolerance limits, and the relative bias values (■) are located on the plain line.
3.3.4. Other validation criteria
Trueness expressed in terms of relative bias (%) was assessed from the validation standards at four concentration levels, as can be seen in Table 1. According to the regulatory requirements [21], trueness was quite acceptable since the bias did not exceed the value of 15%, irrespective of the concentration level.
The precision of the bioanalytical method was then determined by computing the relative standard deviations (R.S.D.) for repeatability and time-different intermediate precision at each concentration level of the validation standards. The R.S.D. values presented in Table 1 were relatively low, about 4% for the lowest concentration level, and illustrated the good precision of the developed method.
Accuracy takes into account the total error, i.e. the sum of systematic and random errors, related to the test result [18]. As shown in Table 1, the upper and lower β-expectation tolerance limits of the mean relative bias (%) did not exceed the acceptance limits settled at 15% for each concentration level. Consequently, the method can be considered as accurate over the concentration range investigated and the first concentration level (17.5 ng/ml) corresponded to the lower limit of quantitation (LLOQ). As for the limit of detection (LOD), it was determined as the analyte concentration giving rise to a signal-to-noise ratio of 3. The LOD was evaluated at 5.0 ng/ml. Moreover, in order to demonstrate method linearity, a regression line was fitted on the back-calculated concentrations of the validation standards as a function of the introduced concentrations by applying the linear regression model based on the least squares method [18,21]. The following equation was obtained:
y = 0.989x + 0.356. The coefficient of determination (r2) was 0.9979. 3.3.5. Dilution effect
The influence of the dilution procedure to be used in routine analysis, when the sample concentration was higher than the upper limit of the range, was checked. In the present study, three dilution factors (2, 3 and 5) were tested and no significant effect was observed (cf. Table 1).
3.4. Applicability of the developed method
In order to illustrate the applicability of the present method, an example of the time course of Ro 28-2653 concentration in serum from a healthy sheep after oral administration of a suspension of 15 mg/kg is given in Fig. 6. This figure also demonstrates that the method is sensitive enough for the quantitative determination of Ro 28-2653 in such biological samples.
Fig. 6. Typical concentration-time profile of Ro 28-2653 after oral administration of a suspension dosed at 15 mg/kg to one healthy sheep.
3.5. Conclusions
An automated method was developed for the LC determination of Ro 28-2653, a new synthetic inhibitor of matrix metalloproteinases, in ovine serum and plasma. The method was based on the use of a pre-column packed with restricted access material for on-line sample preparation coupled to an analytical column by means of a column-switching system.
The main parameters likely to influence this sample cleanup technique were investigated, such as the
composition of the washing liquid, the times for the rotation of the switching valve after the washing and transfer steps, etc. An effect on the chromatographic peak shape of the addition of 2-propanol to the biological samples prior to the extraction process was also demonstrated. Due to the very poor water solubility of Ro 28-2653,
important memory effects were observed. However, this carry-over could be eliminated by selecting appropriate rinsing liquids for the injection port, the loop and the needle.
Finally, the method was fully validated over a concentration range from 17.5 ng/ml to 1950 ng/ml. The application of a new validation approach using accuracy profiles based on tolerance intervals for the total measurement error (including both bias and standard deviation for intermediate precision) allowed demonstrating the method capability, but also selecting the most appropriate regression model for calibration and determining the lower limit of quantitation and the range. The method is reliable for its intended use and the first applicability testing shows that it could be used for the quantitative determination of Ro 28-2653 in ovine plasma or serum within bioavailability studies of pharmaceutical formulations.
Acknowledgement
This work was supported by the Ministry of the Walloon Region (Nanophar project no. 115013). G. Piel and D. Cataldo are post-doctoral researchers from the Fonds National de la Recherche Scientifique (F.N.R.S.).
References
[1] J.R. Opalka, F.N. Gellerich, L. Kling, B. Müller-Beckmann, S. Zierz, Biochem. Pharmacol. 63 (2002) 725.
[2] M. Lein, K. Jung, B. Ortel, C. Stephan, W. Rothaug, R. Juchem, M. Johannsen, S. Deger, D. Schnorr, S. Loening, H.-W. Krell, Oncogene 21 (2002) 2089.
[3] D. Mangoldt, B. Sinn, M. Lein, H.-W. Krell, D. Schnorr, S.A. Loening, K. Jung, Apoptosis 7 (2002) 217.
[4] A. Noël, E. Maquoi, L. Devy, F. Olivier, G. Roland, G. Tiefenthaler, H.-W. Krell, J.M. Foidart, Clin. Cancer Res. 6 (2000) 4524. [5] P. Bertholet, G. Gueders, G. Dives, B. Perly, S. Henry de Hassonville, V. Barillaro, G. Piel, L. Delattre, D. Cataldo, B. Evrard, in preparation.
[6] K.-S. Boos, A. Rudolphi, S. Vielhauer, A. Walfort, D. Lubda, F. Eisenbeiβ, Fresenius' J. Anal. Chem. 352 (1995) 684. [7] Z. Yu, D. Westerlund, J. Chromatogr. A 725 (1996) 149.
[8] A. Ceccato, B. Boulanger, P. Chiap, Ph. Hubert, J. Crommen, J. Chromatogr. A 819 (1998) 143. [9] K.-S. Boos, A. Rudolphi, LC-GC Int. 11 (1998) 224.
[10] D. Öhman, B. Carlsson, B. Norlander, J. Chromatogr. B 753 (2001) 365. [11] C. Schäfer, D. Lubda, J. Chromatogr. A 909 (2001) 73.
[12] C. Mišl'anová, M. Hutta, J. Chromatogr. B 765 (2001) 167.
[13] P. Chiap, A. Ceccato, R. Gora, Ph. Hubert, J. Géczy, J. Crommen, J. Pharm. Biomed. Anal. 27 (2002) 447. [14] S. Souverain, S. Rudaz, J.-L. Veuthey, J. Chromatogr. B 801 (2004) 141.
[15] K.-S. Boos, C.-H. Grimm, Trends Anal. Chem. 18 (1999) 175. [16] LiChrospher® ADS Application Guide, Merck, 2000.
[17] Ph. Hubert, P. Chiap, J. Crommen, B. Boulanger, E. Chapuzet, N. Mercier, S. Bervoas-Martin, P. Chevalier, D. Grandjean, P. Lagorce, M. Lallier, M.C. Laparra, M. Laurentie, J.C. Nivet, Anal. Chim. Acta 391 (1999) 135.
[18] Ph. Hubert, J.J. Nguyen-Huu, B. Boulanger, E. Chapuzet, P. Chiap, N. Cohen, P.A. Compagnon, W. Dewé, M. Feinberg, M. Lallier, M. Laurentie, N. Mercier, J.C. Nivet, G. Muzard, L. Valat, STP Pharma Prat. 13 (2003) 101.
[19] The European Pharmacopoeia, 4th ed., Part 2.2.46, Council of Europe, Strasbourg, France, 2002.
[20] T. Nakagawa, A. Shibukawa, N. Shimono, T. Kawashima, H. Tanaka, J. Haginaka, J. Chromatogr. 420 (1987) 297.
[21] U.S. Department of Health and Human Services, Food and Drug Administration, Center for Drug Evaluation and Research (CDER), Guidance for Industry, Bioanalytical Method Validation, 2001.