HAL Id: hal-01313029
https://hal.sorbonne-universite.fr/hal-01313029
Submitted on 18 May 2016
HAL is a multi-disciplinary open access
archive for the deposit and dissemination of sci-entific research documents, whether they are pub-lished or not. The documents may come from
L’archive ouverte pluridisciplinaire HAL, est destinée au dépôt et à la diffusion de documents scientifiques de niveau recherche, publiés ou non, émanant des établissements d’enseignement et de
On the propagation of open and covered pit in 316L
stainless steel.
Stéphane Heurtault, Raphaël Robin, Fabien Rouillard, Vincent Vivier
To cite this version:
Stéphane Heurtault, Raphaël Robin, Fabien Rouillard, Vincent Vivier. On the propagation of open and covered pit in 316L stainless steel.. Electrochimica Acta, Elsevier, 2016, 203, pp.316-325. �10.1016/j.electacta.2016.01.084�. �hal-01313029�
ON THE PROPAGATION OF OPEN AND COVERED PIT IN 316L
STAINLESS STEEL
Stéphane Heurtault
a,b, Raphaël Robin
a, Fabien Rouillard
a, Vincent Vivier
b,*
a CEA, DEN, DPC, SCCME, Laboratoire d’Etude de la Corrosion Non Aqueuse, F-91191 Gif-sur-Yvette,
France
b Sorbonne Universités, UPMC Univ Paris 06, CNRS, Laboratoire Interfaces et Systèmes Electrochimiques, 4
place Jussieu, F-75005, Paris, France
* Fax: +33 1 44274074; Tel: +33 1 44274158; E-mail: vincent.vivier@upmc.fr (V. Vivier)
Abstract
Pitting corrosion on stainless steel has been widely studied during the last decades, but since it is a stochastic process, it remains difficult to analyze experimentally such a phenomenon. In this work, reproducible single pits were performed on 316L steel by using an experimental setup based on the use of a glass microcapillary to locally supply chloride ions on the steel surface in order to characterize the pit propagation. This original approach allowed obtaining new results about pit propagation. Indeed, it was possible to control the presence of a metallic cap recovering the pit by adjusting the experimental parameters (potential – chloride to sulfate ratio – temperature). The presence of this cover was shown to be an important issue concerning the propagation mechanism. It was also possible to study the evolution of both the pit depth and the pit diameter as a function of various parameters. Then, based on the simulation of the current densities at the pit bottom and at the pit aperture, a special attention has been paid for the investigation of the local propagation mechanism.
Keywords:
1. Introduction
In 1790, the concept of metal passivity was introduced with the pioneering work of Keir [1]. Later, in the 19th century, Schoenbein and Faraday have further examined metal passivity by performing
experiments on pure iron metal [2]. No corrosion was observed when an iron sample was immersed in a 70 % nitric acid solution even if this sample was then placed in a more diluted solution (namely a 50 % nitric acid solution). Such a result was surprising because the directly immersion of the iron sample in a 50% nitric acid solution resulted in corrosion. Schoenbein and Faraday thus concluded that an oxide film was formed during the immersion in nitric acid 70 % covering and protecting the iron surface. This has been verified by scratching the iron surface after a first immersion of the iron sheet in a 70 % nitric acid solution. Then the metal was immersed in a 50 % nitric acid solution, giving rise to corrosion on the location of the scratch. Later on, after this passive film discovery, passivity breakdown phenomena like pitting corrosion were extensively analyzed for a lot of industrial applications like the nuclear waste disposition [3] or the resistance of offshore structures [4].
One of the main problems for pitting corrosion investigations is its stochastic initiation [5], which despite numerous works is not totally understood and for which several initiation mechanisms [6] and different possible initiation sites [7-11] have been proposed. This is the reason why the study of pitting corrosion by simply adding an aggressive anion, such as chloride ion, to the electrolytic solution is an intricate problem: it leads for full-immersion conditions to the simultaneous formation of several pits at different stages of development on the material surface, thus making any pitting analysis of this stochastic phenomena very difficult [12;13]. In order to determine the mechanisms that governs pitting corrosion, it is thus of interest to develop experimental techniques allowing the initiation of a single pit, but also its propagation for long time.
One of the seminal and most famous single-pit setup reported in literature is the lead-in-pencil experiment, which consisted in a small wire embedded in an insulator. This device mimicked the pit
solution. The generated 1D single pit allows the evaluation of its depth evolution, but this setup was criticized in the literature [17] because of the geometrical difference between an artificial and a real pit, and also because the walls inside the pit were not conductive. An improvement to the lead-in-pencil technique was the use of a vertical foil instead of the wire, allowing a 2D single pit to be generated. It was also possible to study the evolution of the pit radius in presence of a cover beneath the pit [18;19]. However, a lateral limitation for the pit propagation was still remaining due to the low thickness of the foil. The pit cover has been known for long time as being an important issue in pitting corrosion and it has been described as a stabilizing factor for pit growth [16;18;20;21]. Indeed, pit cover acts as a resistive barrier [22] or diffusion barrier [23] against both the current flow and diffusion that helps to maintain a concentrated aggressive environment inside the pit. In this aggressive environment, a key point is the presence of sulfate ions that competes with chloride ions [24-26]. The use of capillary microcells permitted to generate single pits in 3D [27;28]. This original approach consisted on using a glass microcapillary on the top of a stainless steel in atmospheric conditions. It allowed the determination of the influence of MnS inclusions on the pit initiation [27] and also to make the parallel between 2D and 3D single pits [28]. However, the small size of the immersed surface (disk of diameter 100 µm) is a significant restriction for the pit propagation time by imposing a maximum pit radius, and thus allowing to work on the early stage of pit propagation, only. With such a setup, it was possible to obtain reproducible single pits with propagation times larger than 10 hours, giving rise to new opportunities as the study the evolution of both the pit depth and the radius, as well as the presence of a metallic cap recovering the pit [29]. This represents a significant improvement to the former techniques used for studying pitting corrosion [17]. Since single pit can be grown at will in the 3D (i.e. like real ones) with conductive walls for long propagation times.
The aim of this work is to study the long-term pit propagation on 316L stainless steel. First, it will be shown that depending on the experimental parameters, a metallic cover can be present or not on
top of the pit. Then a special attention will be paid to bring new insight to the propagation mechanisms at the pit bottom and at the pit mouth for both open and covered pits.
2. Experimental
2.1 Instrumentation and electrode preparation
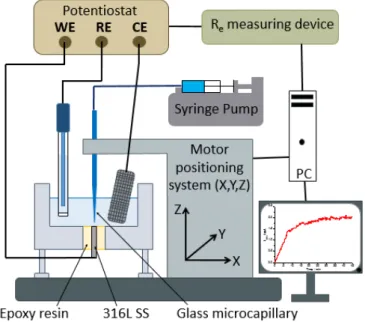
The experimental setup used in this work has already been described elsewhere in more detail [25;29], but for facility, it is sketched in Fig. 1. Briefly, it consisted of an analogue potentiostat (Jaissle Elektronik BI-Potentiostat PG100), which allowed current in the sub-nanoampere range to be measured through a low-noise-current-to-voltage converter with an adjustable gain. A three-axis positioning system (VP-25XA, Newport) driven by a 100 nm spatial-resolution motion encoder (ESP300, Newport) was used for a precise positioning of the microcapillary. The entire setup was controlled by a software developed under Labview® environment. All the experiments presented in
this work were performed in a 0.5 M H2SO4 solution, in which a local amount of chloride ions was
locally injected using a glass-microcapillary obtained from a glass tube heated in the center of a resistive coil. The top-end of the microcapillary was connected to a 300 µL Terumo® syringe filled
with a NaCl solution from 1.2 M to 3 M in a 0.5 M H2SO4 solution. A KD Scientific® syringe infusion
pump was used to gradually release the solution at a controlled flux rate. All the experiments presented in this article were performed with the same glass microcapillary, the size of which was 100 µm as inner diameter and 1000 µm as outer diameter, and a constant flux of 5.4 µL/h for the chloride containing solution. This chloride injection with the microcapillary had a little or no effect on the total chloride concentration in the bulk solution. Indeed, for a 3 M NaCl solution (corresponding to the higher NaCl concentration used in this paper) injected in a 40 mL sulfate solution with the microcapillary, the chloride concentration was 0.4 mM after 1 hour of injection and it reached 4 mM after 10 hours, that is for the longest pit propagation studied. By comparison, it was shown that the
minimum concentration of chloride necessary for initiating pitting was 100 mM for a Fe-20Cr steel [30], which is by far, much larger than the present chloride bulk concentration. Fig. 1: Electrochemical device developed for generating a single pit and studying its propagation. The precise positioning of the microcapillary was achieved by measuring the electrolyte resistance between the substrate (i.e. the stainless steel electrode) and the reference electrode. This technique was shown to be very sensitive to monitor the position of an insulating material in the close vicinity of a polarized electrode [31-32]. The glass microcapillary size and positioning are the key parameters of this setup for a proper initiation and propagation of a single pit. In a preliminary set of experiments, it was shown that the microcapillary-to-sample distance could not exceed 20 µm in order to avoid the simultaneous initiation of several pits.
Electrochemical measurements were performed in a three-electrode cell with a platinum grid as counter electrode, a mercury saturated-sulfate electrode (MSE) as reference electrode (E = 0.650 V/NHE), and a 316L stainless steel disk as working electrode. The nominal composition of the 316L stainless steel (in wt%) was obtained from inductively coupled plasma atomic emission spectroscopy (ICP-AES), excepted the C element which was obtained from glow discharge optical emission
spectrometry (GD – OES): 65.9% Fe, 18.5% Cr, 10.6% Ni, 2.4% Mo, 1.7% Mn, 0.9% Si, 0,04% S and 0,02% C.
The same surface preparation procedure was always used to have reproducible passive film in terms of nature, thickness, and crystallization. First, the 316L stainless steel surface was mechanically ground with 1200, 2400, and 4000 SiC papers, and then cleaned with a water and ethanol mixture (1:1) in an ultrasonic bath for 10 min. After the polishing, the electrode was introduced in the electrochemical cell, which was also used for performing pitting corrosion experiments, and was cathodically treated in 0.5 M H2SO4 at –0.9 V/MSE for 1 minute to reduce the native oxide film. In the
next step, the formation of the passive film was achieved in the same electrolytic solution by performing a single potential sweep between –0.9 V/MSE and the working potential at a low scan rate (1 mV/s). Then, before releasing the chlorides through the glass microcapillary, the working potential was hold during 30 min to ensure that the passive film is thick enough. In this article, the working potential of the 316L steel was varied in its passive domain that is between –0.6 V/MSE and 0.5 V/MSE.
2.2 Physical characterization
The single pits formed were cylindrical or disc shaped depending on the experimental parameters with geometrical shapes already observed and described in the literature (vide infra) [18, 28]. The size of the pit was characterized by its depth and its radius, which were measured at the pit aperture.
Ex situ characterization of pits were performed with a Leica Stereoscan 440 scanning electron
microscope (SEM). The pit radius was obtained from SEM observations of the pit top view assuming a circular shape by averaging the radius of the real elliptic shape in 2 perpendicular directions. The pit depth measurement was performed using the differential focusing technique with an optical microscope equipped with a micrometric screw. Interestingly, in a previous work [25], the dosing of dissolved materials were in perfect agreement with the volume determined by microscopic
be calculated at both the pit bottom and the pit wall paving the way to local kinetics investigation inside the pit [29]. For numerical applications of the Faraday’s law, the following parameters values were taken: 8 g.cm-3 for the 316L steel density ρ [33], 2.2 for the mean oxidation number n involved
in the corrosion reaction [33;34], F = 96485 C.mol-1 for the Faraday constant, and M = 56.1 g.mol-1 for
the 316L steel molar mass.
3. Results and discussion
3.1 Generation of covered and open single pit
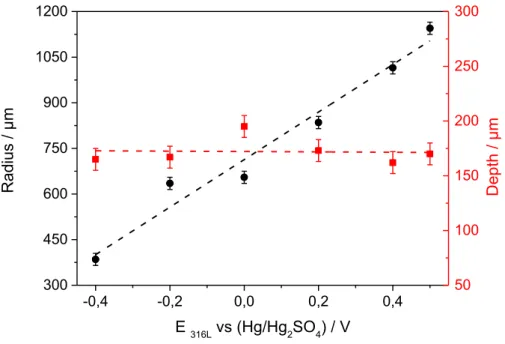
In a first step, the evolution of the pit morphology obtained on a 316L stainless steel as a function of different experimental conditions (applied potential, temperature, and composition of the injected solution) was investigated. Fig. 2 shows the evolution of both the pit depth and the pit radius after 1 hour of propagation as function of the applied potential of the electrode in the passive domain from – 0.4 V/MSE to 0.5 V/MSE. These experiments were performed at 20°C in a 0.5 M H2SO4 solution, while injecting a 3 MNaCl + 0.5 M H2SO4 solution with the glass microcapillary at a constant flow rate of 5.4 µL/h. It should
be noticed that each couple of points (depth and radius) corresponds to one experiment. At 0 V/MSE, 7 identical experiments were carried out to know the level of uncertainty in the measurements: average standard deviations for the measured radius and depth were both 10 µm. The pitting current for these 7 experiments had almost not varied (mean deviation of 0.1 mA for a mean pitting current of 2.2 mA), suggesting that the single pit initiation and propagation is reproducible with this procedure. The radius at the pit mouth increases whereas the pit depth remains rather constant. These results are in good agreement with bottle-like pits (high depth to radius ratio) observed for the 304 stainless steel at low over-potential, and with disc-shaped pits (low depth to radius ratio) at nobler potential using a lead-in-pencil setup in NaCl solution [16;24;28;35]. Fig. 3 presents the influence of the temperature of the electrolyte during the propagation phase on
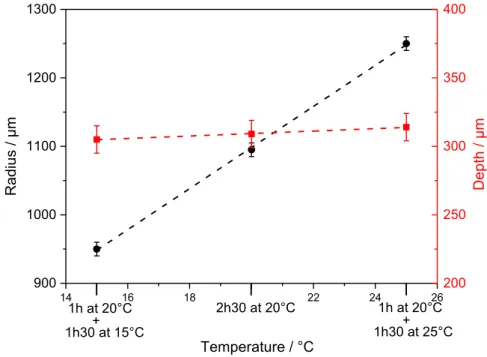
the geometric parameters after 2h30 of propagation at 0 V/MSE while injecting 3 M NaCl with the microcapillary in a 0.5 M sulfate solution. The first hour of propagation was performed at 20°C, then for the remaining 1h30 the temperature was lowered to 15°C in the first experiment, kept constant at 20°C in the second one, and increased to 25° for the last experiment. With such change of temperature during the propagation, the pit depth is unchanged conversely to the radius measured at the pit aperture, which increased while increasing temperature. The temperature affects the geometric parameters in the same way as the potential. Similar effects on pit morphology beneath the glass microcapillary were also observed using our setup by varying the chloride concentration in the syringe [29]. In addition, it was shown that the type of anion (sulfate or perchlorate ion) of the acid used as supporting electrolyte also influenced the pit morphology [25], but in this work, we only focused on sulfuric acid solution. Fig. 2: Geometric parameters measured for different applied potentials after 1 hour propagation at 20°C in 0.5 M H2SO4 (injected solution: 3M NaCl). Black circles: pit radius; red squares: pit depth. -0,4 -0,2 0,0 0,2 0,4 300 450 600 750 900 1050 1200 Rad ius / µm E 316L vs (Hg/Hg2SO4) / V 50 100 150 200 250 300 Depth / µm
Fig. 3: Geometric parameters measured for different applied temperatures after 2h30 of propagation at 0
vs. (Hg/Hg
2SO
4)/
V in 0.5 M H2SO4 (injected solution: 3M NaCl). Black circles: pit radius; redsquares: pit depth.
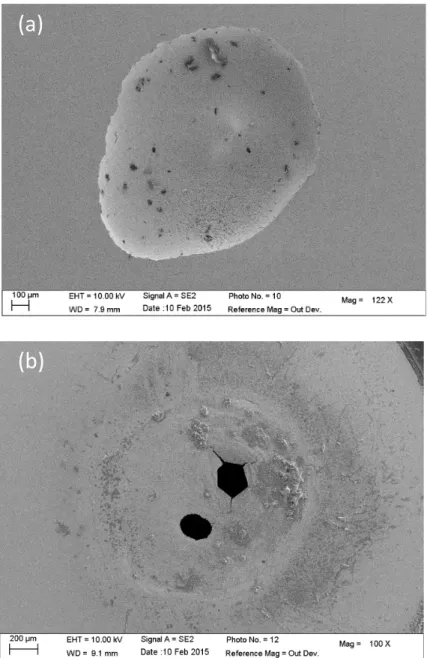
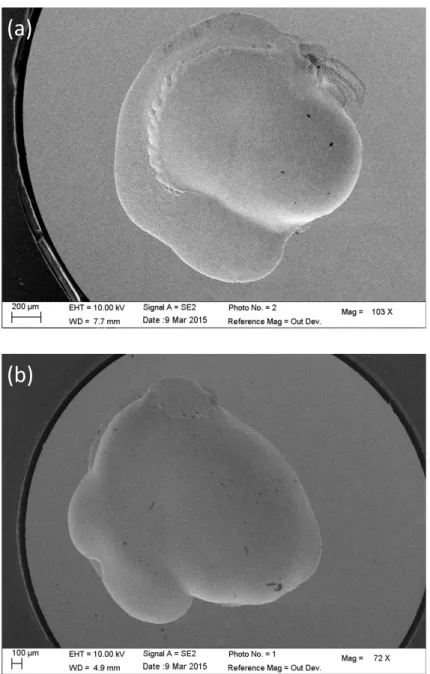
Another important issue concerning the pit morphology is the presence of a pit cover on the top of the pit [18]. This cover can be seen as a facilitator in the pit propagation since it locally confines the environment by acting as a diffusion barrier for the various species involved in the propagation mechanism. The usual structure is similar to a lace with several small holes in the cap allowing some exchanges between the bulk and the pit solution. As a result, depending on the combination of the electrode potential, the temperature of the electrolyte, and the amount of chloride ions [29], it is possible with our experimental device to obtain an open pit or a covered pit as shown in Fig. 4. When the chloride concentration in the syringe is large enough (3 M), an open pit was observed (Fig. 4a), whereas for a lower concentration (1.2 M), a cap was observed even if the duration of the experiments was 3 times longer, as shown in Fig. 4b. Interestingly, the cover had only one or two centered large holes, in contrast with the lacy like structure described in the literature for the 304 stainless steel in 1 M NaCl at 0.2 V/MSE [18;21] but in agreement with the cover found for some
14 16 18 20 22 24 26 900 1000 1100 1200 1300 1h30 at 25°C+ 2h30 at 20°C 1h at 20°C Ra d iu s / µm Temperature / °C 1h at 20°C + 1h30 at 15°C 200 250 300 350 400 De p th / µm
stable pits on 304 stainless steel in 1.3 M NaCl at – 0.4 V/MSE [16]. We believe that the lace did not develop due to the presence of the glass microcapillary in the close vicinity of the substrate. The microcapillary may prevent some exchanges between the bulk and the pit solution hindering the growth of some small perforations in the pit cover. Fig. 4: SEM images of an open pit for a 316L stainless steel after 1 hour of propagation obtained by injecting a 3 M NaCl solution with the microcapillary (a) and a covered pit obtained after 3 hours with a 1.2 M NaCl solution (b). For both experiments: T = 20°C – E = 0 vs. (Hg/Hg2SO4)/V – 0.5 M H2SO4
(a)
(b)
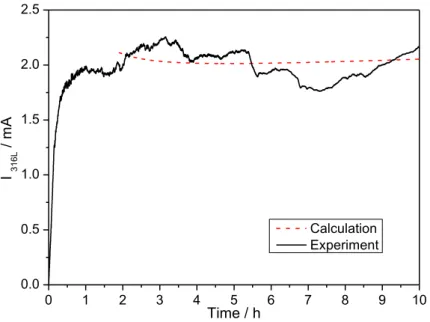
The measurements performed after different propagation times of the pit depth and the pit radius with an optical microscope and SEM allowed the determination of experimental laws for a quantitative description of the evolution of the pit parameters. For instance, for an open pit obtained at T = 20 °C, E = 0 V/MSE, and injecting 3 M NaCl with the microcapillary in a 0.5 M sulfate acid solution, the following empirical expressions were obtained by fitting the experimental measurements: 𝑝 = 126 + 1.57 ∗ |𝑡 − 2700|/,12 𝑓𝑜𝑟 𝑡 > 45 𝑚𝑖𝑛 (1) 𝑟 = 250 + 26.36 ∗ |𝑡 − 180|/,>2 𝑓𝑜𝑟 𝑡 > 3 𝑚𝑖𝑛 (2) where p is the pit depth (expressed in µm), r the pit radius (in µm) and t the propagation time (in s). In Eq. 1, the pit depth measured after 45 min of propagation was 126 µm, and in Eq. 2, the pit diameter measured after 3 min of propagation was 250 µm. Fig. 5: Calculated (red dashed line) and experimental pitting current (black curve) for a propagation at E = 0 vs. (Hg/Hg2SO4)/V – T = 20 °C - 3M NaCl (syringe) - 0.5 M H2SO4 0 1 2 3 4 5 6 7 8 9 10 0.0 0.5 1.0 1.5 2.0 2.5 I 316L / m A Time / h Calculation Experiment
These laws have a physical meaning and can be explained as follow: assuming that the pit was disc-shaped, it is possible to calculate the pit volume from the Eqs. (1) and (2). Then from the dissolution volume assuming that the pit volume is a cylinder (which was confirmed performing observation of pit cross-section), we can calculate the current using the Faraday’s law. Fig. 5 compares the calculated current, based on optical measurements and Faraday’s law (black curve), and the experimental current directly measured with the potentiostat during the experiments (red dashed-curve). Both currents are equal for long-term propagation (i.e. t > 1 h), explaining the quite constant current recorded during pitting propagation by the pit volume evolution. This result also allowed the microscopy measurements of pit depth and radius to be validated. For a covered pit obtained at T = 20 °C, E = 0 V/MSE and injecting 1.2 M NaCl with the microcapillary in a 0.5 M sulfate acid solution, the following empirical laws were determined: 𝑝 = 111 + 1.93 ∗ |𝑡 − 2700|/,1> 𝑓𝑜𝑟 𝑡 > 45 𝑚𝑖𝑛 (3) 𝑓𝑜𝑟 3 𝑚𝑖𝑛 < 𝑡 < 4ℎ ∶ 𝑟 = 130 + 4.20 ∗ 𝑡 − 180/.1> 𝑓𝑜𝑟 𝑡 > 4ℎ : 𝑟 = 250 + 26.36 ∗ 𝑡 − 180/.>2 (4) It is interesting to note that the pit depth evolves slightly with the chloride concentration (relation (1) and (3) are almost the same). Also during the first 4 hours of pit propagation, the pit radius obtained with an injection of 1.2 M NaCl with the microcapillary (Eq. 4) is lower than the radius resulting from an injection of 3 M NaCl solution. However after 4 hours of propagation, both radius reached the same value, suggesting that a saturation concentration of chloride has been reached at the periphery.
From the relations (3) and (4) and using the Faraday’s law, the dissolution current can also be calculated and compared with the experimental current measured with the potentiostat, as shown in Fig. 6. Conversely to the case of the open pit, the calculated current (red dashed line) is larger than
dissolution volume using the calculated current since we made the same calculation for a covered pit than for an open pit. ΔI can also be ascribed to the cover volume. The integration of the Faraday’s law with respect to the time allowed the cover volume to be determined from ΔI. Assuming that the cover has only a centered hole with a mean diameter of 100 µm, it is possible to perform a semi-quantitative calculation of the cover surface from the pit mouth radius, and thus from the volume to express the cover thickness, e, as: 𝑒 = 1 𝜋 𝑟H− 50H ∗ 𝑀 𝜌𝑛𝐹∗ 𝛥𝐼 ∗ 𝑡 (5) The numerical application of Eq. 5 gives an exponential increase of the mean value of the pit cover thickness varying from 10 µm after 10 min of propagation to about 25 µm after 10 hours of propagation. Experimentally, Tian et al. [16] have found a pit cover thickness of about 12 µm after 5 min of propagation for a 304 stainless steel in bulk of 1.3 M NaCl, which is in agreement with the values obtained in this work and which allows to ascribe the discrepancy between the two techniques used for monitoring the current corresponding to the pit propagation to the fact that the volume of the cover has to be taken into account. 0 1 2 3 4 5 6 7 8 9 10 0.0 0.5 1.0 1.5 2.0 2.5 I 316L / m A Time / h Experiment Calculation ΔΙ
Fig. 6: Calculated (red dashed line) and experimental pitting current (black curve) for a propagation at
E = 0 vs. (Hg/Hg2SO4)/V – T = 20 °C – 1.2 M NaCl (syringe) - 0.5 M H2SO4. The blue dashed curve is a
mean value used for the experimental current for the determination of ΔI.
Eqs. (1) and (3) also indicate that the pit depth for both open and covered pit increases as a function of the square root of the time. Same time dependence was determined by Ghahari et al. [19;36] who measured the pit depth evolution on stainless steel foils in various NaCl solutions up to 1 M using X-Ray radiography. Such a result can be explained by two different limiting mechanisms, namely a diffusion control or an ohmic control of the pit propagation [37]. During the first times of the propagation, diffusion has been widely suggested in literature to control the pit bottom process with the diffusion of metallic cations outside of the pit [19;23;33;38] and/or the diffusion of water to the pit since water is required for the transport of metallic cations outside of the pit [39]. However, for small pits, ohmic control has also been argued in literature [26;40]. Due to the presence of corrosion products [26] or the formation of hydrogen bubbles [40], a potential gradient may appear between the passive surface and the inner wall inside the pit. This potential gradient can result in a bottom surface inside the pit in the active potential range, thus allowing the metal dissolution. Based on published works for short propagation times, we can assume that both diffusion and ohmic control are possible mechanisms for longer propagation times.
3.2 Discrimination between diffusion and ohmic control for the pit propagation
To distinguish between diffusion and ohmic control for the propagation mechanism at the pit bottom, it is necessary to perform experiments with a potential change during the propagation. Interestingly, because we were able to generate a single pit, any minute changes of the current can be directly linked to the pit evolution without further hypothesis. Moreover, according to the Fick’s law for a limiting diffusion process, the current density is independent of any potential modification whereas for an ohmic controlled mechanism, the current density varies with the potential according
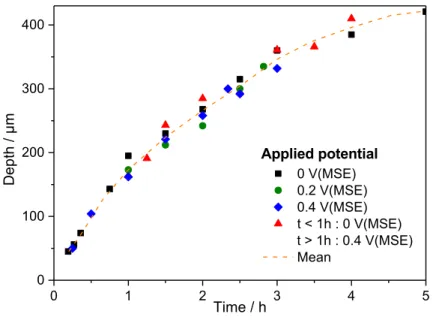
Fig. 7 shows the evolution of the pit depth as a function of time for experiments performed at T = 20°C in a 0.5 M H2SO4 solution for different applied potentials during the whole test (0 V/MSE –
squares, 0.2 V/MSE – circles, and 0.4 V/MSE – diamonds). The concentration of chloride ions used in the syringe was 3 M, which resulted in the formation of an opened pit. Pit depth did not significantly vary with the constant applied potential for the different propagation times. For some experiments, the potential was varied according to the following procedure: first, the initiation and the propagation of the pit for one hour were achieved at 0 V/MSE, and then a potential step at 0.4 V/MSE was applied. The results are shown in Fig. 7 (triangles). Interestingly, the different pit depths obtained as a function of time followed the same variations that the pit generated at a constant potential.
It could be surprising to obtain a quite constant pit depth for different applied potentials since according Butler Volmer’s law a higher dissolution rate is expected at higher potential. The explanation could be a self-regulated mechanism in presence of a salt film [33]. When a salt film is at the pit bottom, two different flows have to be taken into account: (i) at the metal – salt film interface corresponding to the metal dissolution to thicken the salt film, and (ii) at the salt film – solution interface, ascribed to the dissolution of the salt film into the pit solution and the outwards diffusion of cations outside of the pit. At steady-state (i.e. at a constant current), for constant potential, these two flows are equal, indicating that the salt film thickness remains constant. However, when the applied potential is increased, the local potential at the pit bottom under the salt film is increased as does the dissolution flow. Thus, the salt film equilibrium is lost with the dissolution flow becoming greater than the diffusion flow resulting in an increase of the salt film thickness and in turn to an increase of the salt film resistance. Such a variation of resistance inside the pit has for consequence to decrease the potential at the pit bottom (ohmic drop) until it returns to the equality of the two flows. This retroactive effect of the salt film on the bottom potential could explain why a constant pit depth was observed for the different applied potentials despite the instantaneous increase of the metal dissolution when the potential was changed. The salt film presence is also ascribed to a
diffusion limiting process. Indeed assuming a fast diffusion, the diffusion flow should be greater than the dissolution flow. Thus, the salt film thickness should decrease, causing a decrease in the salt film resistance, whereas the pit bottom potential under the salt film should increase, giving rise to an increase of the dissolution flow. In such situation, the salt film should disappear, and there will be no more reason to get a constant pit depth for different applied potentials.
Fig. 7: Pit depth measured as a function of propagation time for different applied potential at 20°C and injecting 3 M NaCl + 0.5 M H2SO4 with the glass microcapillary in a 0.5 M H2SO4 bulk. (MSE:
mercury sulphate electrode)
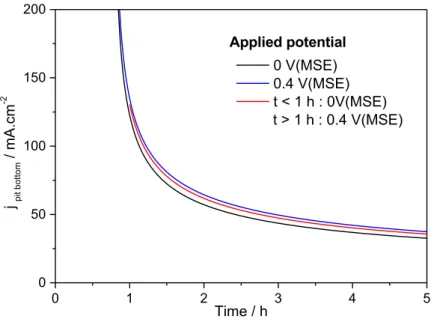
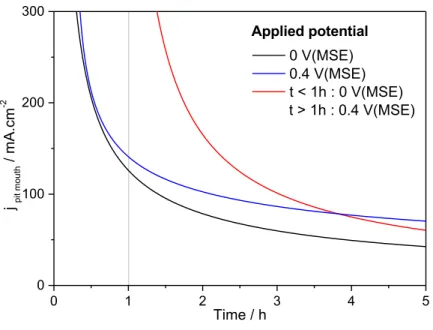
From pit depth measurements, it has already been shown that the current density at the pit bottom can be calculated [29]. Indeed, there is a constant current density at the bottom of the pit as it was recently found by quantifying the variation of local current density around the perimeter of the pit using X-Ray radiography [19]. Fig. 8 shows the evolution of current density at the pit bottom as a function of time for different applied potential, which was obtained from the measurements of the pit depth presented in Fig. 7. A modification of the potential after 1 hour of propagation from
0 1 2 3 4 5 0 100 200 300 400 0 V(MSE) 0.2 V(MSE) 0.4 V(MSE) t < 1h : 0 V(MSE) t > 1h : 0.4 V(MSE) Mean De p th / µm Time / h Applied potential
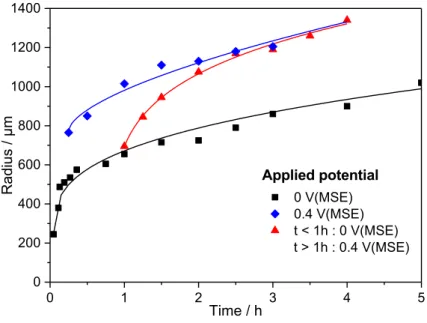
remains similar to the black curve over the whole duration of the experiment. Such a result eliminates the ohmic effects for the propagation mechanism at the pit bottom, and the limiting mechanism at the pit bottom can only be the diffusion of ionic species. Fig. 8: Current density calculated at the pit bottom for results presented in Fig. 7. (MSE: mercury sulphate electrode) Similar analysis were performed for the pit radius as shown in Fig. 9 for different applied potentials (0 V/MSE – squares, and 0.4 V/MSE – diamonds) and for a potential step applied after the propagation for 1 hour (from 0 to 0.4 V/MSE). First, whatever the duration of the pit propagation, the pit radius was larger at 0.4 V/MSE than at 0 V/MSE, in agreement with results presented in Fig. 2. When a potential step was applied after 1 h of propagation, the pit radius had an intermediate value between the radiuses determined for experiments performed at 0 V/MSE and those at 0.4 V/MSE. It is also worth noting that the radius value tends towards the same limit than the pit radius obtained at 0.4 V/MSE. 0 1 2 3 4 5 0 50 100 150 200 j pit b ot to m / mA.cm -2 Time / h 0 V(MSE) 0.4 V(MSE) t < 1 h : 0V(MSE) t > 1 h : 0.4 V(MSE) Applied potential
The SEM picture obtained after different propagation times shows that the radius increase is not uniform on the whole pit wall (Fig. 10). Indeed after 1 hour of propagation at 0 V/MSE and then 15 min at 0.4 V/MSE (Fig. 10a), the pit expansion on the pit edge is clearly visible. The surface created by the potential change is less deep than the pit developed at 0 V/MSE during 1 hour. However, increasing the propagation time at 0.4 V/MSE resulted in the formation of an homogeneous pit radius and the surface expansion becomes as deep as the pit generated at 0 V/MSE (Fig. 10b). The calculation of the local current density at the pit mouth obtained from the radius measurement is shown in Fig. 11. Conversely to the current obtained for the pit bottom, the potential change after 1 hour of propagation from 0 V/MSE to 0.4 V/MSE was accompanied by a change in the local current density at the pit mouth (the red curve is no longer similar to the black curve after 1 hour), indicating that the pit mouth growth is potential dependent. Fig. 9: Evolution of the pit radius as a function of time for different applied potential at 20°C and injecting 3 M NaCl + 0.5 M H2SO4 with the glass microcapillary in a 0.5 M H2SO4 bulk. (MSE: mercury
sulphate electrode). 0 1 2 3 4 5 0 200 400 600 800 1000 1200 1400 Applied potential 0 V(MSE) 0.4 V(MSE) t < 1h : 0 V(MSE) t > 1h : 0.4 V(MSE) Ra d iu s / µm Time / h
Fig. 10: SEM images of the pit formed after 1 h of propagation at 0 vs. (Hg/Hg2SO4)/V + 15 min at 0.4
vs. (Hg/Hg2SO4)/V (a); and 1 h at 0 vs. (Hg/Hg2SO4)/V + 2 h at 0.4 vs. (Hg/Hg2SO4)/V (b). Same
experimental conditions than in Fig. 7.
(b)
(a)
Fig. 11: Current density calculated at the pit mouth from results presented in Fig. 9. (MSE: mercury sulphate electrode).
Similar investigations were performed for a covered pit using 1.2 M NaCl instead of 3 M NaCl in order to determine whether the pit bottom mechanism is the same than for an uncovered pit. Unfortunately, the presence of the cover on the pit is controlled by a combination of different parameters (temperature, chloride – sulfate ratio and potential). For T = 20 °C, in 1.2 M NaCl + 0.5 M H2SO4, the pit is covered after 1 hour at 0 V/MSE (similarly to results presented in Fig. 4b). When the potential was changed after 1 hour from 0 V/MSE to 0.4 V/MSE for 15 min, the cover was partially dissolved with the appearance of several little holes forming the lacy-like structure. In addition, the cover residue has also collapsed inside the pit as shown in Fig. 12a. For longer polarization duration (1 hour at 0 V/MSE, and then 2 hours at 0.4 V/MSE) the pit cover was entirely dissolved (Fig. 12b). The potential modification from 0 V/MSE to 0.4 V/MSE has changed the pit from covered one to open one. Conversely, a potential modification was also performed at 1 h of propagation from 0 V/MSE to – 0.2 V/MSE. The pit propagation was maintained at – 0.2 V/MSE (revealing that the
0 1 2 3 4 5 0 100 200 300 0 V(MSE) 0.4 V(MSE) t < 1h : 0 V(MSE) t > 1h : 0.4 V(MSE) Applied potential j pit mout h / mA.cm -2 Time / h
current value decreased, as well as did the active pit surface. In that case, it was difficult to extract quantitative information from the ex situ microscopy measurements since the measurable radius at the pit mouth corresponds to the propagation stage at 0 V/MSE and not to the propagation at – 0.2 V/MSE.
Fig. 12: SEM images of a pit after 1 h at 0 vs. (Hg/Hg2SO4)/V + 15 min at 0.4 vs. (Hg/Hg2SO4)/V (a) and after 1 h at 0 vs. (Hg/Hg2SO4)/V and 2 h at 0.4 vs. (Hg/Hg2SO4)/V (b). For both experiments: T = 20°C –
1.2 M NaCl + 0.5 M H2SO4
(b)
(a)
These experiments are however very useful to characterize the behavior of a covered pit. Propagation mechanisms for a 2D covered pit on stainless steel foils in NaCl solutions were investigated by X-ray radiography in literature [19;36]. They found that the pit width growth rate increases with chloride concentration, as we also determined with a change in the chloride amount injected with the microcapillary [29]. The most likely reason would be that an increase in the chloride concentration causes a decrease in IR drop in the pit solution leading to an increase in the lateral growth rate. The growth of the pit width beneath a perforated cover would be under an ohmic control.
3.3 Evidence of salt film presence at the pit bottom
The diffusion-controlled growth of the pit bottom is generally associated with the presence of a salt film, as it was already observed for the pitting of nickel in a 0.5 M HCl solution using Raman Spectroscopy [42] or the pitting of iron in 1 M HCl using in-situ Synchrotron X-ray Diffraction [43]. The salt film is made of different complexes of the metallic cations coming from metal dissolution with the anions present in the electrolyte such as Cl- and SO
42- since competition between both anions was
already reported in the literature [24-26]. The presence of a salt film at the pit bottom allows explaining some of our experimental results. First, a salt film might explain why the pit depth remains constant while increasing the potential of the stainless steel substrate as shown in Fig. 2. It could also explain the constant value of the pit depth as a function of the chloride amount injected with the glass microcapillary [29]. In addition, it is also noted in the literature that the nucleation and the growth of a salt film require an appreciable overvoltage [44]. Thus, additional experiments were performed at 20°C injecting 3 M NaCl with the glass microcapillary in a 0.5 M H2SO4 bulk solution at a
low potential in the passive domain (E = - 0.4 V/MSE) to minimize the overvoltage between the pit and the passive surfaces. Fig. 13 shows SEM image of the pit bottom morphologies for such
13a), as it was observed for other materials [45]. This roughness can be explained by the absence of any salt film at the pit bottom, due to too low overvoltage, leading to a preferential steel dissolution at the bottom at some surface state defects like sulfide inclusion [9], carbide particles [7] and grain boundaries [10]. After 6 hours of propagation, the surface became more uniform (Fig. 13b). The increase of propagation time may have formed a continuous salt film at the pit bottom, resulting in a polished-like surface morphology well known for the salt film covered pit (Fig. 13c). Such pit bottom morphology presented in Fig. 13a was only visible at the beginning of the passive range, whereas for higher potential the pit bottom aspect was already similar to a polished surface even for short propagation times (Fig. 13c).
Fig. 13: SEM images of pit bottom surface for a 316L stainless steel after 1 hour at -0.4 vs. (Hg/Hg2SO4)/V (a), 6 hours at -0.4 vs. (Hg/Hg2SO4)/V (b) and 1 hour at 0 vs. (Hg/Hg2SO4)/V (c)
Another interesting observation at low overvoltage is the spontaneous dissolution and re-precipitation of the salt film during the propagation of the pit. Fig. 14 shows this phenomenon. The inset presents the pitting current during an experiment performed for 3 hours at – 0.4 V/MSE, 20° and injecting 3 M NaCl in 0.5 M H2SO4 with the glass microcapillary. In a typical single pit record, the current had first an increase and then a constant value as shown in Fig. 5. In the inset of Fig. 14, two current transient corresponding to two significant decreases are shown on the current plateau (the first one in blue, the second one in red). These two exponential current decreases are shown in Fig. 14 where initial time (t = 0 s) corresponds to the moment in which the salt film dissolves (i.e. for 1h30 and 2h20 in the inset), whereas the zero value of the current corresponds to the current value just before the dissolution. Such salt film behavior was already observed in literature for 304 stainless steel in 1 M NaCl [34;46] but the experiment was not spontaneous as the dissolution was caused by a potential decrease and the precipitation by a potential increase. When the salt film was dissolved, the pit bottom was no longer under a diffusion limitation in the pit solution. A possible explanation is that the pit bottom is controlled by a slow formation and growth of a non-continuous salt film that does not have the same properties than the continuous salt film present before the dissolution. In
non-continuous salt film [47] or the increase of pore length constituting the non-continuous salt film [48]. When the continuous salt film is formed, the current returns to the value measured before the dissolution (current 0 in Fig. 14) and does not exceed this value. This indicates that supersaturation was not reached for the precipitation of the salt film, as it is commonly the case for the salt film formation [46]. However, a precipitation of a salt film without supersaturation was already observed in literature for a convective system using a rotating disk electrode [49]. Fig. 14: spontaneous dissolution and precipitation of a salt film during the single pit propagation phase. Inset: Single pit current record for a 316L stainless steel at – 0.4 vs. (Hg/Hg2SO4)/V – 20°C – 3M NaCl in 0.5 M H2SO4 in which the salt film had spontaneously dissolved and precipated twice (in blue and red)
4 Conclusions
An original experimental setup was used to create reproducible single pits on 316L stainless steel. These single pits have a similar shape to real pits and it was possible to follow the evolution of both pit radius and pit depth. The pit cover is of great importance for the pit propagation and it was shown that its volume has to be taken into account for modeling the current from the Faraday’s law. -1 0 1 2 3 4 5 6 7 -600 -400 -200 0 200 I 31 6L / µATime after salt film dissolution / min
1st dissolution 2nd dissolution 0 1 2 3 0,0 0,5 1,0 I 316L / mA Propagation time / h
It was also shown that it is possible to dissolve the pit cover during an experiment by changing the experimental conditions (electrode potential, chloride to sulfate ratio and temperature). A special attention has been paid for describing the pit propagation. From the square root of time evolution of the pit depth, it was concluded that the pit bottom could be under diffusion control or ohmic control. These two mechanisms were suggested in literature for short propagation times, but to our knowledge no work was performed for long propagation time. By performing potential step experiments, the ohmic control was discarded, meaning that the pit bottom propagation is under diffusion control. In such diffusive process, some evidences of a salt film presence at the pit bottom were highlighted and the regulation role of the salt film was discussed.
Acknowledgements
The authors gratefully acknowledge AREVA NC, CEA and CNRS for the funding of this project. Françoise Pillier (UMR 8235) is acknowledged for SEM observations and Michel Tabarant (CEA – DEN – DPC) for ICP analysis.
References
[1] J. Keir, Experiments and Observations on the Dissolution of Metals in Acids, and Their Precipitations; with an Account of a New Compound Acid Menstruum, Useful in Some Technical Operations of Parting Metals, Phil. Trans. R. Soc. Lond. 80 (1790) 359
[2] C.F. Schoenbein and M. Faraday, The letters of Faraday and Schoenbein 1836 – 1862, with notes, comments and references to contemporary letters, in: G.W.A. Kahlbaum and F.V. Darbishire (Eds), Bâle 1899
[4] J. Bhandari, F. Khan, R. Abbassi, V. Garaniya and R. Ojeda, Modelling of pitting corrosion in marine and offshore steel structures – A technical review, Journal of Loss Prevention in the Process Industries 37 (2015) 39
[5] T. Shibata and T. Takeyama, Stochastic Theory of Pitting Corrosion, Corrosion 33 (1977) 243 [6] H.H. Strehblow, Mechanisms of Pitting Corrosion, in Corrosion mechanisms in theory and practise, P. Marcus (eds), 3rd edition (2012) 243
[7] JA.M. Kolotyrkin, Pitting Corrosion of Metals, Corrosion 19 (1963) 261t
[8] J. Stewart, Pit Initiation on Austenitic Stainless Steel, PhD thesis, University of Southampton (1990) [9] G.S. Eklund, Initiation of Pitting at Sulfide Inclusions in Stainless Steel, J. Electrochem. Soc. 121 (1974) 467 [10] M.A. Streicher, Pitting Corrosion of 18Cr-8Ni Stainless Steel, J. Electrochem. Soc. 103 (1956) 375 [11] J. Stewart and D.E. Williams, The Initiation of Pitting Corrosion on Austenitic Stainless Steel: On the role and importance of sulphide inclusions, Corr. Sci. 33 (1992) 457 [12] L. Stockert, Metastable Pitting Corrosion, PhD thesis, ETH Zurich (1988)
[13] Y. Gonzalez-García, G.T. Burstein, S. Gonzalez and R.M. Souto, Imaging metastable pits on austenitic stainless steel in situ at the open-circuit corrosion potential, Electrochem. Comm. 6 (2004) 637
[14] E.D. Parsons, H.H. Cudd and H.L. Lochte, Synthetic Corrosion Pits and the Analysis of Their Contents, J. Phys. Chem. 45 (1941) 1339
[15] J.W. Tester and H.S. Isaacs, Diffusional effects in simulated localized corrosion, J. Electrochem. Soc. 122 (1975) 1438
[16] W. Tian, S. Li, N. Du, S. Chen and Q. Wu, Effects of applied potential on stable pitting of 304 stainless steel, Corrosion Science 93 (2015) 242
[17] N.D. Greene and M.G. Fontana, A Critical Analysis of Pitting Corrosion, Corrosion 15 (1958) 25t [18] P. Ernst and R.C. Newman, Pit growth studies in stainless steel foils. I. Introduction and pit growth kinetics, Corrosion Science 44 (2002) 927
[19] M. Ghahari, D. Krouse, N. Laycock, T. Rayment, C. Padovani, M. Stampanoni, F. Marone, R. Mokso and A.J. Davenport, Synchrotron X-ray radiography studies of pitting corrosion of stainless steel: Extraction of pit propagation parameters, Corr. Sci (2015) in press
[20] I.L. Rosenfeld and I.S. Danilov, Electrochemical aspects of pitting corrosion, Corr. Sci. 7 (1967) 129
[21] N.J. Laycock, S.P. White, J.S. Noh, P.T. Wilson and R.C. Newman, Perforated Covers for Propagating Pits, J. Electrochem. Soc. 45 (1998) 1101
[22] G.S. Frankel, L. Stockert, F. Hunkeler and H. Boehni, Metastable Pitting of Stainless Steel, Corrosion 43 (1987) 429
[23] P.C. Pistorius and G.T. Burstein, Metastable Pitting Corrosion of Stainless Steel and the Transition to Stability, Phil. Trans. R. Soc. Lond. A 341 (1992) 531
[24] P. Ernst and R.C. Newman, Pit growth studies in stainless steel foils. II. Effect of temperature, chloride concentration and sulphate addition, Corr. Sci 44 (2002) 943
[25] N. Aouina, F. Balbauld-Célérier, F. Huet, S. Joiret, H. Perrot, F. Rouillard, V. Vivier, Initiation and growth of a single pit on 316L stainless steel: Influence of SO42- and ClO4- anions, Electrochimica
Acta 104 (2013) 274
[26] K.J. Vetter and H.H. Strehblow, Pitting Corrosion in an Early Stage and Its Theoretical Implications, in Localized Corrosion, NACE Houston (1974) 240 [27] T. Suter and H. Bohni, A new microelectrochemical method to study pit initiation on stainless steels, Electrochimica Acta 42 (1997) 3275 [28] S.M. Ghahari, A.J. Davenport, T. Rayment, T. Suter, J.P. Tinnes, C. Padovani, J.A. Hammons, M. Stampanoni, F. Marone and R. Mokso, In situ synchrotron X-ray micro-tomography study of pitting corrosion in stainless steel, Corr. Sci 53 (2011) 2684
[29] S. Heurtault, R. Robin, F. Rouillard and V. Vivier, Initiation and propagation of a single pit on stainless steel using a local probe technique, Faraday Discussions 180 (2015) 267
[30] N. Stolica, Pitting Corrosion of Fe-Cr and Fe-Cr-Ni alloys, Corrosion Science 9 (1969) 455
[31] H. Bouazaze, J. Fransaer, F. Huet, P. Rousseau and V. Vivier, Electrolyte-resistance change due to an insulating sphere in contact with a disk electrode, Electrochimica Acta 55 (2010) 1645
[32] C. Gabrielli, F. Huet, M. Keddam, P. Rousseau and V. Vivier, Scanning Electrochemical Microscopy Imaging by Means of High-Frequency Impedance Measurements in Feedback Mode, J. Phys. Chem. B 108 (2004) 11620
[33] H.S. Isaacs, The Behavior of Resistive Layers in the Localized Corrosion of Stainless Steel, J. Electrochem. Soc. 120 (1973) 1456
[34] G.T. Gaudet, W. T. Mo, T. A. Hatton, J. W. Tester, J. Tilly, H. S. Isaacs, R. C. Newman, Mass Transfer and Electrochemical Kinetic Interactions in Localized Pitting Corrosion, AICHE Journal 32 (1986) 949
[35] R.C. Newman, 2001 W.R. Whitney Award Lecture : Understanding the Corrosion of Stainless Steel, Corrosion 57 (2001) 1030
[36] S.M. Ghahari, In Situ Synchrotron X-Ray Characterisation and Modelling of Pitting Corrosion of Stainless Steel, PhD thesis, University of Birmingham (2012)
[37] G.S. Frankel, Pitting Corrosion of Metals, J. Electrochem. Soc. 145 (1998) 2186
[38] R.C. Alkire and K.P. Wong, The Corrosion of Single Pits On Stainless Steel in Acidic Chloride Solution, Corrosion Science 28 (1988) 411
[39] N.D. Tomashov, G.P. Chernova and O.N. Markova, Zashchita Metallov 7 (1971) 104
[40] H.W. Pickering and R.P. Frankenthal, Mechanism of pit and crevice propagation on iron and stainless steels, in Localized Corrosion, NACE Houston (1974) 261 [41] M. Pourbaix, L. Klimzack-Mathieiu, Ch. Mertens, J. Meunier, Cl. Vanleugenhaghe, L. de Munck, J. Laureys, L. Neelemans, M. Warzee, Potentiokinetic and corrosimetric investigations of the corrosion behavior of alloy steels, Corrosion Science 3 (1963) 239 [42] N. Sridhar and D.S. Dunn, In Situ Study of Salt Film Stability in Simulated Pits of Nickel by Raman and Electrochemical Impedance Spectroscopies, J. Electrochem. Soc. 144 (1997) 4243 [43] W. Xu, S.R. Street, M. Amri, J.F.W. Mosselmans, P.D. Quinn, T. Rayment and A.J. Davenport, In-situ Synchrotron Studies of the Effect of Nitrate on Iron Artificial Pits in Chloride Solutions I. On the Structures of Salt Layers, J. Electrochem. Soc. 162 (2015) C238 [44] D.A. Vermilyea, Anodic Films, in Advances in Electrochemistry and Electrochemical Engineering, P. Delahay and C.W. Tobias (eds), 3 (1963) 211
[46] H.S. Isaacs and R.C. Newman, Dissolution Kinetics During Localized Corrosion, in Corrosion and Corrosion Protection, Frankenthal and Mansfeld (eds), The Electrochemical Society (1981) 120 [47] M. Fleischmann and H.R. Thirsk, An Investigation of Electrochemical Kinetics at Constant Overvoltage. The Behaviour of the Lead Dioxide Electrode. Part 5. The formation of Lead Sulfate and The Phase Change to Lead Dioxide, Trans. Faraday Soc. 51 (1955) 71
[48] H.J. Mueller, Die Bedeckungstheorie der Passivitat der Metalle, Verlag Chemie GMBH, Berlin (1933)
[49] H.C. Kuo and D. Landolt, Rotating disc electrode study of anodic dissolution on iron in concentrated chloride media, Electrochimica Acta 20 (1975) 393