Pd-Ag/SiO
2xerogel catalyst forming by impregnation on alumina foams
C. Aliéa, F. Ferauchea, A. Léonarda, S. Lamberta, N. Tcherkassovaa, B. Heinrichsa, M. Crinea, P. Marchota, E. Loukineb, J.P. Pirarda
a Laboratory of Chemical Engineering, Institute of Chemistry B6a, University of Liege, B-4000 Liege, Belgiumb Department of Chemical
Technology of Silicates, Chemical Technology of Refractory Non-metallic and Silicate Materials, D. Mendeleev University of Chemical Technology of Russia, Miusskaya Square 9, 1254047 Moscow, Russia
Abstract
A Pd-Ag/SiO2 xerogel catalyst prepared in one step by sol-gel process has been entrapped in cylindrical porous alumina foams of three different pore sizes in order to shape the catalyst under the appropriate form with suitable mechanical resistance to be used in an industrial fixed bed reactor. After drying, calcination and reduction, the Pd-Ag/SiO2 xerogel catalyst pellets are immobilized inside the open porosity of the alumina foam. The localization of the xerogel catalyst in the alumina foams has been studied by X-ray tomography. The three-dimensional porous structure was reconstructed from the consecutive cross-sections obtained by this technique. This method shows that the Pd-Ag/SiO2 xerogel catalyst is uniformly dispersed inside the porosity of the alumina foams. Activity and selectivity of Pd-Ag/SiO2 xerogel catalyst reference or catalyst entrapped in alumina foams have been studied for selective hydrodechlorination of 1,2-dichloroethane into ethylene. The specific reaction rate obtained with catalyst entrapped in alumina foams is smaller than the one obtained from corresponding catalyst powders. The catalytic activity decrease observed for Pd-Ag/SiO2 xerogel catalyst entrapped in porous alumina foams most probably arises from diffusional limitations inside the porous texture of the alumina foams.
Keywords: Bimetallic Pd-Ag catalysts; Sol-gel process; Forming; Porosity; Hydrodechlorination; Image
analysis
1. INTRODUCTION
Catalyst in powder form cannot be used as synthesised in an industrial fixed bed reactor because pressure drop is too high to produce at large scale. The catalyst needs pre-forming in such a way that the catalyst active sites remain accessible for reac-tants, the pressure drop in the catalytic bed is minimized and the mechanical resistance of the catalyst pellets is sufficient to avoid bed collapse, loss of fines and progressive increase of pressure drop. Several industrial forming processes exist such as extrusion pelletizing, granulation, spray drying, drop coagulation, ... [1]. Another method consists in immobilizing the catalyst in a support [2-4]. This last method has been used to entrap Pd-Ag/SiO2 xerogel catalysts in highly porous alumina foams with high mechanical and thermal resistance [5]. Pd-Ag/SiO2 cogelled catalysts have been studied for the selective hydrodechlorination of chlorinated alkanes into alkenes.
This reaction is particularly interesting from an economical and environmental point of view in comparison with the incineration of chlorinated industrial wastes [6,7]. These Pd-Ag/SiO2 catalysts were prepared in a one-step sol-gel process using industrial grade reagents. This synthesis method consists in co-gelation of tetraethylorthosilicate TEOS with additives with functional groups of the form (RO)3Si-X-A, in which A is a functional organic group able to form a chelate with a metal cation and X is an inert hydrolytically stable spacer, which links A to the hydrolysable group (RO)3Si-. These additives enable to introduce the metal directly during the synthesis of the catalytic support rather than dispersing the active component on a previously synthesised support [7-14]. The co-condensation of TEOS with such molecules results in materials in which the catalytic metal is anchored to the SiO2 matrix. 3-(2-Aminoethylamino)propyltrimethoxysilane (EDAS) is one of these interesting additives that can be employed to homogeneously disperse nanometer-sized metal particles in a silica matrix. The catalyst composition chosen for immobilization inside the alumina foam is the metal loading that gives the highest selectivity for hydrodechlorination of 1,2-dichloroethane into ethylene [12], i.e., 1.5wt.% Pd and 3 wt.% Ag. The alumina foams are immersed in the sol-gel solution containing Pd, Ag, the SiO2 precursors EDAS and TEOS, water and ethanol before gelation. After gelation, aging, drying, calcination and reduction
steps, the low-density xerogel with wide pore size range (1-100 nm) and in which Pd-Ag alloy nanocrystallites are located inside microporous silica particles themselves immobilized in the open porosity of the alumina foam.
The aim of this work is to show the good dispersion of the catalyst xerogel inside the porosity of the alumina foam and the accessibility of the active sites. To do this, the activity and selectivity for the reaction of selective hydrodechlorina-tion of 1,2-dichloroethane into ethylene has been studied for the catalyst entrapped in the alumina foam and compared to the catalytic properties of the reference material viz. the sol-gel material obtained under powder form after grinding and sieving between 250 and 500 µm. The knowledge of the localization of the xerogel catalyst inside the alumina foam is important to understand the catalytic properties of the whole system. This implies determining the local porosity variations before and after the impregnation process. X-ray microtomography coupled with image analysis has already been used in the past to characterize the texture of highly porous materials [15,16]. The consecutive cross-sections obtained by this technique can be used to perform a three-dimensional image reconstruction and image analysis on the reconstructed images can be used to quantify the porous structure.
This work is part of a large project consisting in preparing bimetallic supported catalysts in a one step sol-gel process at large scale with industrial grade reagents and to form them for industrial applications.
2. EXPERIMENTAL
2.1. Preparation of Al2O3 foams
The α-alumina foams were synthesised at the Mendeleev University of Chemical Technology of Russia, Moscow. The suitable properties of the foams were achieved by addition of dispersed powders of MgO and TiO2 [5]. After shaping, the cylindrical alumina foams were burnt at 1500 °C in air. The material obtained is made of
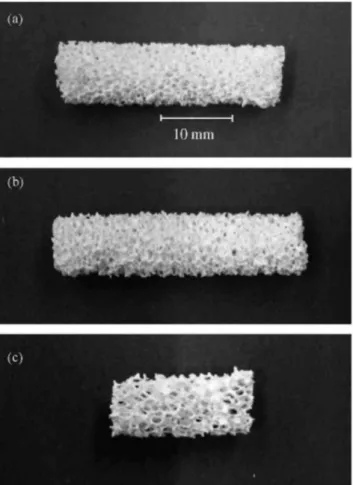
α-Al2O3 with open structure. Three kinds of alumina foams were used as support (Fl, F2 and F3) (Fig. 1), the pore size of the alumina foams increasing from F1 to F3. This kind of support is inert for the reaction of hydrodechlo-rination of 1,2-dichloroethane into ethylene.
All foam samples have about the same diameter, the diameter was chosen in order to easily put the foams inside the hydrodechlorination stainless steel reactor which is usually used for all the powder catalytic tests. The height of the alumina foam F3 is lower than the other samples. Consequently two samples F3, named F3a and F3b, were impregnated to obtain the same xerogel catalyst mass entrapped inside the porosity than the samples F1 and F2.
The physical properties of the alumina foam are as follows: the durability on compression is equal to 0.5 MPa, the specific surface area (SBET)is very low (0.5 m
2
/g) and the density measured by helium pycnometry is equal to 3.94 g/cm3, value which is very close to the value of the true density found in [17], viz. 3.97 g/cm3.
2.2. Preparation of Pd-Ag/SiO2 xerogels supported on α-Al2O3 foams
The initial sol-gel solution, into which alumina foams were dipped, was prepared using industrial grade reagents in one single step [14]. Palladium acetylacetonate (Pd(acac)2) and silver acetate (AgOAc) were mixed in half the ethanol denaturised with 0.5% of diethylphthalate (DEP) and the modified alkox-ide EDAS (Dynasylan DAMO) was added. The molar ratios EDAS/Pd(acac)2 and EDAS/Ag(OAc) were chosen equal to 2. The mixture was stirred at ambient temperature in a closed vessel for 1 h in order to form EDAS complexes with Pd and Ag. Industrial TEOS (Dynasil A) was then added. Finally, a solution of aqueous 0.18 M NH3 in the rest of ethanol was slowly added under vigorous stirring. The hydrolysis ratio, that is the molar ratio H= [H2O]/([TEOS] + 3/4[EDAS]), and the dilution ratio, that is the molar ratio R= [ethanol]/([TEOS] + [EDAS]) were kept constant at values of 5 and 10, respectively. The metal content of the Pd-Ag/SiO2 catalysts was 1.5 wt.% Pd and 3 wt.% Ag. The alumina foams were impregnated as follows: the four alumina foams samples (Fl, F2, F3a, F3b) were put together into the vessel containing the previously described liquid sol-gel solution. The alumina foams addition was immediately performed after introduction of the aqueous ammonia. The vessel was then closed tightly and heated to 70 °C for 72 h for gelation and aging.
After aging, the gel containing the four alumina foam samples were dried under vacuum according to the following procedure: the vessel was opened and put into a drying oven heated to 80 °C, and the pressure was slowly decreased (to prevent gel bursting) from atmospheric pressure to a vacuum of 1200 Pa after 18 h. At 1200 Pa, the temperature was increased up to 150 °C and the gel was maintained under those conditions during 32 h The impregnated α -alumina foams were then removed from the excess gel. The remaining gel was used to
prepare a sample of catalytic powder used as reference sample. The catalytic powder and impregnated alumina foams were then calcined and reduced. During calcination samples were heated to 400°C at a rate of 120°C/h under flowing air (0.02 mmol/s); this temperature was maintained for 12 h in air (0.1 mmol/s). The samples were then reduced, they were heated to 350 °C at a rate of 350°C/h under flowing H2 (0.25 mmol/s) and maintained at this temperature for 3 h under hydrogen flow. The sample is then kept in a closed flask under air and needs a second reduction in situ before the catalytic test.
Fig. 1. Digital pictures of the free foams Fl (a), F2 (b), F3a (c).
Pd-Ag/SiO2 xerogel reference catalyst has the following textural properties: the specific surface area (SBET) determined by nitrogen adsorption is equal to 395 m2/g, the density of the silica skeleton determined by helium pycnometry is equal to 2.22 g/cm3 and the total pore volume (Vv), estimated from nitrogen adsorption and mercury porosimetry [18], is equal to 3.6 cm3/g. The high pore volume and consequently the low bulk density observed is one of the remarkable properties of these Pd-Ag/SiO2 xerogel catalysts. The gel formation induced by a nucleation process initiated by the metal ligand EDAS leads to large silica particles with an hydrolysed EDAS core and a shell principally made of hydrolysed TEOS [12,18]. The silica particles (diameter: 20 nm) and the spaces between these particles are large enough to reduce the effect of capillary pressure during drying under vacuum and the final material preserves a high pore volume. This enables to avoid supercritical drying. However, the gel shrinkage during drying is still important as the pore volume decreases from 20 cm3/g for the wet gel to 3.6 cm3/g for the dried xerogel catalyst. This value is nevertheless quite higher than the pore volume classically observed for samples dried under atmospheric conditions (around 0.5 cm3/g).
2.3. Sample designation
Two batches of reference powder were synthesised and were named Px where x=1, 2 is used to distinguish the two catalyst batches. The impregnation process was performed with two series of samples in order to study the reproducibility of the impregnation process. The first series of samples is named Fx-P1 and the second series is named Fx-P2, with x= 1, 2, 3, for each type of alumina foam. In order to simplify the sample notation, especially when the mean apparent reaction rates will be discussed, the whole sample series F1-P1, F2-P1, F3-P1 will simply be called F-P1 and the whole series F1-P2, F2-P2, F3-P2 called F-P2.
2.4. Catalytic tests
The Pd-Ag/SiO2 xerogel catalysts immobilized in the three α-Al2O3 foams (F1, F2, F3) and the reference catalyst powders were tested for the selective hydrodechlorination of 1,2-dichloroethane into ethylene. The mass of catalyst used for each test (~0.09g) was chosen to maintain a relatively low conversion, around 20%, in order to calculate the reaction rate assuming a differential reactor.
The reaction of selective hydrodechlorination was performed in a stainless steel tubular reactor with an internal diameter of about 10 mm. The reactor was placed in a convection oven with programmable temperature. A constant flow of each reactant was maintained with a Gilson piston pump for 1,2-dichloroethane and Brooks mass flow controllers for helium and hydrogen: 0.012 mmol/s for 1,2-dichloroethane, 0.46 mmol/s for helium and 0.025 mmol/s for hydrogen. The temperature within the reactor was successively fixed at 200, 250, 300, 350 and 300 °C. The effluent of the reactor was analysed by gas chromatography with a flame ionization detector (FID). Prior to the catalytic activity measurement, the catalysts were reduced again in situ at a pressure of 0.125 MPa in flowing hydrogen (0.025 mmol/s). The oven was heated to 350°C at a rate of 350°C/h and maintained at this temperature for 3 h. After reduction, the catalysts were cooled in flowing hydrogen to the desired initial reaction temperature of 200 °C. The impregnated alumina foams were tested as synthesised whereas the reference catalyst was crushed and sieved between 250 and 500 µm before measuring its catalytic activity and selectivity. It should be noticed that the catalytic activity of the two impregnated alumina foams F3a and F3b were simultaneously measured in order to use about the same catalyst mass as in samples F1 and F2.
The reaction rates (r) were calculated from chromatographic measurements of C2H6, C2H5Cl and C2H4 concentrations in the reactor effluent and from the differential reactor equation that can be written as follows [13,19]:
where r is the reaction rate (mmol/kg s), FA the molar flowrate of ethane at the reactor outlet (mmol/s), FE the molar flowrate of ethylene at the reactor outlet (mmol/s), FCl the molar flowrate of monochloroethane at the reactor outlet (mmol/s) and W is the catalyst mass inside the reactor (kg). In this study, only C2H6, C2H5 Cl and C2H4 concentrations are used for calculations due to the imprecision of ClCH2-CH2Cl concentration measurements. The selectivity in ethylene is defined as the amount of C2H4 produced compared to the quantities of C2H4, C2H6 and C2H5 Cl produced.
The pressure drop in alumina foam was measured by placing one alumina foam sample in the reactor, sealing the gap between the foam piece and the reactor wall, applying a fluid load and measuring the pressure upstream from the reactor knowing that pressure after the reactor was equal to the atmospheric pressure. No significant pressure drop was detected.
2.5. X-ray microtomography and image analysis
The X-ray tomographic device used in this study is a "Skyscan-1074 X-ray scanner". Advanced technical details about its conception and operation are described by Sasov and Van Dyck [20]. The X-ray source operated at 40 kV and 1 mA. The detector was a 2D, 768 x 576 pixels, 8-bit X-ray camera with a spatial resolution of 41 µ m. The rotation step was fixed at the minimum, 0.9°, in order to improve image quality. The sample was placed into the microtomo-graph and the scanning was performed on a height of 20 mm. Cross-sections separated by 205 µ m were reconstructed using a cone-beam reconstruction software, i.e., 64, 76, 35 and 34 cross-sections for samples F1, F2, F3a and F3b, respectively. X-ray microtomography allows covering a wide range of characteristic scales from tens of microns up to the sample size (10-20 mm).
The two-dimensional (2D) cross-section images given by X-ray microtomography were processed and analysed using the basic tools of mathematical morphology and signal processing [21,22]. Specific image analysis programs were developed using Aphelion3.2f (Adcis SA), and Matlab 6.0 withits image processing toolbox (Matworks). The first step consisted in the binarisa-tion of the 2D cross-sections images using Otsu's method [23]. With this method, the threshold level is chosen automatically so as to maximize the interclass variance and to minimize the intraclass variance of the thresholded black (pores) and white (alumina matrix) pixels. Then, the 3D images were reconstructed by stacking a series of 2D binary cross-sections images separated by 0.41 mm using the 3D visualisation software package provided by Skyscan Basic tools of mathematical morphology were
used to extract quantitative information from the 3D binary images, i.e., the total porosity (ε) and the porosity distribution (δL)· This method is based around a few simple mathematical concepts from set theory and was originally developed by Matheron [24] and Serra [21]. The two most basic operations in mathematical morphology are erosion and dilation. These transformations involve the interaction between an image and a structuring set, called the structuring element. Erosion and dilation can be combined in a variety of ways, in parallel and series, to give other transformations including opening, closing, filling, skeletonisa-tion and many others.
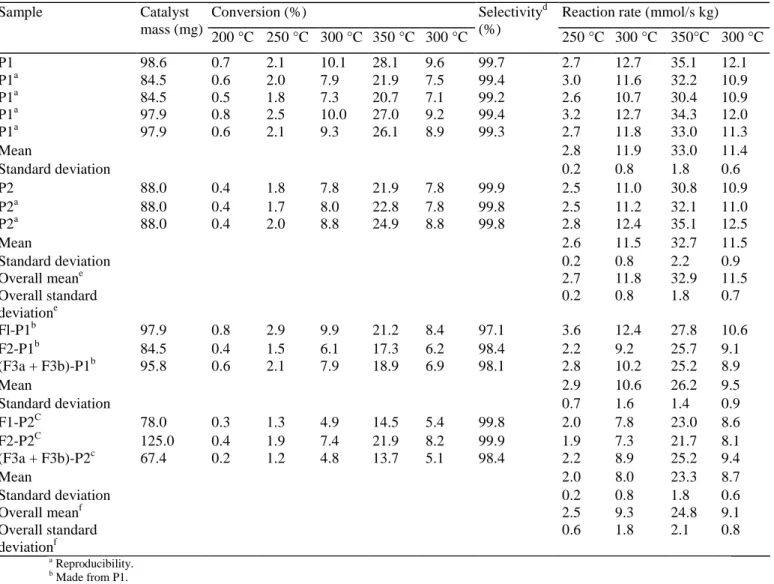
Table 1 - Catalytic activity and selectivity in ethylene of catalyst powders and impregnated alumina foams
Conversion (%) Reaction rate (mmol/s kg)
Sample Catalyst mass (mg) 200 °C 250 °C 300 °C 350 °C 300 °C Selectivityd (%) 250 °C 300 °C 350°C 300 °C P1 98.6 0.7 2.1 10.1 28.1 9.6 99.7 2.7 12.7 35.1 12.1 P1a 84.5 0.6 2.0 7.9 21.9 7.5 99.4 3.0 11.6 32.2 10.9 P1a 84.5 0.5 1.8 7.3 20.7 7.1 99.2 2.6 10.7 30.4 10.9 P1a 97.9 0.8 2.5 10.0 27.0 9.2 99.4 3.2 12.7 34.3 12.0 P1a 97.9 0.6 2.1 9.3 26.1 8.9 99.3 2.7 11.8 33.0 11.3 Mean 2.8 11.9 33.0 11.4 Standard deviation 0.2 0.8 1.8 0.6 P2 88.0 0.4 1.8 7.8 21.9 7.8 99.9 2.5 11.0 30.8 10.9 P2a 88.0 0.4 1.7 8.0 22.8 7.8 99.8 2.5 11.2 32.1 11.0 P2a 88.0 0.4 2.0 8.8 24.9 8.8 99.8 2.8 12.4 35.1 12.5 Mean 2.6 11.5 32.7 11.5 Standard deviation 0.2 0.8 2.2 0.9 Overall meane 2.7 11.8 32.9 11.5 Overall standard deviatione 0.2 0.8 1.8 0.7 Fl-P1b 97.9 0.8 2.9 9.9 21.2 8.4 97.1 3.6 12.4 27.8 10.6 F2-P1b 84.5 0.4 1.5 6.1 17.3 6.2 98.4 2.2 9.2 25.7 9.1 (F3a + F3b)-P1b 95.8 0.6 2.1 7.9 18.9 6.9 98.1 2.8 10.2 25.2 8.9 Mean 2.9 10.6 26.2 9.5 Standard deviation 0.7 1.6 1.4 0.9 F1-P2C 78.0 0.3 1.3 4.9 14.5 5.4 99.8 2.0 7.8 23.0 8.6 F2-P2C 125.0 0.4 1.9 7.4 21.9 8.2 99.9 1.9 7.3 21.7 8.1 (F3a + F3b)-P2c 67.4 0.2 1.2 4.8 13.7 5.1 98.4 2.2 8.9 25.2 9.4 Mean 2.0 8.0 23.3 8.7 Standard deviation 0.2 0.8 1.8 0.6 Overall meanf 2.5 9.3 24.8 9.1 Overall standard deviationf 0.6 1.8 2.1 0.8 a Reproducibility. b Made from P1. c Made from P2. d At 300 °C after 16h.
e P1 and P2 samples taken together. f Fx-P1 and Fx-P2 samples taken together.
The total porosity (ε) and the porosity distribution (δL)were calculated from the 3D images, according to the methodology presented previously [25] :
(i) The total porosity (ε) is defined as:
At the external borders of the foam pieces the discrimination between pixels related to the pores from pixels located outside the foam is difficult. Closing and hole-fill transformations were applied on the original 3D binary image in order to complete the external foam piece surface and to fill the pores.
(ii) The porosity distribution (δL)is defined as the ratio between the number of pixels characteristic of the pores in a layer of one pixel thickness located at a distance, d, of the centre of the foam and the total number of pixels within that specific layer. The n-layer is obtained by eroding the external surface n times, where n = 1, 2, 3,...Each erosion removes a shell of one pixel thickness. The erosion ends when the layer reaches the centre of the foam.
3. RESULTS
Results of catalytic tests of hydrodechlorination of 1,2-dichloroethane into ethylene on reference catalyst powders and on impregnated alumina foams are presented in Table 1. It should be noted that the Pd-Ag/SiO2 xerogel catalyst samples entrapped in a alumina foam will be called 'impregnated alumina foams' in order to simplify the text. The main reaction product is ethylene, C2H4, with a selectivity between 97.1 and 99.9% at 300 °C after 16 h Two secondary products are also observed: ethyl chloride, C2H5Cl, and ethane, C2H6. Ethyl chloride was detected in negligible quantity and only at a temperature of 350 °C. C2H4 selectivity increased very quickly when the temperature increased from 200 to 300 °C as shown in Fig. 2 for F2-P1 sample. In order to compare the activity obtained for each sample, the reaction rates given in Table 1 are related to the catalytic xerogel mass and not to the total impregnated alumina foam mass.
Catalytic test results are surprising at first sight. Indeed non impregnated and impregnated alumina foams possess a high porosity and large pore sizes and forced flow through the foams takes place without measurable pressure drop during permeability tests. A priori identical specific reaction rates could have been expected for reference powders and impregnated alumina foams. A posteriori specific reaction rates linked to the catalytic xerogel mass systematically seem superior for reference catalyst powders than for impregnated alumina foams. A Student's t-test shows that these differences are statistically significant. The catalytic tests have been performed five times on samples of reference powder P1 and three times on samples of reference powder P2. The mean values and standard deviations of specific reaction rates for the reaction of hydrodechlorination of 1,2-dichloroethane are reported in Table 1 for both reference powders P1 and P2. The Student's t-test [26] was used to statistically compare the mean values of specific reaction rates of P1 and P2 reference powders. At 0.05 level of significance (95% confidence interval) the Student's t-test indicates that catalytic tests performed on both reference powders P1 and P2 statistically belong to the same population as all experimental t-values (texp) are inferior to theoretical t-values (t0.025) (Table 2).
Fig. 2. Catalytic activity and selectivity in ethylene of Pd-Ag/SiO2 xerogel catalyst entrapped inside alumina foam F2-P1 for 1,2-dichloroethane hydrodechlorination (Dcea). The dashed line gives the temperature program.
Table 2- Comparison of mean values of the reaction rate of reference powder and impregnated foams using the Student's t-test Comparison texp Population 1 Population 2 250 °C 300 °C 350°C 300 °C t0.025 v P1 P2 1.25 0.57 0.21 0.04 2.45 6 F-Pl F-P2 1.57 2.04 1.85 1.07 2.78 4 P1 F-Pl 0.12 1.39 4.94 3.32 2.45 6 P2 F-P2 3.21 4.56 4.70 3.56 2.78 4 P1 + P2 F-P1 + F-P2 0.85 2.49 5.21 4.02 2.18 12
texp: Value of the calculated Student's t parameter, t0.025: 95% confidence interval, v. degrees of freedom.
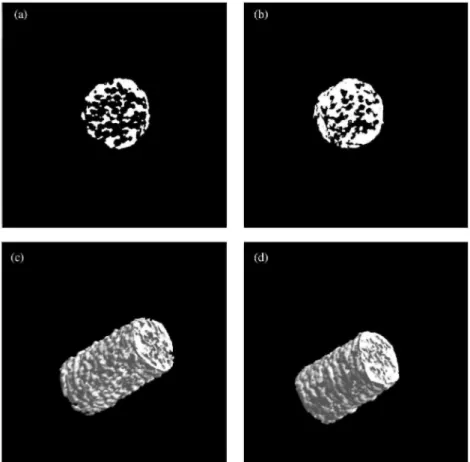
Fig. 3. Microtomographic cross-sections of binary images of free foam F2 (a) and the corresponding binary
images after impregnation F2-P1 (b). 3D image reconstruction of free F2 (c) and impregnated F2-P1 (d) alumina foam. White pixels show the solid phase, i.e., alumina foam and the impregnated catalyst.
Catalytic tests have been performed only once on each impregnated alumina foam. Mean values and standard deviations are reported in Table 1 for the whole series of impregnated alumina foams containing P1 reference powder (F-P1) on one hand and for the whole series of impregnated alumina foams containing P2 (F-P2) on the other hand. The Student's t-test was again used to statistically compare the mean values of specific reaction rates of F-Pl and F-P2. At 0.05 level of significance the Student's t-test indicates that catalytic tests performed on both series F-P1 and F-P2 statistically belong to the same population as all experimental t-values (texp) are inferior to theoretical t-values (t0.025) (Table 2). Moreover it should be noted that the standard deviations of the four populations, viz. P1, P2, F-Pl and F-P2, are statistically identical as can be shown by an F-test [26]. It can be concluded that (i) the deviations on the reaction rate determination are larger than those due to catalyst synthesis and (ii) the deviations of reaction rates observed on the three alumina foams cannot be attributed to the texture differences of the three alumina foams or to the difference of activity of the two reference catalyst powders but simply to the error on the determination of the reaction rate. That is why it is logical to regroup in one population all tests made on alumina foams as the deviations are principally due to the reaction rate measurement and not to the texture.
However, a Student's t-test indicates that at 0.05 level of significance the specific reaction rates measured, respectively, on impregnated alumina foams and reference powders do not belong to the same population. Indeed, at 300 and 350°C, t experimental values (texp) are largely superior to theoretical t-values (t0.025) (Table 2). This is true whether reference powder P1 is compared to the corresponding impregnated alumina foam F-Pl, reference powder P2 is compared to the corresponding alumina foams F-P2 or the reference powder set P1 +P2 is compared to the set of impregnated alumina foams F-P1 +F-P2 (Table 2). Consequently apparent specific rates measured on impregnated alumina foams are statistically inferior to apparent specific rates measured on reference powders.
Four alumina foams containing Pd-Ag/SiO2 xerogel catalysts (F1-P1, F2-P1, F3a-P1, F3b-P1) were characterized by X-ray microtomography coupled with image analysis techniques. The study was performed before and after deposition of Pd-Ag/SiO2 xerogel catalyst. Fig. 4 shows, as an example, microtomographic cross-sections (binary images) of the alumina foam F2-P1 before (Fig. 3a) and after impregnation, drying and calcination (Fig. 3b). A simple visual inspection of those images indicates that the impregnated foam is less porous than the original support. The 3D images were reconstructed from the 2D binary cross-section images for the free and impregnated foams (Fig. 3 c and d).
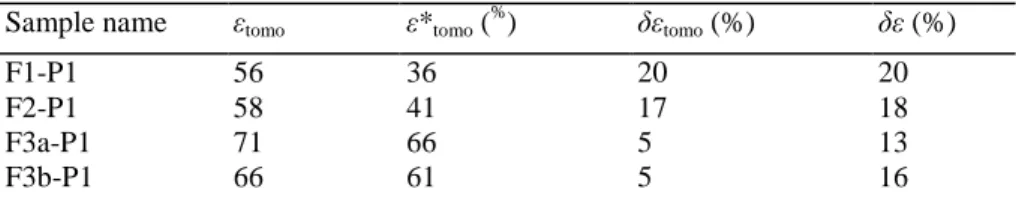
Table 3- Porosity for the free alumina foams and the impregnated alumina foams
Sample name εtomo ε*tomo (
% ) δεtomo (%) δε (%) F1-P1 56 36 20 20 F2-P1 58 41 17 18 F3a-P1 71 66 5 13 F3b-P1 66 61 5 16
εtomo and ε*tomo are, respectively, the porosity of the free support and the impregnated alumina foams measured by X-ray tomography, δεtomo
and δε are the volumetric fraction of the Pd-Ag/SiO2 xerogel catalyst which is entrapped inside the alumina foam, δεtomo is calculated from
tomographic data while δε is calculated from mass and volume measurements.
The overall porosity, measured by image analysis from Eq. (2), of the free alumina foams (εtomo) is close to 60% (samples F1-P1 and F2-P1) and 70% (samples F3a-P1 and F3b-P1) (Table 3). These values are lower than the values of the porosity measured from the volume and mass of the foams (reference values) (Table 4) determined, respectively, from dimension measurements by slide calliper and foam weight measurement. There is no internal porosity in the foam cylinder as the skeletal density measured by helium pycnometry is equal to the reference value for α-alumina [17]. The lower porosity observed is due to the definition of the external border of the alumina foam cylinders. The external border was defined by a close and filling operation made on the binary pictures. The porosity of the alumina foams was also calculated using another definition of the external border: the external border is defined as the smallest cylinder that fully includes the foams. In this case, the overall porosity increased but did not reach the reference values. The porosity of the impregnated alumina foams decreases after impregnation, drying and calcination, the decrease is about equal to 20% (samples Fl-Pl and F2-P1), these values are close to the porosity decrease obtained from mass and volume measurement (Table 3). However, the porosity decrease of samples F3a-P1 and F3b-Pl is low (5%) compared to ca. 15% from mass and volume measurement.
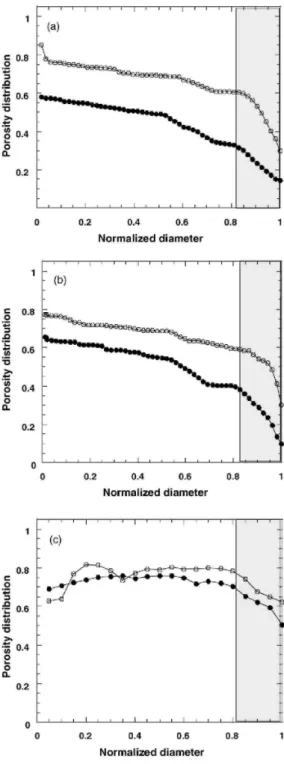
The porosity distribution characterizes the pore distribution of the free foams and the modifications induced by impregnation, drying and calcination. Results are presented as a function of the normalized diameter, the normalized diameter is equal to one at the foam's border and equal to zero at the foam's centre. The following trends were observed (Fig. 4a-c): (i) it seems that the porosity decreases at the external border of the foams. It should be noticed that this phenomenon is due to the difficulty to define the external border of highly porous solids. Indeed, the definition of the border neglects the porosity at the border. Calculations were also made using the smaller external cylinder as external border. In this case, the porosity increased at the foam border. Furthermore there is also some problem of resolution of the X-ray microtomography at the border of the samples. Consequently, the pore density distribution, whose characteristic diameter is larger than 0.8, is dashed and not considered for discussion, (ii) curves corresponding to the impregnated samples are shifted lower down, i.e., towards a lower porosity, (iii) the free and impregnated curves have almost the same shape which means that impregnation decreases the porosity homogeneously inside the support. In other words, the xerogel catalyst fills the support homogeneously and (iv) the largest downward shift corresponds to F1-P1 and the lowest shift corresponds to F3a-P1. The lower shift in F3a-P1 could, in part, be explained by the lower catalyst content of this sample compared to F1-P1.
Table 4- Characteristics of the alumina foams
Sample name h (mm) df (mm) m(g) mcata (g) L(m) ε (%) ε* (%)
F1-P1 29.5 9.3 0.98553 0.0979 0.002 88 68
F2-P1 30.3 9.4 1.01664 0.0845 0.002 88 72
F3a-P1 20.0 9.2 0.49730 0.0415 0.002 91 78
F3b-P1 20.5 9.1 0.56085 0.0543 89 73
h: Al2O3 foam height (m), df. Al2O3 foam diameter (m), m: free Al2O3 foam mass (g), mcata : mass of catalyst after alumina foam
impregnation (g). L: Characteristic length, which is defined as the ratio between the volume and the external surface of the foam (m), ε: open porosity of the alumina foams before impregnation calculated from the volume and mass of the free alumina foams (%), ε*: open porosity of the impregnated alumina foam assuming that the xerogel is not porous (%).
Fig. 4. Porosity distribution for free and impregnated alumina foams for F1 and F1-P1 (a), F2 and F2-P1 (b)
4. DISCUSSION
The decrease of catalytic activity observed in alumina foams compared to reference material cannot be explained by strong interactions between the Pd-Ag/SiO2 catalyst xerogel and the alumina support or by poisoning of the catalyst xerogel by alu-minate ions during contact between the support and the silica sol before gelation as the alumina used is α-alumina which is very stable. This aluminate contamination was observed in preliminary trials of catalyst shaping by extrusion made with mixtures of γ-alumina and Pd-Ag/SiO2 xerogel catalyst and led to important modifications of the activity and especially of the selectivity with a high production of ethyl chloride. No such ethyl chloride production was observed with impregnated alumina foams. More the specific surface area of alumina foams is so small (0.5 m2/g) that strong interactions between alumina and the catalyst xerogel seem improbable.
The decrease of apparent catalytic activity could be linked to the size of the impregnated alumina foams and consequently to diffusion limitations. Diffusion limitations can be studied via the estimation of the Weisz modulus (Φ) of the impregnated alumina foams and the catalyst powder entrapped inside. The Weisz modulus (Φ) is defined as [27-31]:
where r is the observed reaction rate (mmol/s kg), p the bulk density (m3/kg), L the characteristic length (m) which is defined as the ratio between the volume and the external surface of the element, Cs the Dcea (1,2-dichloroethane) concentration (mmol/m3) and De is the effective diffusivity (m
2 /s).
It has been shown [27] that if Φ << 1, there are no pore diffusion limitations and the observed reaction rate r is equal to the intrinsic rate of the chemical reaction and that if Φ ≥ 1, the observed rate r does not correspond to the intrinsic reaction rate due to diffusion falsifications. A first order reaction related to Dcea has been assumed [19] and the hydrodechlo-rination of Dcea can be assumed isothermal because the reac-tants are diluted in helium and the enthalpy of reaction of the hydrodechlorination of Dcea into ethylene is low (~ -7 kJ/mol). Furthermore, the temperature of the catalyst powder inside the reactor and the oven temperature were both measured and were identical throughout the reaction.
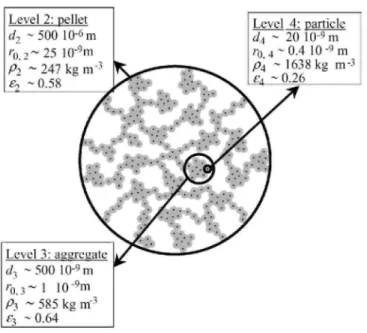
Fig. 5. Scheme of the cogelled xerogel catalyst and morphological properties at each level: diameter d, pore
radius r0, bulk density ρ and void fraction ε.
Alumina foams impregnated with Pd-Ag/SiO2 catalyst syn-thesised by sol-gel process cannot be assumed to be homogeneous at all scales. As shown by Heinrichs et al. [32] the xerogel catalyst is composed of accessible Pd-Ag alloy crystallites whose diameter is about equal to 2-3 nm. The alloy crystallites are located inside microporous silica particles whose diameters are between 10 and 20 nm. The continuous meso- and macropore
distribution of the catalysts is located in voids between particles and between aggregates constituted of those particles. Silica particles are thus basic blocks which constitute aggregates which themselves constitute the catalyst pellet entrapped inside the alumina foam. Unlike the classical approach in diffusion calculation which assumes that the catalyst is a pseudo-homogeneous medium, the impregnated alumina foams must be examined at four discrete levels (Fig. 5) : the impregnated alumina foam (level 1), the silica pellets entrapped inside the foam (level 2), the silica aggregates (level 3) and the elementary microporous silica particles containing the Pd-Ag alloy crystallite (level 4). Each level is assumed to be a pseudo-homogeneous medium with its own size, bulk density, void fraction, tortuosity, and single pore width. At level 1 (alumina foam), only diffusion of molecules between the external surface of the alumina foam cylinder and the external surface of the xerogel pellets, i.e., diffusion in alumina foam pores between the xerogel pellets, is considered. Conclusions that were drawn from the characterisation by microtomography of the free and impregnated samples is that the Pd-Ag/SiO2 xerogel is uniformly dispersed inside the alumina foams. Consequently, the level 1 can be assumed homogeneous and the Weisz modulus can be calculated for this level. At level 2 (pellets), only diffusion of molecules between the external surface of the xerogel pellet and the external surface of the aggregates of silica particles, i.e., diffusion in large pores between aggregates, is considered. At level 3 (aggregates), only diffusion of molecules between the external surface of the aggregate and the external surface of the silica particles is considered. At level 4 (particles), only diffusion of molecules between the external surface of the elementary silica particle and the active Pd-Ag alloy crystallite is considered.
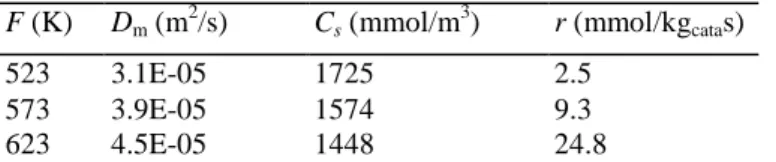
Table 5 - Values of experimental variables
F (K) Dm (m2/s) Cs (mmol/m3) r (mmol/kgcatas)
523 3.1E-05 1725 2.5
573 3.9E-05 1574 9.3
623 4.5E-05 1448 24.8
Dm: Molecular diffusivity of 1,2-dichloroethane, Cs: molar concentration of Dcea at the reactor entrance, r: reaction rate as a function of
Pd-Ag/SiO2 catalyst mass.
Since each level is assimilated to a pseudo-homogeneous medium with its own morphological properties (its own characteristic size Li (m), bulk density ρi (kg/m
3
), void fraction εi, and single pore radius r0,i (m)), each level is characterized by its own Weisz modulus. Using the Bosanquet formula which describes the way to combine molecular and Knudsen diffusiv-ities [29,31,33], the Knudsen diffusivity equation [27,33] and the approximation according to which the tortuosity factor is inversely proportional to the void fraction [27,31] the effective diffusivity can be developed and Eq. (3) is then written:
where the subscript i refers to the level i = 1, impregnated alumina foam; i = 2, silica pellet, i = 3, silica aggregate; i = 4, silica particle). M is the molecular mass of 1,2 dichloroethane (Dcea) = 98.96 x 10⁻⁶ kg/mmol, Dm the molecular diffusivity (m2/s) and T is the temperature (K). Geometrical properties of the foams are given in Table 4. The value of Dcea concentrations, diffusion coefficients and reaction rates are given in Table 5.
The void fraction εi, Eq. (4), corresponding to the ith level includes only pores characteristic of that level. In other words, the void fraction εi of a level i is calculated assuming that the following levels are non porous. The bulk density ρi corresponding to the ith level is calculated using the following equation:
where ρtrue is the true density of the material, i.e., the density of the solid skeleton or the density excluding pores. Vi is the volume occupied by all the pores located inside the level i. The true density of the Pd-Ag xerogel catalyst is ρtrue = 2.22 x 10
-3
kg/m3 [12]. The true density of the alumina foams is ρtrue = 3.94 x 10 -3
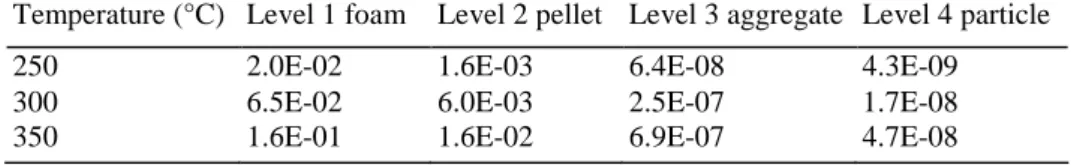
kg/m3. The Weisz moduli calculated from Eq. (4) for sample F1-P2 are given in Table 6. The diameter, the single pore radius, the bulk density and the porosity at levels 2, 3 and 4 are given in Fig. 5. Low values obtained for Φ2, Φ3 and Φ4 indicate that no diffusion limitation exists for the diffusion of 1,2-dichlorethane through the pores from
the surface of the silica pellet to the surface of aggregates then to the surface of silica particles and inside the silica particles. The structure of the catalyst silica pellets studied here (level 2, 3 and 4) is such that, in order to reach the active sites, reactants (1,2-dichloroethane in the present case) must diffuse in pores of decreasing width (making mass transfer more difficult) located in entities of decreasing size (making mass transfer easier), increasing bulk density and decreasing void fraction (making mass transfer more difficult). Taken as a whole these antagonistic effects lead to very small values of the Weisz modulus, which indicates that a catalyst with such a "funnel" structure exhibits very good mass-transfer properties [32]. However, the value obtained for Φ1 (0.16) at 350 °C for example, with L1 = 0.002 m, ε1 =0.68 and ρ1 =541 kg/m3, is close to one. The characteristic length is the same for all three alumina foams as they have approximately the same diameter and height. For Weisz modulus equal to ~0.1, the effectiveness factor (η) begins to decrease. It means that diffusion limitations probably occur at level 1, i.e., inside alumina foam. Similar activity decreases due to diffusion limitations can be found in the literature [2,3]. The pore size distribution was calculated by image analysis for all three alumina foams [25]. The distribution maximum corresponds to a pore size around 0.15 mm and almost the entire distribution corresponds to pore sizes inferior to 0.4 mm. In practice, with a pore radius r0,1 larger than 0.05 mm, molecular diffusion is always predominating compared to Knudsen diffusion and the Weisz modulus Φ1 is, in practice, independent of the alumina foam pore size. During drying of the catalyst gel, the specific bulk volume decreases by 80% and the diameter of the silica agglomerates, i.e., the silicapellets entrapped inside the foam (level 2) is divided by two. The result of this is that no foam cells can be occluded by the dried gel and the adhesion of the dried gel to the support is weak. Heinrichs et al. [32] have determined that diffusional limitations in the agglomerates - or pellets - of Pd-Ag/SiO2 catalysts should probably appear for spherical pellets of 10 mm in diameter for the reaction of hydrodechlori-nation of 1,2-dichloroethane. This enables to conclude that no diffusional limitations can occur at level 2 corresponding to the catalyst pellets as these have a size of around 0.2 mm but that diffusional limitations can appear at level 1 corresponding to the alumina foam as their diameter is around 9 mm. The pellets are uniformly distributed in the alumina foam porosity as shown on Fig. 4. This totally justifies the model with four levels chosen to calculate the diffusional limitations. If one refers to diagrams representing the concentration profile in cylindrical foams as a function of the Thiele modulus [27,31] the concentration of 1,2-dichloroethane at the centre of the foam does not fall below 60% of the foam external surface concentration. This means that using Cs,1 = Cs,2 = Cs,3 = Cs,4 in all cases for the calculation of Φ2, Φ3 and Φ4 does not modify their order of magnitude. The same surface concentration value was thus considered for the catalyst pellet, the aggregate and the elementary silica particle levels. Nevertheless the activity decrease of Pd-Ag/SiO2 catalysts entrapped inside foams compared to catalyst powders cannot entirely be explained by diffusion limitations at the foam level as some activity decrease is also observed at 250 and 300 °C where no diffusion limitations are present.
Table 6- Weisz modulus values of the impregnated alumina foam F1-P2 at the four levels
Temperature (°C) Level 1 foam Level 2 pellet Level 3 aggregate Level 4 particle
250 2.0E-02 1.6E-03 6.4E-08 4.3E-09
300 6.5E-02 6.0E-03 2.5E-07 1.7E-08
350 1.6E-01 1.6E-02 6.9E-07 4.7E-08
5. CONCLUSIONS
Catalyst xerogels prepared by sol-gel process in one step can be impregnated in cylindrical porous alumina foams of high porosity.
X-ray microtomography measurements coupled with image analysis show that the catalyst xerogel distribution inside the porous texture of the alumina foams after gel drying and calcinations is uniform.
Catalytic tests of selective hydrodechlorination of 1,2-dichloroethane into ethylene realised on Pd-Ag/SiO2 catalyst xerogel containing 1.5 wt.% Pd with atomic composition 33% Pd-67% Ag show that apparent reaction rate of catalyst impregnated on alumina foams is statistically slightly lower than that of free catalyst powder. The apparent activity decrease can be attributed to diffusion limitations. Indeed the Weisz modulus calculated at the scale of the alumina foam cylinder is superior to 0.1, which leads to an effectiveness factor inferior to 1.
Porous alumina foams of good mechanical resistance with cylindrical shape are an interesting possibility to use catalyst xerogels prepared by one step sol-gel process in an industrial reactor. In order to have a really operational system the cohesion between alumina foam and catalyst xerogel has to be improved on one hand and
on the other hand, it must be avoided to run the catalytic reactions in diffusional operating conditions.
Acknowledgments
C. Alié, A. Léonard and S. Lambert are grateful to the Belgian Fonds National de la Recherche Scientifique (FNRS) for a position of Postdoctoral Researcher. The authors also thank the Belgian Fonds National de la Recherche Scientifique (FRFC convention no. 2.4523.01), the Région Wallonne-Direction Générale des Technologies, de la Recherche et de l'Energie (Project Gredecat: convention no. 14573 and Programme de formation et d'impulsion à la recherche scientifique et technologique), the Ministère de la Communauté française—Direction de la Recherche scientifique (ARC no. 00/05-265) and the Fonds de Bay for their financial support. The authors also acknowledge the involvement of their laboratory in the network of excellence FAME of the European Union sixth framework program.
References
[1] J.F. Le Page, in: G. Ertl, H. Knözinger, J. Weitkamp (Eds.), Handbook of Heterogeneous Catalysis, vol. 1, Wiley-VCH, Weinheim, Germany, 1997, p. 412.
[2] F.C. Patcas, J. Catal. 231 (2005) 194.
[3] J.T. Richardson, M. Garrait, J.K. Hung, Appl. Catal. A 255 (2003) 69. [4] J.J. Krummenacher, L.D. Schmidt, J. Catal. 222 (2004) 429.
[5] A. Kozlov, E. Loukine, I. Safonov, Наyка и Teчhологии вПромышлehhоctи 2 (2002) 64. [6] T.N. Kalnes, R.B. James, Environ. Prog. 7 (1988) 25.
[7] P. Delhez, B. Heinrichs, J.P Pirard, J.P Schoebrechts, European Patent EP 0,745,426 Al (1996), US Patent 6,072,096 (2000). [8] B. Breitscheidel, J. Zieder, U. Schubert, Chem. Mater. 3 (1991) 559.
[9] A. Kaiser, C. Görsmann, U. Schubert, J. Sol-Gel Sci. Technol. 8 (1997) 795.
[10] B. Heinrichs, J.P. Pirard, R. Pirard, US Patent 5,538,931 (1996), European Patent EP 0,629,442 B1 (1998). [11] B. Heinrichs, F. Noville, J.P. Pirard, J. Catal. 170 (1997) 366.
[12] B. Heinrichs, P. Delhez, J.P. Schoebrechts, J.P. Pirard, J. Catal. 172 (1997) 322. [13] S. Lambert, C. Cellier, P. Grange, J.P. Pirard, B. Heinrichs, J. Catal. 221 (2004) 335. [14] S. Lambert, F. Ferauche, A. Brasseur, J.P. Pirard, B. Heinrichs, Catal. Today 100 (2005) 283. [15] A. Léonard, S. Blacher, P. Marchot, M. Crine, Drying Tech. 20 (2002) 1053.
[16] S. Blacher, V. Maquet, A. Léonard, G. Chapelle, M. Crine, R. Jérôme, J.P. Pirard, in: Rodriguez-Reinoso, B. McEnaney, J. Rouquerol, K. Unger (Eds.), Characterization of Porous Solids VI, Elsevier, Amsterdam, 2002, p. 331.
[17] Handbook of Chemistry and Physics, 57th ed. 1976-1977, CRC Press, Cleveland, OH, B-86. [18] C. Alié, R. Pirard, A.J. Lecloux, J.P. Pirard, J. Non-Cryst. Solids 246 (1999) 216.
[19] B. Heinrichs, J.-P Schoebrechts, J.P. Pirard, J. Catal. 200 (2001) 309-320. [20] A. Sasov, D. Van Dyck, J. Microsc. 191 (1998) 151.
[21] J. Serra, Image Analysis and Mathematical Morphology, vol. 1, Academic Press, New York, 1982. [22] M. Coster, J.L. Chermant, Précis d'analyse d'images, CNRS, Paris, 1985.
[24] G. Matheron, Random Sets and Integral Geometry, Wiley, New York, 1975.
[25] S. Blacher, A. Léonard, B. Heinrichs, N. Tcherkassova, F. Ferauche, M. Crine, P. Marchot, E. Loukine, J.P. Pirard, Colloids Surf. A 241 (2004) 201.
[26] D.C. Montgomery, Design and Analysis of Experiments, fifth éd., Wiley, New York, 2001. [27] C.N. Satterfield, Mass Transfer in Heterogeneous Catalysis, MIT Press, Cambridge, 1970.
[28] J.J. Carberry, in: J.R. Anderson, M. Boudart (Eds.), Physico-chemical Aspects of Mass and Heat Transfer in Heterogeneous Catalysis, Catalysis: Science and Technology, vol. 8, Springer, Berlin, 1987, p. 131.
[29] J. Villermaux, Génie de la réaction chimique—conception et fonctionnement des réacteurs, Lavoisier, Paris, 1993.
[30] G. Emig, R. Dittmeyer, in: G. Ertl, H. Knözinger, J. Weitkamp (Eds.), Handbook of Heterogeneous Catalysis, vol. 3, Wiley-VCH, Weinheim, Germany, 1997, p. 1209.
[31] G.F. Froment, K.B. Bischoff, Chemical Reactor Analysis and Design, second éd., Wiley, New York, 1990. [32] B. Heinrichs, J.P. Schoebrechts, J.P. Pirard, AIChE J. 47 (2001) 1866.
[33] F. Kapteijn, J.A. Moulijn, in: G. Ertl, H. Knözinger, J. Weitkamp (Eds.), Handbook of Heterogeneous Catalysis, vol. 3, Wiley-VCH, Weinheim, Germany, 1997, p. 1359.