HAL Id: hal-01065121
https://hal.archives-ouvertes.fr/hal-01065121
Submitted on 17 Sep 2014
HAL is a multi-disciplinary open access
archive for the deposit and dissemination of sci-entific research documents, whether they are pub-lished or not. The documents may come from teaching and research institutions in France or abroad, or from public or private research centers.
L’archive ouverte pluridisciplinaire HAL, est destinée au dépôt et à la diffusion de documents scientifiques de niveau recherche, publiés ou non, émanant des établissements d’enseignement et de recherche français ou étrangers, des laboratoires publics ou privés.
Multimodal Mn-doped I-III-VI quantum dots for near
infrared fluorescence and magnetic resonance imaging:
from synthesis to in vivo application.
Gary Sitbon, Sophie Bouccara, Mariana Tasso, Aurélie François, Lina
Bezdetnaya, Frédéric Marchal, Marine Beaumont, Thomas Pons
To cite this version:
Gary Sitbon, Sophie Bouccara, Mariana Tasso, Aurélie François, Lina Bezdetnaya, et al.. Multimodal Mn-doped I-III-VI quantum dots for near infrared fluorescence and magnetic resonance imaging: from synthesis to in vivo application.. Nanoscale, Royal Society of Chemistry, 2014, 6 (15), pp.9264-9272. �10.1039/c4nr02239d�. �hal-01065121�
This paper is originally published with the following reference : Nanoscale. , 6 : 9264 – 9272 (2014). DOI: 10.1039/c4nr02239d
Multimodal Mn-doped I-III-VI quantum dots for near infrared
fluorescence and magnetic resonance imaging: from synthesis to
in vivo application
Gary Sitbon,a,b,c Sophie Bouccara,a,b,c Mariana Tasso,a,b,c Aurélie Francois,d Lina Bezdetnaya,d Frédéric Marchal,d Marine Beaumonte and Thomas Ponsa,b,c,*
a LPEM, PSL Research University, ESPCI-ParisTech, 10 rue Vauquelin, F-75231 Paris Cedex 5, France
b CNRS, UMR 8213, F-75005 Paris, France
c Sorbonne Universités, UPMC Univ Paris 06, F-75005 Paris, France
d Centre de Recherche en Automatique de Nancy (CRAN), ICL, Université de Lorraine, UMR 7039, Campus Sciences, BP 70239, 54506 Vandoeuvre-lès-Nancy Cedex, France e CIC-IT de Nancy, CHU de Nancy, Hôpitaux de Brabois, rue du Morvan, 54511 Vandoeuvre-lès-Nancy, France
*thomas.pons@espci.fr
ABSTRACT
The development of sensitive multimodal contrast agents is a key issue to provide better global, multi-scale images for diagnostic or therapeutic purposes. Here we present the synthesis of Zn-Cu-In-(S,Se)/Zn1-xMnxS core/shell quantum dots (QDs) that can be used as
markers for both near-infrared fluorescence imaging and magnetic resonance imaging (MRI). We first present the synthesis of Zn-Cu-In-(S,Se) cores coated with a thick ZnS shell doped with various proportions of Mn. Their emission wavelengths can be tuned over the NIR optical window suitable for deep tissue imaging. The incorporation of manganese ions (up to a few thousand ions per QD) confers them a paramagnetic character, as demonstrated by structural analysis and electron paramagnetic resonance spectroscopy. These QDs maintain their optical properties after transfer to water using ligand exchange. They exhibit T1-relaxivities up to 1400 mM-1[QD].s-1 at 7T and 300K. We finally show that these QDs are suitable multimodal in vivo probes and demonstrate MRI and NIR fluorescence detection of regional lymph nodes in mice.
INTRODUCTION
Noninvasive molecular imaging is being increasingly used both as a scientific tool to study biological processes in living organisms and as a diagnostic tool to provide clinicians with an otherwise inaccessible image of a specific marker distribution.1–3 Each imaging modality presents complementary advantages in terms of sensitivity, spatial resolution, imaging depth and ease of use.4,5
Near infrared fluorescence imaging (NIRFI), in particular, is attracting increasing attention due to its high sensitivity, low cost, non-invasiveness and easy implementation. It is however limited to near surface tissues, since its imaging depth does not exceed a few centimeters. Its spatial resolution varies from the micrometer scale using microscopy on cell samples to centimeters in thick tissues, due to light diffusion. Magnetic resonance imaging (MRI), on the other hand, provides whole body images with a homogeneous millimeter-resolution, albeit with a lower sensitivity. Nanotechnology offers the potential to design probes that offer contrast in both imaging modalities and combine the best of each, therefore providing a more comprehensive picture of the biological markers of interest. In particular, fluorescent semiconductor quantum dots (QDs) represent an attractive platform to integrate different contrast agents.
During the past decade, visible emitting QDs have increasingly been used for cellular imaging due to their unique optical properties such as their high brightness, photo-stability and multiplexing capabilities. They have for example enabled long term tracking of single molecules or simultaneous labeling of many different biomolecular targets.6,7 QDs are also being increasingly used for in vivo imaging to improve detection sensitivities.8,9 For in vivo applications, however, QDs should emit in the NIR range, typically between 700 nm and 1000 nm, in order to minimize light absorption and diffusion and therefore maximize imaging depth.10 While no signs of acute toxicity have been observed after the injection of large doses of Cd-based QDs,11 safer, heavy-metal free QDs have been developed in order to minimize toxicity. Recently developed silicon-based QDs,12,13 as well as QDs based on I-III-VI2
materials such as CuInS2 or CuInSe214–17 provide attractive fluorescent probes for biomedical
applications due to their low toxicity and high detection sensitivities.
Several strategies have been used to bring together fluorescence and MR contrast into one nanoprobe using I-III-VI QDs. For example, Hsu et al. incorporated CuInS2/ZnS QDs and
superparamagnetic iron oxide nanoparticles in silica beads.18 However, the resulting size is much larger than the original nanoparticles, which may hinder access to confined spaces. In order to obtain more compact nanoprobes, Cheng et al. have encapsulated CuInS2/ZnS QDs in
an amphiphilic polymer, to which they coupled Gd3+-chelates.19 In addition to the relatively low number of Gd conjugated per QD, leading to a small relaxivity per QD, this strategy may suffer from the weak non-covalent link between the QD and the paramagnetic ion. Indeed, the QD organic surface chemistry may easily detach with time from the QD surface due to its interaction with the complex in vivo environment, as has been shown for example for micelle encapsulated QDs.20 Even relatively strong dithiol-containing ligands have been shown to exhibit a fast desorption rate from the QD surface, on the order of 1 h-1.21 The dissociation
between the fluorescent QDs and the magnetic species linked to the surface ligands therefore represents a strong limitation to the use of this type of multimodal probe for in vivo imaging. We have therefore chosen to directly incorporate the paramagnetic ion into the QD inorganic shell to ensure that at all times the fluorescent and magnetic species remain colocalized. Doping of QDs with Mn2+ ions has been reported earlier in II-VI QDs.22 Wang et al. demonstrated the use of Mn-doped CdSe/ZnS QDs for in vitro fluorescence and MR imaging of macrophages.23 More recently, several groups reported the synthesis of Mn-doped CuInS2
or AgInS2 QDs.24–26 However, none of these QDs emit in the NIR. In addition, they were only
able to incorporate a small number of Mn per QD, leading to a low MR sensitivity. These two limitations precluded their use for in vivo imaging. Here we report the synthesis and characterization of Zn-Cu-In-(S,Se)/Zn1-xMnxS QDs designed for in vivo imaging: the
emission of these QDs is tunable in the NIR range for optimal fluorescence imaging and they contain up to 3000 Mn atoms. This very high Mn loading leads to relaxivities in the µM(QD)
-1
.s-1 range and allows QD-based multimodal in vivo imaging. As an illustration, we demonstrate in vivo MRI and fluorescence detection of regional lymph nodes in mice.
MATERIALS AND METHODS
Chemicals.
All chemicals were purchased from Sigma-Aldrich and used as received without further purification. Zinc ethyl xanthogenate (Zn(EtX)2) and zinc oleate (Zn(OA)2) were prepared
from zinc nitrate, potassium ethylxanthogenate and sodium oleate according to previously reported methods16.HeLa cells were obtained from ATCC and cultured using supplemented DMEM medium (DMEM, high glucose, GlutaMAX, pyruvate, 10 vol% FBS, 1 vol% penicillin-streptomycin) from Gibco.
Synthetic procedures
Synthesis of Zn-Cu-In-S cores. In a typical synthesis of Zn-Cu-In-S cores, 1 mmol of copper
(I) iodide (190 mg), 1 mmol of indium acetate (291 mg) and 0.1 mmol of zinc acetate (Zn(OAc)2, 18 mg) were introduced in a three-neck flask with 5ml of dodecanethiol (DDT)
and degassed under vacuum at 40°C for 30 min. The yellow turbid suspension was then placed under argon flow and heated to 120°C for 10 min. The resulting clear yellow solution was subsequently further heated to 220°C. After approximately 15 minutes, the mixture was quickly cooled to room temperature. The obtained 780 nm-emitting Zn-Cu-In-S cores were then collected by precipitation with ethanol (EtOH) and washed three times by successive redispersion and precipitation in hexane/EtOH. The final precipitate was redispersed in 10 ml of hexane.
Synthesis of Zn-Cu-In-Se cores. In a typical synthesis of Zn-Cu-In-Se cores, 1 mmol of
CuCl (99 mg), 1 mmol of InCl3 (221 mg), 2 mmol of Zn(OAc)2 (367 mg) and 2 mmol of
selenourea (246 mg) were introduced in a 100 ml three neck flask with 10 ml of trioctylphosphine and 25 ml of octadecene (ODE). After sonicating the suspension for a few minutes, we added 5ml of DDT and 10 ml of oleylamine (OAm). The resulting pink solution
is degassed for 30 minutes at 40°C. The solution is then heated at 230°C and turned from pink to black. After 80 minutes of heating, 800 nm-emitting Zn-Cu-In-Se cores were obtained and purified as described above. The final black precipitate was redispersed in 10 ml of hexane.
Growth of a MnxZn1-xS shell. We used a dropwise injection for the growth of a MnxZn1-xS
shell on Zn-Cu-In-E (E = S or Se) cores. The first solution (solution 1) was composed of 2.5 mmol of Zn(EtX)2 (768 mg), 3 ml of OAm and 7 ml of ODE. It resulted in a white turbid
solution. The second solution (solution 2) is prepared in a 100ml three neck flask. We introduced 2,5-x mmol de Zn(OA)2, 2 ml OLA and 8 ml ODE. The solution was degassed
under vacuum at 120°C for 10 minutes. After the solution was cooled to room temperature, we introduced x mmol of manganese (II) acetate and the solution was then degassed again under vacuum at 120°C for 10 minutes. The orange solution is kept under argon prior to the injection.
In a 100 ml three neck flask, we mixed 1ml of core QD solution prepared as mentioned above and 10 ml of ODE. The solution was degassed under vacuum at 50°C for 40 minutes and then heated at 200°C under argon. Solution 1 and solution 2 were then injected simultaneously in 2 hours. After cooling at room temperature, QDs were purified as described above and redispersed in 10 ml of hexane.
Water solubilization. QDs can be transferred in water by cap exchange with polyethylene
glycol (PEG) modified-dihydrolipoic acids (DHLA-PEG) prepared according to a literature method with commercially available Jeffamine M-1000 polyetheramine (Huntsman).27 A two-step surface modification was first performed to facilitate the subsequent water solubilisation. For that, 1 ml of QD solution was precipitated with ethanol and resuspended in chloroform. They were left overnight at 60°C in the presence of 200 µL OAm. QDs were then precipitated with acetone and redispersed in chloroform. We then added 100 mg Zn(OA)2 and the solution
was heated to 60°C for 2 hours. After precipitation with acetone to remove excess ligands and redispersion in chloroform, cap exchange and purification were done as reported before.15
Characterization
Optical characterization Absorption spectra were performed using a UV-Visible Varian
Cary-5E spectrometer. Photoluminescence excitation spectra were performed using a Horiba Jobin Yvon Fluoromax-3 spectrofluorometer. Photoluminescence spectra and fluorescence lifetime measurements were performed using an Edinburgh Instruments FSP920 spectrofluorometer. The excitation source was either an Edinburgh Instruments EPL375 laser diode with an emission wavelength at 376 nm or a xenon 450 W arc lamp. The detector used for the experiments was a Hamamatsu R2658P side window photomultiplier. Photoluminescence quantum yields (QY) were measured using zinc phtalocyanine as reference, according to a previously reported method.15
Structural characterization TEM/HRTEM images were acquired using a JEOL 2010 TEM
equipped with a Gatan camera. XRD powder diffraction patterns were acquired using a Philips X’Pert diffractometer with a Cu Kα source. We determined the size of crystalline
where K is a dimensionless shape factor (a typical value of 0.9 for spherical objects was used as a first approximation), β is the FWHM of the peak (in radians) and θ is the Bragg angle of the corresponding peak.
EPR measurements were performed using a Bruker EMX spectrometer operating at X band frequency (9.7GHz).
Elemental analysis was performed by energy-dispersive X-ray spectroscopy (EDX) on a Hitachi S-3600N scanning electron microscope operated at 15 keV. ICP-AES analyses were performed by Repsem analytical platform in Strasbourg. Samples are prepared by dissolving dried QDs with nitric acid.
Dynamic light scattering (DLS) was carried out on a CGS-3 goniometer system equipped with HeNe laser illumination at 633 nm and an ALV/LSE-5003 correlator (Malvern). Purified QD solutions are filtered (0.2µm) and measured at five different angles between 45° and 120°. Zeta potentials were measured in triplicate in water using a Malvern Zetasizer.
Manganese ions leaching Manganese leaching was measured by colorimetry using
3,3’,5,5’-tetramethylbenzidine (TMB) as described by Bosch-Serrat.28 Purified hydrophilic quantum dots were dispersed in cell culture medium (optiMEM reduced serum, no phenol red medium, Gibco) at a concentration of 1 µM and left at 37°C. After different incubation times, free manganese ions are separated from QDs by ultrafiltration (100 kDa cutoff), quantified using TMB absorbance at 450 nm and standard calibration solutions.
Relaxivity characterization Spin-lattice relaxivities (r1) were measured at 7T and room
temperature using a Bruker asx 300MHz NMR spectrometer. A solution containing QD was introduced in a 200µl Teflon sample holder and put in the spectrometer. We then used an inversion recovery protocol with various time delays, τ, between the 180°-inversion pulse and the 90°-reading pulse. The NMR signal, M, for a given time delay τ, is given by
where M0 is the NMR signal before inversion. T1 is obtained from the above equation (see
Figure S6a in ESI). Relaxation measurements were performed at different QD concentrations to obtain the relaxivity of each QD sample (Figure S6b).
Cell viability assay To assess the cytotoxicity of our probes, we performed a colorimetric
MTT assay on HeLa cells. The assay is based upon the reduction of yellow 3-(4,5-dimethylthiazol-2-yl)-2,5-diphenyltetrazolium bromide to its purple formazan by viable cells. HeLa cells were seeded on a 96-well plate at a density of 10000 cells per well. After overnight incubation at 37°C and 5%CO2, culture medium was removed and cells were rinsed
with phosphate buffer saline (PBS) solution. Then, 100 µl of culture medium containing QDs at various concentrations were added. These QD solutions were pre-filtered (0.2 um) for
sterilization. After 24 hours of incubation at 37°C and 5%CO2, medium was removed and
cells were rinsed with PBS. We then added 100 µl of culture medium and 20 µl of a solution of MTT in water (5mg/ml). After 2 hours incubation, culture medium was removed and cells were rinsed with PBS. 150 µl of a 10%vol Triton X-100 in isopropanol was added to cells. After 30 minutes incubation, absorbance at 550 nm was measured on an absorbance microplate reader. Three replicates for each condition were considered, as well as i) a blank control with only cell medium, and ii) a control with the highest evaluated nanoparticle concentration in cell medium. This latter control intended to assess eventual (and parasitic) MTT reagent conversion induced by QD nanoparticles.29,30 In our assays, such an effect was not observed: the absorbance of the only-QDs control was similar to the one of the blank with only medium. Furthermore, all reported absorbance values are increments relative to the absorbance of the blank.
In vivo experiments
Animals and QD administration All animal experiments were conducted in agreement with
the Principles of Laboratory Animal Care (National Institutes of Health publication no. 86-23, revised 1985) and approved by the regional ethics committee. Female C57/BL6 mice (Janvier, Le Genest-Isle, France) were used in this study and maintained under specific pathogen-free conditions. 300µl of a 40 µM stock solution of CuInSe2/Zn0.8Mn0.2S QDs was
ultrafiltered and the pellet was dissolved in 60µl of PBS. All experiments were performed under anesthetic using intraperitoneal injection of 0.01 ml/g of body weight of a solution containing 9 mg/ml of ketamine (Ketalar®, Panpharma, Fougères, France) and 0.9 mg/ml of xylazine (Rompun®, Bayer Pharma, Puteaux, France). Female C57/BL6 mice (Janvier, France) were injected subcutaneously in the distal part of the left anterior paw with 20 µl of QD solution. After product delivery, the left paw was kneaded to improve product migration. Immediately after injection, animals were placed in the MR scanner, in the same position as before QD injection.
Magnetic Resonance Imaging MRI was performed on a 3T MR scanner (SIGNA HDxt,
General Electric, Milwaukee, WI) using a four channel volume coil for reception (RAPID Biomedical, Rimpar, Germany). T1-weighted images were acquired using a fast spin-echo sequence with the following parameters: TE/TR=12/500ms; acquisition matrix=480x320; field of view=120mm² and 17 1-mm-thick slices. Acquisitions were performed pre and post (20min) QD injection.
Near-Infrared Fluorescence Imaging In vivo optical imaging of QDs was performed using a
Fluobeam® (Fluoptics, Grenoble, France) NIR imaging system. A 750-nm longpass emission filter is used. The regions of interest (ROIs) were depilated using a commercial hair removal cream before imaging. The CCD camera shows the specificity to adjust the fluorescence signal on the pixel which presents the strongest fluorescence intensity. Thus, the injection point of QDs was hidden if necessary, allowing thereby a better ROI visualization. In vivo fluorescence of axillary lymph nodes and lateral thoracic was acquired after MRI experiments, about 1h after QD administration.
RESULTS AND DISCUSSION
Growth of thick zinc sulfide shell on Zn-Cu-In-S cores
We first synthesized Zn-Cu-In-S core QDs using a protocol adapted from Li et al.14. We added a small amount of zinc precursors to the core synthesis as this improved the core photoluminescence quantum yield (PL QY),15 without restricting the tunability of the emission in the NIR region due to the increase of the bang gap. The Zn content was indeed typically limited to 25% compared to the Cu content, as estimated from EDS, and the Cu/In ratio was close to one. The obtained Zn-Cu-In-S cores typically emitted at 780 nm, with a FWHM of 100 nm, and a PL QY of 30%. While the size of these cores was difficult to estimate from TEM images due to low contrast, X-ray diffractograms were consistent with a core size of about 3 nm using Scherrer’s law (see Materials and Methods section).
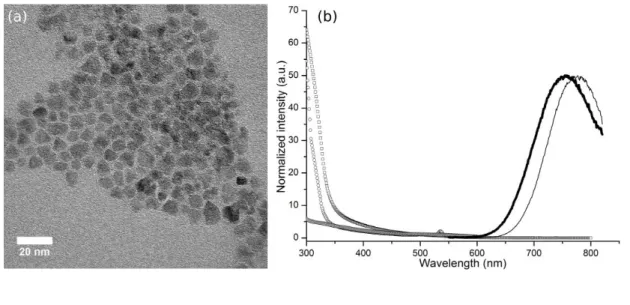
Our objective was then to grow a thick ZnS shell to be able to incorporate at later stages a maximal number of paramagnetic Mn2+ ions in the shell. Layer by layer deposition of ZnS on quantum dots following a SILAR protocol31 required elevated temperatures (>240 °C) to activate low reactivity precursors (zinc oleate and sulfur dissolved in octadecene). At these temperatures however, QD cores were rapidly etched, while lower temperatures resulted in an absence of growth. Previously described protocols were able to yield thin (1 nm) ZnS shell around Zn-Cu-In-S cores using dropwise injection of more reactive zinc ethylxanthate or dithiocarbamate precursors.14,15 However the injection of additional precursors resulted in secondary nucleation of ZnS nanocrystals without increasing the shell thickness. We found that adjusting (see Materials and Methods for details) the amount of oleylamine and the injection speed helped growing thicker monocrystalline shells, in the range of 2-3 nm, corresponding to about 10 ZnS monolayers, as shown in Figure 1a by TEM (8±2 nm in diameter) and XRD (7±1 nm).
The resulting QDs retained their emission properties in the near infrared (Figure 1b), with a small blue shift which could be attributed to the incorporation of Zn in the core due to cation exchange and/or Zn interdiffusion.15,32 Photoluminescence excitation (PLE) spectrum showed a sharp rise below 350 nm, corresponding to the contribution of ZnS. This confirms the growth of a thick ZnS shell on the fluorescent QD cores. Comparison of PLE and absorption spectra indicates a limited secondary nucleation (typically less than 10%). Fluorescence decays showed a long lifetime component around 200 ns (see Figure S1 in ESI), which is typical for these I-III-VI QDs.14,33
Incorporation of manganese in the shell.
To incorporate manganese in the ZnS shell, we simply replaced zinc oleate with manganese acetate in the injection solution using different ratios of Mn to Zn. To avoid oxidation of manganese, the solution was carefully degassed under vacuum before adding the manganese precursor, as was previously described by Yang et al.34 We thus synthesized samples with 1, 2, 5, 10, 20 and 30% of manganese precursor in the injection of solution.
Incorporation of Mn in the ZnS shell is evidenced by X-ray diffractograms, as shown in Figure 2. The nanocrystals retain their sphalerite structure, with narrow diffraction peaks indicative of large monocrystalline nanoparticles. Using Scherrer’s law (see Materials and Methods section), the derived crystallite size is around 7 nm for all samples. The diffraction peaks deviates from pure ZnS towards MnS at smaller angles with increasing Mn content in the injection solution. The position of the XRD peaks may be used to determine the final Mn content in the nanocrystals using Vegard's law. In the range of 2% to 30% of Mn compared to the total cation content (Zn+Mn), the Mn proportion measured in the final nanocrystals using XRD closely follows the composition of the injection solution. This was confirmed by elemental analysis using EDS on nanocrystal powders, as shown in Table S1 in Electronic Supplementary Information.
In addition, the incorporation of manganese in the ZnS shell is probed using electron paramagnetic resonance (EPR). EPR spectra for samples with different manganese contents are presented in Figure 3. We observed a classical structure for manganese in zinc sulfide.35 At very low Mn concentration, up to 2%, these spectra exhibit a six-line hyperfine structure, with a 71 G splitting at 9.7 GHz corresponding to Mn in ZnS.35 This structure gradually disappears when the manganese content is increased, due to Mn-Mn interactions.36 Magnetometry measurements at room temperature show a paramagnetic behavior for all samples (see Figure S2 in ESI). This, together with the above results, confirms that Mn is incorporated inside the shell and not only adsorbed at the surface of the QDs.
Incorporation of Mn in the shell did not influence the size or the shape of the nanocrystals: TEM images (Figure 4a) show nearly spherical nanoparticles of around 9±3 nm in diameter (see figure S3(c) in ESI for size distribution), corresponding to a 2-3 nm MnxZn1-xS shell
thickness. Diffraction patterns observed by high resolution TEM confirm the cubic sphalerite crystalline structure of the core-shell nanocrystals (Figure S3 in ESI).
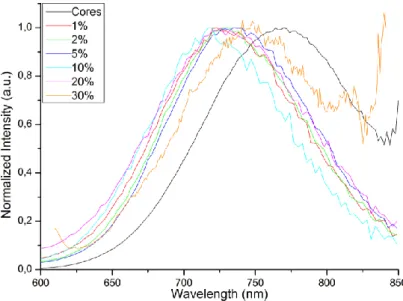
We investigated the influence of Mn:Zn ratio on the optical properties of Zn-Cu-In-S/Zn 1-xMnxS QD. These properties remain quite similar to Zn-Cu-In-S/ZnS QDs, as shown in
Figure 4b and Figure S4 in ESI. Absorption and photoluminescence excitation spectra show a high absorption at small wavelength, below 350 nm, which reflects the growth of a thick ZnS shell. Similarly to Zn-Cu-In-S/ZnS QDs, the growth of the shell induces a small blue shift due to a limited incorporation of zinc in the core. No systematic additional shift was observed for different Mn content. For these QDs, the bandgap energy is lower than the 4T1 - 6A1
ligand-field Mn transition,37 which prescribes energy transfer from the QD bandgap to the Mn centers, so that the QDs retain their core emission properties.38
Relaxivity measurements.
There are mainly two strategies to transfer quantum dots into water: encapsulation and ligand exchange.39 The encapsulation process requires the use of amphiphilic molecules, whose hydrophobic part interacts with the initial hydrophobic ligands of the QD and hydrophilic part ensures water solubility and colloidal stability. This strategy possesses the advantage of an excellent preservation of the fluorescence properties, since the QD surface chemistry is kept unmodified. Their PL stability in water is also superior, as the hydrophobic layer prevents
water, ions and small solutes from accessing the QD surface. However, this would potentially limit the MRI response of these probes, as water protons would not be able to reach the close proximity of the paramagnetic Mn ions located in the ZnS shell. In contrast, exchanging the original hydrophobic ligand with new hydrophilic ligands may decrease the PL quantum yields of the QDs due to suboptimal surface passivation and oxidation. However, it enhances proton access to the QD surface, which should translate into better MRI response. Since we expect that the fluorescence sensitivity achieved by our QDs will be higher than for MRI, we chose to use the latter strategy. In addition, ligand exchange generally offers more compact probes compared to encapsulation strategies. We therefore exchanged the original (xanthogenates, oleylamine and/or oleate) ligands by polyethylene glycol (PEG) modified-dihydrolipoic acids (DHLA-PEG).27 These ligands provide colloidal stability in a wide range of buffers with a reduced non-specific biomolecule adsorption. QDs were then purified using ultrafiltration to remove excess of unbound ligands and possibly desorbed ions, as well as using centrifugation to remove small aggregates. The optical properties remained similar in water (see Figure S5 in ESI) and we obtained quantum yields up to 20%. The hydrodynamic radius of our QDs capped with DHLA-PEG was measured by DLS and was found to be 10.8±0.7nm (see figure S6 in ESI), consistently with the size of our QDs and of the DHLA-PEG ligands. Zeta potential measurement indicated that our probes were neutral (0.5±0.2mV), as expected from PEG-coated nanoparticles.
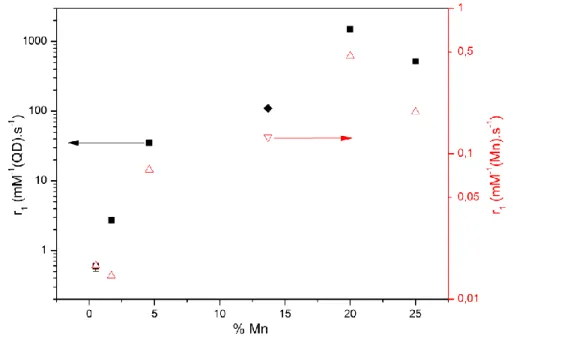
We then measured the r1 relaxivity of Zn-Cu-In-S/Zn1-xMnxS QDs with different manganese
contents using 1H NMR in pure water under a 7T static magnetic field at 300K. The relaxation rate of water protons increased linearly with the QD concentration for all samples (see Figure S7 in ESI). We measured the absolute concentration of manganese, indium and zinc using ICP-AES, then normalized by the Mn concentration to derive relaxivity values in mM(Mn)-1s
-1
, as shown in Figure 5. At low Mn content, we observe a strong increase in relaxivity with increasing Mn content, from about 0.01 mM(Mn)-1s-1 for QDs containing 1% Mn to 0.5 mM(Mn)-1s-1 for QDs containing 20% Mn at 7T. This increase suggests that several Mn participates cooperatively in the relaxation dynamics of water protons diffusing near the surface of the nanoparticle: when the Mn concentration is higher, each Mn participates more efficiently to the water relaxivity. Interestingly, the optimal Mn concentration in ZnS, 20 %, is above the solubility of MnS in ZnS at the synthesis temperature (7.5 % for bulk materials).40 It is unclear whether our continuous growth method actually leads to epitaxial growth of small MnS nanoclusters or if the Mn ions are dispersed homogeneously in the shell. While bulk MnS is antiferromagnetic,41 very small MnS clusters may contain uncompensated spins at their boundaries, which could interact with nearby water protons and accelerate their relaxation. With more concentrated samples (such as Zn0.75Mn0.25S), the effective relaxivity
per mmol of manganese decreases. This may be due to the increase of antiferromagnetic coupling between neighbouring manganese atoms.42
With respect to the application of our Mn-doped QDs to MRI, it is interesting to consider their “per QD-relaxivity” in mM(QD)-1
s-1, obtained by multiplying the per Mn-relaxivity by the number of Mn per QD, as determined by elemental analysis. This will indeed dictate the local concentration of doped QDs needed to obtain a T1 contrast in a specific tissue. Figure 5
shows that the per-QD relaxivity first strongly increases with the doping rate, since both the per-Mn relaxivity and the number of Mn per QD increase. The optimal sample, corresponding to a Zn0.85Mn0.15S shell, presents a r1 value of 0.5 mM(Mn)-1s-1 and 1500 mM(QD)-1s-1 at 7T.
The per-Mn relaxivity is lower than for single ion probes such as Gd-DTPA (3.1 mM-1s-1 at 7T43 and slightly lower than previously reported Mn-doped Si QDs44, Zn0.9Mn0.1S
nanocrystals45 and CdSe/Zn0.94Mn0.06S QDs23. We attribute this difference to the fact that the
effect of Mn ions on water protons decreases with the distance to the shell surface, so that Mn ions deeply buried in the shell do not contribute much to the overall relaxivity. On the other hand, our thick shell allows the incorporation of much more Mn ions (3000 Mn/QD for the optimal sample), leading to a maximal relaxivity of 1500 mM(QD)-1s-1 at 7T. This high relaxivity should provide a high detection sensitivity for low density biomolecular markers.
Ideally, QDs for in vivo imaging should not only emit in the NIR transparency window (700-900 nm) but also be capable to efficiently absorb light in the same region, so that excitation light could efficiently penetrate the tissue and excite the probes. If we select for this purpose an excitation wavelength around 700 nm, optimal NIR QDs should emit further than the 700-750 nm range obtained for our CuInS2-based probes in order to optimize their absorption
cross-section at 700 nm and be able to efficiently discriminate between excitation back reflection and fluorescence emission. We therefore chose to synthesize Zn-Cu-In-Se/Zn0.8Mn0.2S core/shell QDs, based on previously reported protocols for cores16 and
protocols similar to those used for Zn-Cu-In-S for the Zn1-xMnxS shell. This allowed us to
obtain Mn-doped QDs with smaller shell thicknesses (around 1.5nm) and manganese content (see table S1 in ESI), but with an 800 nm-centered emission (see Figure S8 in ESI), which was better adapted for in vivo imaging. The relaxivity of Zn-Cu-In-Se/Zn0.86Mn0.14S QDs was
estimated to be 110 mM(QD)-1s-1 and 0.13 mM(Mn)-1s-1. The relaxivity per Mn atom (Fig. 5, inverted triangle) is comparable with the ones obtained with CuInS2 cores. Nonetheless, the
per QD relaxivity (Fig.5, diamond) is lower due to a smaller number of Mn ions incorporated in each QD (around 1000 Mn/QD) and a smaller surface of QDs.
Mn leaching and cytotoxicity
To ensure a prolonged colocalization of the MRI and fluorescence signals and limit toxicity due to Mn leaching, the paramagnetic Mn dopants must remain inside the QD nanocrystals even after prolonged exposition in a biological medium. Zn-Cu-In-Se /Zn0.8Mn0.2S QDs
were incubated in culture medium at 37°C and the released Mn ions were quantified by colorimetry. The release of Mn ions was indeed found to be extremely slow: (1.3±0.8)‰ after 3 days and (2.6±0.9)‰ after 7 days.
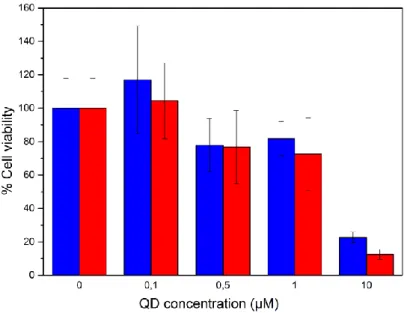
We investigated the cytotoxicity of our probes with or without Mn in the shell using a common colorimetric MTT assay after a 24h incubation (Figure S9 in ESI). Interestingly, the presence of manganese in the QD shell does not increase significantly the cytotoxicity of our QDs, even at millimolar concentrations of Mn. Cellular viability remains above 80% for QD concentrations up to 1 µM, which shows the low toxicity of these QD probes. In comparison, other QDs reported a much stronger toxicity with IC50 values around 100 nM, such as
CdSe/ZnS (45 nM),46 CdTe/ZnS (100 nM)47 or InAs/InP/ZnS (≈100 nM).48 This lower toxicity may be attributable to the large inert ZnS shell and to the virtual absence of released free Mn ions from the QDs at this timescale. We also note that in vitro toxicity results cannot be directly extrapolated to in vivo toxicity, since it depends on the overall biodistribution and organ specific doses.49 For example, an absence of acute toxicity has been demonstrated after intravenous injection of relatively high doses of CdSe-based QDs.11 Since our Cd-free QDs show lower in vitro toxicity, we assume that they will also present limited in vivo toxicity, even though a comprehensive in vivo study is required to fully understand the in vivo biological response to our nanoprobes.
In vivo imaging.
As a simple proof-of-principle, we chose to demonstrate detection of regional lymph nodes in mice. This required no further functionalization for specific targeting of the QDs, since nanoparticles injected subcutaneously are partly drained through lymph vessels and captured by macrophages in the lymph nodes. In addition, lymph node detection represents a potential clinical application of such probes, as lymph node resection is a common diagnostic procedure in the treatment of breast cancer. A solution containing 4 nmol of Cu-In-Se/Zn0.88Mn0.12S QDs emitting at 810 nm and coated with DHLA-PEG was prepared in
phosphate buffer saline solution (PBS) and injected in the anterior left paw of a mouse. As previously demonstrated with other PEG-coated NIR emitting QDs, the probes migrated very rapidly to the regional lymph nodes.15 Using MRI, a strong signal enhancement was clearly visible on T1-weighted images, acquired 20 min after QD injection (Fig. 6), compared to pre-injection images. Near infrared fluorescence images acquired a few minutes later (Figure 6c) clearly show the two regional lymph nodes previously detected in MRI. Here, the injection point was hidden to increase the contrast. However, the nodes were also visible without hiding it, as shown in Figure S10 in ESI. These results demonstrate the good colocalization of MR and NIRF contrast in the regional lymph nodes due to the uptake of the Mn-doped QDs.
CONCLUSION
In this work, we have described the synthesis of core/shell CuIn(S,Se)2/Zn1-xMnxS bimodal
probes for both near infrared fluorescence imaging and MRI, based on low-toxicity materials. By varying the size and composition of the cores, we were able to tune the emission wavelength of these QDs throughout the “therapeutic window”, the spectral range corresponding to minimum absorption and diffusion of blood and tissues. The growth of a thick shell of Zn1-xMnxS on fluorescent cores not only preserves their fluorescence in water
but also confers a paramagnetic character to our probes. Optimization of the nanoparticle size and Mn content leads to r1 relaxivities in water ranging from 1 to 1500 mM(QD)-1s-1, allowing
sensitive MR and NIRFI detection. Finally, we have demonstrated the use of these probes in
vivo for imaging the regional lymph nodes in mice in both NIRFI and MRI. These probes
represent promising tools for in vivo biological and biomedical imaging due to their high sensitivities and to the well-developed toolbox available for QD functionalization. Further biodistribution and toxicity studies will be required before translating these probes to the medical field.
Acknowledgements
The authors would like to thank X. Xu for help with TEM, G. Lang for EPR, B. Bresson for NMR and B. Leridon for SQUID. Part of this work was supported by a SESAME grant from gion le-de- rance and by the nvestissement d’avenir pro ect anoCTC from the Minist re de l’enseignement sup rieur et de la recherche (France).
References
1. 1 R. J. Gillies, J. Cell. Biochem., 2002, 87, S39, 231–238
2. T. F. Massoud and S. S. Gambhir, Genes Dev., 2003, 17, 545–80. 3. R. Weissleder and M. J. Pittet, Nature, 2008, 452, 580–9.
4. J. Cheon and J.-H. Lee, Acc. Chem. Res., 2008, 41, 1630–40.
5. E. T. Ahrens and J. W. M. Bulte, Nat. Rev. Immunol., 2013, 13, 755–763.
6. X. Michalet, F. F. Pinaud, L. a Bentolila, J. M. Tsay, S. Doose, J. J. Li, G. Sundaresan, a M. Wu, S. S. Gambhir, and S. Weiss, Science (80-. )., 2005, 307, 538–44.
7. H. Mattoussi, G. Palui, and H. Bin Na, Adv. Drug Deliv. Rev., 2012, 64, 138–66. 8. S. Kim, Y. T. Lim, E. G. Soltesz, A. M. De Grand, J. Lee, A. Nakayama, J. A. Parker, T. Mihaljevic, R. G. Laurence, D. M. Dor, L. H. Cohn, M. G. Bawendi, and J. V Frangioni,
Nat. Biotechnol., 2004, 22, 93–7.
9. E. Cassette, M. Helle, L. Bezdetnaya, F. Marchal, B. Dubertret, and T. Pons, Adv.
Drug Deliv. Rev., 2013, 65, 719–31.
10. J. Mobley and T. Vo-Dinh, in Biomedical Photonics Handbook, ed. T. Vo-Dinh, CRC Press, Boca Raton, FL, 2003.
11. L. Ye, K. Yong, L. Liu, I. Roy, R. Hu, J. Zhu, H. Cai, W. Law, J. Liu, K. Wang, J. Liu, Y. Liu, Y. Hu, X. Zhang, M. T. Swihart, and P. N. Prasad, Nat. Nanotechnol., 2012, 7, 453–458.
12. X. Li, Y. He, S. S. Talukdar, and M. T. Swihart, Langmuir, 2003, 19, 8490–8496. 13. F. Erogbogbo, K. Yong, I. Roy, R. Hu, W. Law, W. Zhao, H. Ding, F. Wu, R. Kumar, M. T. Swihart, and P. N. Prasad, ACS Nano, 2011, 5, 413–23.
14. L. Li, T. J. Daou, I. Texier, T. T. Kim Chi, N. Q. Liem, and P. Reiss, Chem. Mater., 2009, 21, 2422–2429.
15. T. Pons, E. Pic, N. Lequeux, E. Cassette, L. Bezdetnaya, F. Guillemin, F. Marchal, and B. Dubertret, ACS Nano, 2010, 4, 2531–2538.
16. E. Cassette, T. Pons, C. Bouet, M. Helle, L. Bezdetnaya, F. Marchal, and B. Dubertret,
Chem. Mater., 2010, 22, 6117–6124.
17. K.-T. Yong, I. Roy, R. Hu, H. Ding, H. Cai, J. Zhu, X. Zhang, E. J. Bergey, and P. N. Prasad, Integr. Biol., 2010, 2, 121–9.
18. J.-C. Hsu, C.-C. Huang, K.-L. Ou, N. Lu, F.-D. Mai, J.-K. Chen, and J.-Y. Chang, J.
Mater. Chem., 2011, 21, 19257.
19. C. Cheng, K. Ou, W. Huang, J. Chen, J. Chang, and C. Yang, ACS Appl. Mater.
Interfaces, 2013, 5, 4389–400.
20. F. Ducongé, T. Pons, C. Pestourie, L. Hérin, B. Thézé, K. Gombert, B. Mahler, F. Hinnen, B. Kühnast, F. Dollé, B. Dubertret, and B. Tavitian, Bioconjug. Chem., 2008, 19, 1921–6.
21. E. Giovanelli, E. Muro, G. Sitbon, M. Hanafi, T. Pons, B. Dubertret, and N. Lequeux,
Langmuir, 2012, 28, 15177–84.
22. R. Bhargava, D. Gallagher, X. Hong, and A. Nurmikko, Phys. Rev. Lett., 1994, 72, 416–419.
23. S. Wang, B. R. Jarrett, S. M. Kauzlarich, and A. Y. Louie, J. Am. Chem. Soc., 2007,
129, 3848–3856.
24. G. Manna, S. Jana, R. Bose, and N. Pradhan, J. Phys. Chem. Lett., 2012, 3, 2528– 2534.
25. Q. Liu, R. Deng, X. Ji, and D. Pan, Nanotechnology, 2012, 23, 255706.
26. B. Lin, X. Yao, Y. Zhu, J. Shen, X. Yang, H. Jiang, and X. Zhang, New J. Chem., 2013, 37, 3076–3083.
27. B. C. Mei, K. Susumu, I. L. Medintz, J. B. Delehanty, T. J. Mountziaris, and H. Mattoussi, J. Mater. Chem., 2008, 18, 4949.
28. F. B. Serrat, Mikrochim. Acta, 1998, 129, 77–80.
29. N. A. Monteiro-Riviere, A. O. Inman, and L. W. Zhang, Toxicol. Appl. Pharmacol., 2009, 234, 222–235.
30. S. Wang, H. Yu, and J. K. Wickliffe, Toxicol. Vitr., 2011, 25, 2147–51.
31. J. J. Li, Y. A. Wang, W. Guo, J. C. Keay, T. D. Mishima, M. B. Johnson, and X. Peng,
J. Am. Chem. Soc., 2003, 125, 12567–75.
32. J. Park and S.-W. Kim, J. Mater. Chem., 2011, 21, 3745-3750.
33. T. K. C. Tran, Q. P. Le, Q. L. Nguyen, L. Li, and P. Reiss, Adv. Nat. Sci. Nanosci.
34. Y. Yang, O. Chen, A. Angerhofer, and Y. C. Cao, J. Am. Chem. Soc., 2008, 130, 15649–61.
35. T. Kennedy, E. Glaser, P. Klein, and R. Bhargava, Phys. Rev. B, 1995, 52, R14356– R14359.
36. Y. Ishikawa, J. Phys. Soc. Japan, 1966, 21, 1473–1481. 37. D. Langer and H. Richter, Phys. Rev., 1966, 146, 554–557.
38. R. Beaulac, P. I. Archer, X. Liu, S. Lee, G. M. Salley, M. Dobrowolska, J. K. Furdyna, and D. R. Gamelin, Nano Lett., 2008, 8, 1197–201.
39. S. B. Brichkin and E. V. Chernykh, High Energy Chem., 2011, 45, 1–12.
40. C. Sombuthawee, S. B. Bonsall, and F. A. Hummel, J. Solid State Chem., 1978, 25, 391–399.
41. L. Corliss, N. Elliott, and J. Hastings, Phys. Rev., 1956, 104, 924–928.
42. S. H. Koenig and R. D. Brown, Prog. Nucl. Magn. Reson. Spectrosc., 1990, 22, 487– 567.
43. C. Kalavagunta, S. Michaeli, and G. J. Metzger, Contrast Media Mol. Imaging, 2014,
9, 169–176.
44. C. Tu, X. Ma, P. Pantazis, S. M. Kauzlarich, and A. Y. Louie, J. Am. Chem. Soc., 2010, 132, 2016–23.
45. M. Gaceur, M. Giraud, M. Hemadi, S. Nowak, N. Menguy, J. P. Quisefit, K. David, T. Jahanbin, S. Benderbous, M. Boissière, and S. Ammar, J. Nanoparticle Res., 2012, 14, 932-938.
46. S. Deka, A. Quarta, M. G. Lupo, A. Falqui, S. Boninelli, C. Giannini, G. Morello, M. De Giorgi, G. Lanzani, C. Spinella, R. Cingolani, T. Pellegrino, and L. Manna, J. Am. Chem.
Soc., 2009, 131, 2948–58.
47. Y. Su, Y. He, H. Lu, L. Sai, Q. Li, W. Li, L. Wang, P. Shen, Q. Huang, and C. Fan,
Biomaterials, 2009, 30, 19–25.
48. R. Xie, K. Chen, X. Chen, and X. Peng, Nano Res., 2008, 1, 457–464.
49. K. M. Tsoi, Q. Dai, B. A. Alman, and W. C. W. Chan, Acc. Chem. Res., 2013, 46, 662–71.
FIGURES
Figure 1 a) TEM images of Zn-Cu-In-S/ZnS core/shell QDs; b) Normalized PL spectra of Zn-Cu-In-S core (gray) and Zn-Cu-In-S/ZnS core/shell QDs (black), absorbance spectra of core (triangles) and core-shell (squares), and
PLE spectrum of Zn-Cu-In-S/ZnS core/shell QDs (circles).
Figure 2 XRD patterns obtained for different Mn concentrations in the injection solution. Patterns for zinc blende ZnS (JCPDS 03-065-5476) and MnS (JCPDS 03-065-2884) are indicated for reference.
Figure 3 EPR spectra of Zn-Cu-In-S/Zn1-xMnxS QDs obtained for various Mn contents
Figure 4 : a) Typical TEM image (Inset: HRTEM image, scale bar: 5nm), b) Absorbance (squares) and PL (black) spectra of Zn-Cu-In-S/Zn1-xMnxS core/shell QDs
Figure 5 Longitudinal relaxivity r1 of Zn-Cu-In-(S,Se)/Zn1-xMnxS QDs normalized to the Mn (S: triangles; Se: inverted triangles, right axis) or QD (S: squares; Se: diamonds, left axis) concentration as a function of the Mn
content in the shell.
Figure 6 T1-weighted MRI images of a mouse before (a) and after (b) injection of a solution of Zn -Cu-In-Se/Zn0.9Mn0.1S QDs and the corresponding NIRF image (c)
Electronic Supporting Information
Fluorescence lifetime measurements
Figure S1 Photoluminescence intensity as a function of time fitted with a triexponential decay curve (red). The three lifetimes are 5.9±0.3ns, 48±2ns and 253±6ns.
Table S1 Manganese content (in %) of various quantum dots determined by XRD, EDX and ICP-AES
Core CuInS2 CuInSe2
Injection solution 2 5 10 20 30 20
XRD 3.4±0.3 7±2 8±2 19±2 24±2 12±2
EDX 1.2±0.2 5±2 5±2 17±2 12±2 15±3
Magnetic characterization
Samples are prepared by drying a QD solution in a capsule and magnetic moment as a function of applied magnetic field are recorded using a Quantum Design VSM at room temperature.
Figure S2 Room temperature magnetization curves of Zn-Cu-In-S/Zn1-xMnxS QDs for different Mn shell content
Figure S3 HRTEM image of a Zn-Cu-In-S/Zn0.75Mn0.25S QD (a) (scale bar: 5nm) and the corresponding FFT (b). Size distribution determined by TEM (c)
Figure S4 PL spectra of Zn-Cu-In-S/Zn1-xMnxS QDs with various Mn content.
Figure S5 PL (line) and absorbance (squares) spectra of Zn-Cu-In-S/Zn1-xMnxS QDs in water.
Figure S6 Left: Intensity-weighted hydrodynamic size distribution of Zn-Cu-In-Se/Zn0.8Mn0.2S measured by DLS. Due to the r6 dependence of the diffusion, the population above 100 nm represents less than 10-6 in number. Right: Zeta potential distribution measured by laser Doppler velocimetry.
Figure S7 Characterization of the QD r1 relaxivity. (a) Normalized magnetization of water protons as a function of time between the pulses. (b) Longitudinal relaxation as a function of QD and Mn concentration for Zn-Cu-In-S/Zn0.8Mn0.2S
.
Figure S9 Cell viability of HeLa cells exposed to various QDs concentrations. In blue, results for Zn-Cu-In-Se/ZnS QDs and in red, results for Zn-Cu-In-Se /Zn0.8Mn0.2S
Figure S10 NIR fluorescence image of mouse after injection of a solution of Zn-Cu-In-Se/Zn0.9Mn0.1S QDs, without hiding the injection point.