HAL Id: cea-02338931
https://hal-cea.archives-ouvertes.fr/cea-02338931
Submitted on 21 Feb 2020HAL is a multi-disciplinary open access archive for the deposit and dissemination of sci-entific research documents, whether they are pub-lished or not. The documents may come from teaching and research institutions in France or abroad, or from public or private research centers.
L’archive ouverte pluridisciplinaire HAL, est destinée au dépôt et à la diffusion de documents scientifiques de niveau recherche, publiés ou non, émanant des établissements d’enseignement et de recherche français ou étrangers, des laboratoires publics ou privés.
Are we ready to perform fully site-specific seismic
hazard studies in low-to-moderate seismicity areas ?
F. Hollender, E. Maufroy, P.-Y. Bard, G. Ameri, V. Perron
To cite this version:
F. Hollender, E. Maufroy, P.-Y. Bard, G. Ameri, V. Perron. Are we ready to perform fully site-specific seismic hazard studies in low-to-moderate seismicity areas ?. 16ECEE - 16th European conference on Earthquake Engineering, Jun 2018, Thessalonique, Greece. �cea-02338931�
ARE WE READY TO PERFORM FULLY SITE-SPECIFIC SEISMIC
HAZARD STUDIES IN LOW-TO-MODERATE SEISMICITY AREAS?
– A SYNTHESIS OF THE CASHIMA PROGRAM RESULTS –
Fabrice HOLLENDER1, Emeline MAUFROY2, Pierre-Yves BARD3, Gabriele AMERI4, Vincent PERRON5
ABSTRACT
Advanced fully site-specific seismic hazard assessment methods need two main elements. They need first an accurate estimation of the local amplification. Then, they need a reliable “reference” ground motion at the base of the soil column. In order to make progress toward site-specific applications in low-to-moderate seismicity context, the CASHIMA (Cadarache seismic hazard integrated multidisciplinary assessment) program coordinated numerous research actions since 2005. This paper is a synthesis of the achieved works. As for the local amplification estimation, we conclude that both simulations and empirical measurements are mandatory: empirical measurements are required to “calibrate” the simulations. Conversely, simulations are mandatory to extrapolate the amplification estimates beyond the seismic scenarios previously recorded by instrumentation. The definition of the hard-rock ground motion is a critical part of the fully site-specific seismic hazard study. Indeed, the current Ground Motion Prediction Equations (GMPEs) are poorly constrained for hard-rock sites. The standard procedure is to adjust the GMPEs from the host to the target site conditions by applying so-called
VS-κ adjustments. In such approach, the most critical parameter is the “target” site κ0. In low-seismicity areas, the collection of a sufficient number of records is difficult. Moreover, the κ0 physical bases are not fully understood. An alternative approach, that does not use κ0 and that involves a correction of the local amplification at each accelerometric site, was developed on a subset of the Kik-net database. The results showed significant differences with respect to the standard host-to-target approaches. In conclusion, as soon as these new GMPEs will be developed to allow the definition of consistent hard-rock ground motion, including datasets specific to European context, we estimate that fully site-specific seismic hazard study can be applied in low-to-moderate seismicity area.
Keywords: Cashima program; Site specific seismic hazard assessment; Host-to-target adjustments; site amplification empirical methods; surface-wave-based methods.
1. INTRODUCTION
The CASHIMA (Cadarache seismic hazard integrated multidisciplinary assessment) program was launched in 2005 by the CEA (Alternative Energies and Atomic Energy French Commission, Saint-Paul-lez-Durance, France) and ILL (Laue-Langevin Institute, Grenoble, France), then joined by the ITER (International Thermonuclear Experimental Reactor) Organization. This research program was partly motivated by a request from the ASN (French Nuclear Regulation Authority) that initially asked
1
Dr., CEA, DEN, Saint Paul Lez Durance, France // ISTerre, University Grenoble-Alpes / CNRS / IFSTTAR / IRD / USMB, France, fabrice.hollender@cea.fr
2
Dr., ISTerre, University Grenoble-Alpes / CNRS / IFSTTAR / IRD / USMB, France, emeline.maufroy@univ-grenoble-alpes.fr
3
Prof., ISTerre, University Grenoble-Alpes / CNRS / IFSTTAR / IRD / USMB, France,
pierre-yves.bard@ujf-grenoble.fr 4
Dr., Geoter SAS - Fugro, Auriol, France, g.ameri@fugro.com
5
Dr., CEA, DEN, Saint Paul Lez Durance, France // ISTerre, University Grenoble-Alpes / CNRS / IFSTTAR / IRD / USMB, France,vincent.perron.mail@gmail.com
2
for the future realization of a site-effect assessment for the Cadarache research Center facilities, based on 3D numerical computations. On the long term, this program was then conducted in cooperation with the SIGMA (SeIsmic Ground Motion Assessment) program. Similarly, some works initiated by the CASHIMA and SIGMA programs was finalized under the SINAPS@ (Earthquake and Nuclear Facilities: Ensuring Safety and Sustaining) program.
Although the CASHIMA program also includes a work package devoted to the seismotectonic studies of the Provence region, its main objective is the improvement of practices for site-specific seismic hazard studies. Albeit the initial request from the ASN only mentioned 3D numerical simulations, it appeared obvious that the improvement of 3D modeling approaches was not the only thematic that should be addressed within the perspective of reliable site-specific seismic hazard studies.
Taking into account the local site response within a seismic hazard assessment study can be achieved following different approaches. The simplest generic methods only use single site proxies as VS30 values or soil classes. However, these methods may not capture the whole features of local conditions. The most advanced, fully site-specific, methods explicitly account for the local site amplification and are preferable for the design of critical facilities. These last methods need two fundamental elements. First, they need an accurate estimation of the local amplification. Second, they need a reliable “reference” ground motion as the input motion at the base of the soil column (i.e., which is specifically defined for the local bedrock condition, often consisting in hard rock characterized by VS30>1500 m/s). As for the estimation of local amplification, two main groups of approaches could be involved: the numerical ones and the empirical ones. The simulation of ground motion within complex geometry implies the use of 2D or 3D numerical tools. This questions the robustness of such tools, their capabilities to compute ground motion up to high frequencies, as well as the availability of the geophysical 3D description of the geological medium at a sufficient resolution and reliability. These problems are even more important when the rheological non-linearity of soil has to be taking into account within simulations. The empirical evaluation of local amplification, that is to say the use of local seismological instrumentation, questions the “recordability” of a sufficient number of seismic events, especially in low-to-moderate seismicity areas.
As for the estimation input ground motion, the definition of “reference” hard-rock ground motion is a critical part of the fully site-specific seismic hazard study and faces other issues. Indeed, the current Ground Motion Prediction Equations (GMPEs) are poorly constrained for hard-rock site conditions due to the lack of accelerometric stations installed on such geological conditions. The nowadays standard procedure is to adjust the GMPEs from the host to the target site conditions (e.g., from standard-rock to hard-rock) by applying so-called VS- κ adjustments. In such approach, the most critical parameter to determine is the κ0 parameter of the “target” (studied) site that has a strong impact on the estimated high-frequency ground motion level. This needs recordings of a sufficiently large number of events with satisfactory signal-to-noise ratio up to high frequencies. On the other hand, in low-seismicity areas, the collection of a sufficient number of good-quality records can be more difficult. Moreover, and independently to the difficulty of assessing κ0 parameter, the physical basis of the κ0 parameter are not fully understood and the current “host-to-target” approaches have been shown to be questionable. The limited understanding of phenomena that influence high frequency content of accelerometric records, as well as the usual poor reliability of the metadata characterizing accelerometric stations, could also questions κ0-based approaches. These overall difficulties relative to standard VS- κ adjustments may justify the proposition of alternative approaches to determine hard-rock “reference” ground motion.
In a transverse way, the availability of reliable, affordable and recognized characterization methods to estimate site parameters such as VS30 or more generally VS profiles at “both sides” of the site-specific seismic hazard chain (that is to say, for the target site but also for sites where accelerometric stations used to derive GMPEs are installed) is also an important topic.
These different issues were addressed within the framework of the CASHIMA project, particularly in the context of international benchmark-like exercises known as E2VP, Prenolin or InterPacific projects. The main conclusions of those works are summarized in this paper.
3
2. SITE CHARACTERIZATION OPTIMIZATION AND INTERPACIFIC PROJECT
The shear wave velocity is the predominant parameter on ground motion amplification phenomena. The VS distribution knowledge is needed to build a reliable velocity model that will then be used in numerical simulations of seismic wave propagation. The sites concerned by the VS characterization are the locations of the constructions or industrial installations but also the sites of implantation of the seismological stations. Traditionally, the methods used to characterize VS (downhole or crosshole) are invasive measurements, which require one or more boreholes. These invasive measures are considered as the norm and are therefore frequently used, but it is important to note that their high cost considerably hampers their use in low budget projects. In parallel, non-invasive methods based on surface wave analysis have gradually emerged. They have two major advantages: (1) to obtain the required recordings, the temporary networks are deployed quickly, without any environmental impact on the studied site; (2) the total cost that a non-invasive measurement is less than the cost of an invasive measure. Consequently, from a practical and logistical point of view, only non-invasive methods can really be envisaged for “massive” characterization actions of accelerometric networks. On the other hand, these new methods have certain disadvantages: (1) the analysis techniques are numerous; (2) the non-uniqueness of the solutions of inversions creates difficulties; (3) the results can sometimes be interpreted differently depending on the point of view. Legitimately, these disadvantages generate questions and doubts among users.
In recent years, an effort by the geotechnical and seismological communities has consisted of improving measurement protocols, practices and analyses. In particular, the InterPacific project (Inter-comparison of methods for site parameter and velocity profile characterization, Garofalo et al. 2016a; Garofalo et al. 2016b; Foti et al. 2017) aimed:
(1) To better appreciate the uncertainties and in intra- and inter-method differences. In the case of intra-method uncertainty analysis for non-invasive measures (Garofalo et al. 2016a), this involved many teams working on the same datasets as part of an international benchmark. In the case of invasive measurements, this has involved the completion of several types of geophysical measurements (crosshole, downhole and PSSL) by 3 to 4 different companies on the same sites (Garofalo et al. 2016b).
(2) The development of a good practice guide of surface-wave based non-invasive measurements, in order to minimize future risks of misapplication and misinterpretation (Foti et al. 2017). This guide also serves to transfer knowledge from the academic world to geophysical and geotechnical design offices.
(3) More broadly, to improve credibility and acceptability of non-invasive measures.
The project involved the choice of three test-sites with different soil features: soft soil (Mirandola site, Italy); stiff soil (Grenoble, France); and hard rock site (Cadarache site, France).
2.1 Intra-comparison of non-invasive methods based on surface wave analysis
This exercise was conducted by 14 teams of experts. Each team received the same set of experimental data, which consisted of surface wave recordings generated both in active and passive on each of the 3 sites. Each team was free to choose its strategy to extract the surface wave dispersion curve and the corresponding VS profile (from which the VS30 proxy is estimated). Although the teams have chosen different approaches, the dispersion curves obtained are very consistent across all the participants and for the three sites (Garofalo et al. 2016a). As for VS profiles, a certain variability appears between the results of the different teams, especially when major stratigraphic interfaces are involved along the determined profiles. This variability on the estimation of VS profiles is proportional to the heterogeneity of the medium and comes from the non-uniqueness of the inversion solutions. Regarding the VS30 proxy, this parameter requires less precision because it is an averaged value. Garofalo et al. (2016a) observe that its estimate is therefore less impacted by the non-uniqueness of the solutions, and the values obtained are quite similar between the different teams.
4
2.2 Inter-comparison of results obtained by invasive-and non-invasive methods
Garofalo et al. (2016b) studied the reliability, resolution and variability obtained from VS profile estimation between invasive and non-invasive methods. For each of the 3 sites and in the same boreholes, several participants made and interpreted invasive measurements of VS but also of Vp (compression wave velocity). In parallel, participants analysed and inversed a common set of non-invasive measurements of surface waves, on which they could apply the procedure of their choice. In general, the invasive methods practiced with different methods (crosshole, downhole, PSSL) and different geophysical societies have produced surprisingly large differences compared to the initial expectation. The only velocity profile very largely outside the values of the other profiles (invasive and non-invasive methods combined) was obtained with a downhole measurement performed by one of the involved companies. Conversely, the non-invasive methods produced surprisingly less dispersed
VS profiles compared to the initial expected (this dispersion remains, however, for a given depth, greater than those of the profiles obtained by invasive methods). See Figure 1 for a comparative summary on three sites studied. The most important differences between invasive and non-invasive methods occur on the resolution of thin layers and marked contrasts, for which invasive methods are more efficient. However, a fairly similar level of variability is obtained on the estimation of the VS profile, which underlines the need to take into account this uncertainty in the estimation of the site response. The VS30 proxy estimates are very comparable, whether obtained by invasive or non-invasive methods, with a standard deviation even overall lower for non-invasive methods, which confirms that the highest resolution provided by invasive methods are not useful for estimating this parameter corresponding to a harmonic mean over the first 30 meters.
2.3 Good practice guidelines for surface wave analysis
Good practice guidelines were produced at the end of the InterPacific project (Foti et al. 2017). These guidelines emphasizes that the complexity of the interpretation process and the variety of possible approaches to surface wave analysis make it very difficult to establish a unique ‘recipe”. The guidelines provide practical information on the acquisition and analysis of surface wave data, giving some basic principles and specific suggestions for the most common situations. It is primarily intended for non-expert users using surface wave measurements, but may be useful to field specialists as a general reference. The guidelines are based on the experience gained from the InterPacific project and the expertise of its participants in the acquisition and analysis of surface wave data.
Figure 1. Comparison of non-invasive methods and invasive methods including crosshole, downhole and PSSL for all the three sites involved within the InterPacific project: Mirandola (MIR; a and b), Grenoble (GRE; c), and
5
3. “REFERENCE MOTION” DETERMINATION
3.1 Some example of features that could bias κ0 estimations
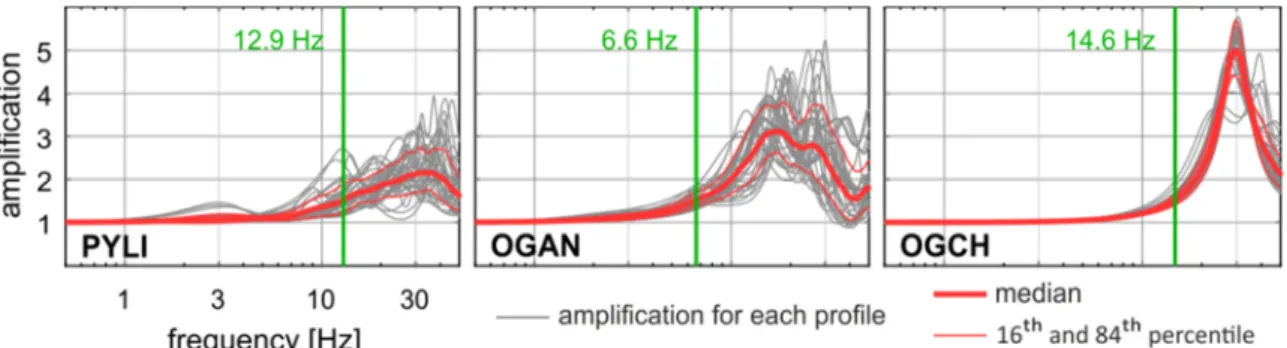
The standard procedures to adjust GMPEs from “standard” rock conditions to “hard rock” conditions use the so-called “VS-κ adjustments”. The assumed physic underling the use of κ parameter is attenuation features beneath the studied site. When this attenuation is low (assumed to be the case for hard rock), then seismic motions are be rich in high frequency content and the κ parameter is low. Indeed, this is a fact that the most rigid sites statistically produce statistically the recordings with the higher amount of high frequency content. However, this feature is not only explained by a “lack” of attenuation (assumed to be the only phenomenon within the “usual κ explanation”) but also by local amplifications generated but softer and thin layers that induce resonances at high frequency. This phenomenon is actually very usual for stations located in free-field due to the presence of weathered layers. Figure 2 shows an example of amplification charcterising rock accelerometric stations from the RAP (French accelerometric network) (Hollender et al., 2017). Significant amplifications are shown at high frequency, explained only by local amplification. Beyond the physical explanation of high frequency content of such stations, this feature questions the accuracy of κ parameter for such situations that are the most recurrent in databases. Other examples of phenomena that may bias the high frequency content of recordings, such as local instrumental setup choice or the installation depth of sensors, are illustrated in Hollender et al. (2018).
Figure 2. Example of 1D transfer functions computed using the VS profiles inferred from surface-wave inversion for 3 stations form the RAP (French accelerometric network). For each station, 33 1DTF were computed using
33 different profiles that aim to account for VS profile uncertainties (grey lines), as well as the means and standard deviation of these (red line). All stations show high-frequency amplification due to shallow softer (weather) layers. The frequency identified by the green vertical line is the one above which amplification > 1.5.
From Hollender et al. (2017).
3.2 “Deconvolved” GMPE: an alternate approach to get hard rock motion (Laurendeau et al. 2017)
In order to explore possible approaches that did not need VS-κ adjustments to determine hard-rock motions, alternate methods were developed. Today, the only available and sufficient records with reliable site metadata are the deep sensor recordings of the KiKnet network. The first explored approach was therefore to correct these recordings of this depth effect: this was done using the corrective function proposed by Cadet et al. (2012). As it is rare that deep recordings are available, it has been decided to explore also another approach which can be applicable to other data of other networks: it consists in taking advantage of the knowledge of the velocity profile to deconvolve the surface movements of their theoretical transfer function, calculated with the Thomson-Haskell method for vertically incident S waves. These two approaches were applied to the KiKnet data subset, using data obtained between 1999 and 2009 on stiff sites with VS30 ≥ 500 m/s and VSDH depth velocity ≥ 1000 m/s, corresponding to crustal earthquakes with magnitudes ≥ 3.5 and depth ≤ 25 km. 2086 recordings resulted from this selection, corresponding to 272 events and 164 sites. The distribution of data in terms of VSDH is almost uniform between 1000 and 3000 m/s, which allows, if the procedures are correct, to achieve the desired goal. Once these estimates are obtained and the time histories are
6
corrected, the last step is then to establish GMPEs according to the classical procedures in order to be able to quantify the dependence of the movements according to the rock rigidity.
The main results of this work is summarized in Figure 3, which represents the ratio between the standard rock motion estimates (VS30 = 800 m/s), and on a "very hard" rock (VS30 ≈ VSDH = 2400 m/s) for the HTT approach implemented in a traditional way with the correlation relationships from Van Houtte et al. (2011), and for the alternative approaches discussed here. It shows a good agreement at low frequency until about 2-3 Hz, where the effect of impedance generates a slight increase (20 to 30%), and a strong disagreement at high frequency (from 5 Hz). The average correlation between VS30 and κ0 used in Van Houtte et al. (2011) leads to values of 0.008 s for κ0, and it follows that the effects of less attenuation dominate those of higher impedance at high frequency, leading to a reduction of movements from 7-8 Hz, reaching a factor of 2 at 20-30 Hz. All other estimates obtained by Laurendeau et al. (2017) indicate that the impedance effect is also dominant at high frequency, with reduction factors 2 to 3 compared to the standard rock for frequencies above 8 Hz. These differences in effects lead to a ratio of about 4 at high frequency between the HTT approach and alternative approaches based on KiKnet data.
The robustness of the median results obtained with the two correction approaches therefore raises the question of the possibility of bias in the HTT approach, and their possible origin. As also stated in the discussion section of Laurendeau et al. (2017), the high-frequency amplifications observed at the surface on KiKnet sites are underestimated in the HTT approach using generic profiles. Moreover, their systematic presence can lead to strong bias in the instrumental estimation of the high frequency attenuation coefficient κ, with a tendency to overestimate for “standard” rock (measure of κ in the frequency band beyond peak amplification), and underestimation for “hard” rock (measurement of κ in the frequency band below the amplification peak).
Figure 3. Comparison of the ratios between standard rock (VS30 = 800 m/s) and hard-rock (VS30 = 2400 m/s) obtained with the GMPEs derived by Laurendeau et al. (2017) (dashed lines), and those predicted with the H2T
approach and the VS30-κ0 approach of Van Houtte et al. (2011). The specific scenario considered here is (MW = 6.5; RRUP = 20 km). From Laurendeau et al. (2017).
4. LOCAL SITE AMPLIFICATION ESTIMATION
4.1 Local site amplification estimation using simulation
Real seismological recordings are most-often obtained under low-to-moderate seismicity, which implies that they are only representative of weak and vertically incident motion. Such recordings cannot be representative of strong motion and do not integrate the near-field effects, such as motions from finite sources, non-linear effects, or variability of ground motion due to variable back-azimuth and incidence angles in complex site effects. In lack of near-field recordings, the numerical simulations of earthquake ground motion are much valuable to understand those cases that highly
7
contribute to the site-specific seismic hazard. The two projects E2VP and Prenolin aimed at quantifying the level of accuracy reached by the existing numerical codes, and the relevance of those tools to predict the earthquake ground motion in complex sedimentary medium.
4.1.1 Feedback from E2VP project (3D – linear rheology)
The E2VP project (“Euroseistest verification and validation project”) consisted in two exercises: (1) quantifying the accuracy of the 3D linear-rheology most-advanced codes applied to a realistic 3D model of a sedimentary basin (verification); (2) quantitative comparison of actual ground-motion recordings with their 3D numerical predictions in the same conditions (validation). Those two exercises were performed up to 4 Hz. This project benefits from the availability of an extended 3D model (69×69 km² - Maufroy et al. 2016) of the whole Mygdonian basin, Greece, and of accelerometric recordings from the Euroseistest permanent array.
The main results and recommendations from the series of exercises in E2VP can be found in Chaljub et al. (2015), Maufroy et al. (2015, 2016). The main drawback of the 3D numerical approach in linear media is the high sensitivity of the results to the input model and source parameters, which are affected by large uncertainties in most practical cases. 3D numerical simulations are currently limited to a maximum frequency of the order of 2 to 5 Hz, because of limitations in the resolution of geophysical survey techniques, which are unable to provide a correct mapping of geological heterogeneities at the required short wavelengths.
The accuracy of synthetics in the performed verification exercises is very high among the different tested codes on the part of the signal composed of body waves. Conversely, when surface waves are involved, the level of accuracy strongly depends on the discrete representation of interfaces in the sedimentary medium or between sediments and bedrock. The meshing of the heterogeneities is therefore one important step that must be carefully performed and precisely documented (Chaljub et al. 2015). Maufroy et al. (2015) identified the other factors of inaccuracy in the numerical simulations: the implementation of the attenuation model, the approximation of the free surface, and the nonreflecting boundaries.
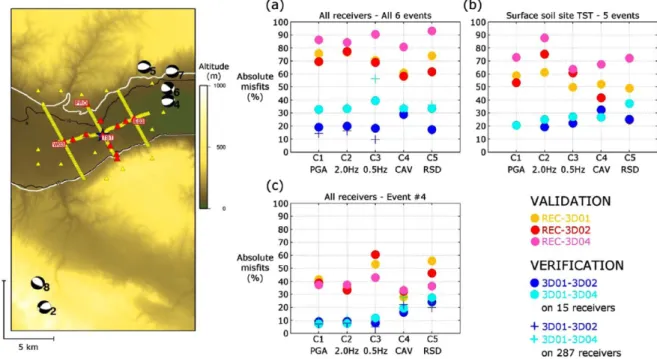
Maufroy et al. (2015) also identified the multiple origins of the differences between real and predicted ground motions: the inaccuracies in source parameters and crustal propagation (location, hypocentral depth and focal mechanism), the uncertainties in the description of the geological medium (damping, internal sediment layering structure, and shape of the sediment-basement interface). The numerical predictions well reproduce some, but not all, features of the actual site effect. Maufroy et al. (2016) showed that the validation exercise should be preferentially performed on local earthquakes relatively far from the site (R > 10-20 km) with hypocenter deeper than 8-10 km, in order to minimize the ground-motion variability in the near field of the source. Overall, as summarized in Figure 4, the level of difference among synthetics goes down to 20-25% despite the complexity of the basin model; while the level of difference between real recordings and their numerical predictions reaches 60-80% (and at best 30-40% on the best-known seismic event).
At last, the most recent studies in E2VP (Maufroy et al. 2016, 2017) illustrate the usefulness of the 3D numerical simulations to explore the origins of the aleatory variability of the ground motion in the near field of the source. For example, Maufroy et al. (2017) showed a pronounced north-south asymmetry of both amplification and duration lengthening of the ground motion at the center of the Mygdonian basin, caused by non-isotropic excitation of surface waves at the basin edges.
4.1.2 Feedback from Prenolin project (1D – non-linear rheology)
The Prenolin project (“improvement of prediction of non-linear effects caused by strong seismic motion”) had objectives similar to those of E2VP, but with a consideration for soil non-linearity. This project aimed at quantifying the accuracy of both non-linear codes and current practice to predict the impact of soil non-linear behavior on the site response. Due to previous failed attempts in 2D, this project was purposely limited to 1D soil columns.
The recommendations emitted in the previous E2VP project also apply for non-linear simulations. One of the most important is that parallel computations should be performed by at least two independent teams, both showing recognized expertise in the field, in order to verified the accuracy of the
8
numerical codes applied to complex cases. Main results and recommendations from Prenolin can be found in Régnier et al. (2016, 2018).
The verification exercise in Prenolin allowed identifying discrepancies between nonlinear numerical results attributed to (1) different understandings of the “input motion” among participants, and (2) different implementations of material damping and possible numerical energy dissipation. The epistemic uncertainties in nonlinear modeling increase with the strain level, to reach values around 0.2 in log10 scale (factor ~1.6) for PGA = 5 m/s² at the base of the soil column. These values may be reduced by almost 50% when the various nonlinear constitutive models use the same shear strength and damping implementation.
The code-to-code variability observed in the validation exercises of Prenolin was estimated between 0.1 and 0.2 in log10 scale, with smaller values at low frequencies (0.1 to 1 Hz) and greater values at high frequencies (0.2 to 10 Hz). The differences between actual recordings and their nonlinear numerical predictions show the same frequency dependence, but are significantly higher and increase with the level of solicitation. For example, around the resonance frequency of the site, the standard deviation of predictions-to-observations residuals reaches 0.35 in log10 scale (factor 2.2), while the code-to-code variability doesn’t exceed 0.15 (factor 1.4). The whole exercise points out the importance of using high quality in situ and laboratory measurements, but also of performing an accurate interpretation of these measurements. The common practices vary from one continent to another. The results of Prenolin emphasize the need for internationally accepted recommendations on the way to reconcile laboratory (large strain) measurements and in-situ (very low strain) measurements.
Figure 4. Map (left) and results (right) summarizing the configuration of the verification (blue symbols) and validation (red symbols) exercises performed in the project E2VP. The map shows the locations of the real
accelerometers of the Euroseistest array in the Mygdonian basin (red triangles), of the synthetic receivers (yellow triangles) used in the numerical simulations, and of the considered seismic events (beachballs). The two
exercises are evaluated on the E2VP criteria C1 to C5 that consider the misfits obtained on different ground-motion parameters (amplitudes in selected frequency ranges, intensity, and duration – details in Maufroy et al.
2015). The results are presented for different sets of receivers/events/teams performing the simulations. From Maufroy et al. (2016).
4.2 Local site amplification estimation using records
The recordings of the seismic motions are an indispensable contribution to the understanding and the prediction of the seismic hazard, because of the information that they contain on the sources and the
9
propagation of the seismic waves, in depth as on the surface. In areas of low to moderate seismicity, such empirical approaches are, however, difficult to achieve in a sufficiently short time due to the lower occurrence of events allowing the realization of good quality recordings having a sufficient signal-to-noise ratio (SNR). Perron (2017) first questions the quality and quantity of recordings that can be acquired in a region with low seismicity over a reasonable period of time. Traditionally, the empirical estimate of the seismic hazard is obtained with high dynamic accelerometers, which have the advantage of not saturating when they record strong movements. These instruments are therefore recommended for recording local events of relatively large magnitude and associated movements that will impact the design of infrastructure. However, their sensitivity does not allow correct recording of the weakest motions.
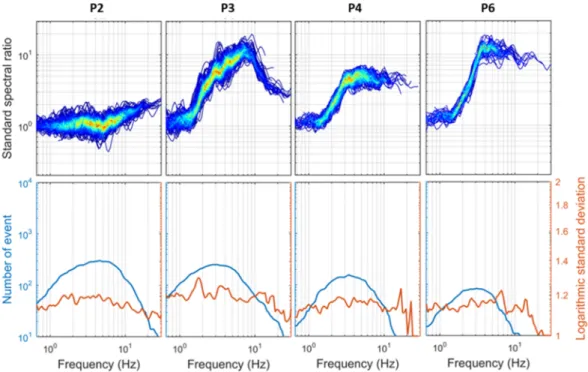
Perron (2017) shows that the use of wide-band velocimeters can record 30 to 50 times more earthquakes at low and medium frequency than the use of accelerometers (an earthquake record is considered valid if SNR > 3 at least at one frequency) (Figure 6). This was conducted in-situ at the industrial site in Provence, France, for which the local noise level is rather low. It shows that it is several hundred earthquakes that could be recorded in the space of two and a half years by a velocimetric instrumentation operating continuously. This low seismicity database is not comparable in terms of quantity and quality of records with a strong seismicity database, but it is sufficient to perform an empirical evaluation of the local site effect in the linear domain for the seismic scenario actually recorded. Indeed, the Standard Spectral Ratio (SSR) method (Borcherdt 1970) allows to obtain the empirical and relative transfer function between a rock reference site and sedimentary site. Figure 5 shows an application example for 4 sedimentary sites from the Provence industrial site where the tests were performed. One can see that the amplification is robustly estimated, up to high frequency, with a possible estimate of variability.
Figure 6. Comparisons of the percentage of (left) velocimeter and (middle) accelerometric recordings that satisfy four ranges of signal-to-noise ratios (SNRs) as a function of the frequency. Both instruments recorded in continuous mode, at the same site (P2), and over the same period of time. A total of 185 earthquakes were considered. (Right) The ratio between these velocimeter and accelerometer recordings that satisfy the same SNR
criteria. From Perron et al. (2017).
5. CONCLUSIONS
The list of all the authors of the scientific contributions of the Cashima project indicates that nearly 150 researchers, from institutes based in 14 countries (Germany, Australia, Canada, China, France, Greece, Italy, Japan, Netherlands, United Kingdom, Slovakia, Switzerland, Turkey, USA) contributed to advance knowledge and know-how in the estimation of site effects.
In the field of numerical simulation first, the E2VP (Cashima/Sigma) and Prenolin (Cashima/Sigma/ Sinaps@) projects (concerning 3D linear and 1D nonlinear simulation, respectively) allowed a significant improvement of practices and code verification. In addition to the scientific outcome of
10
these projects, integrating international benchmark phases (Chaljub et al. 2015; Maufroy et al. 2015; Régnier et al. 2016; Maufroy et al. 2016; Maufroy et al. 2017; Régnier et al. 2018) the used test-cases have been integrated into websites (e.g.: www.sismowine.org/ platform) for the future verification of new simulation codes. Numerous recommendations on the use of simulation codes have also been proposed.
However, numerical simulation cannot resolve alone the evaluation of site effects: 3D simulation (even linear) remains limited in frequency and the reliability of the results obtained depends strongly on the quality of the used property models. The geological, geophysical and geotechnical surveys will remain limited in terms of resolution for a long time. Non-linear simulation (even 1D) still raises many questions in terms of validation and representativeness of the rheological data measured in laboratory. The issue of verification and validation of non-linear 3D codes is still open and further work is needed. In order to overcome these limitations in the linear domain, empirical approaches (that is to say, based on recordings of “real” earthquakes, even of very low intensity) have proved to be essential (Maufroy et al. 2015; Maufroy et al. 2016; Perron 2017). These measurements allow at least validating the results of numerical simulations and pave the way for an iterative optimization of the property models. Even for non-linear 1D simulation, linear domain validation is a fundamental prerequisite.
Actually, empirical and numerical approaches do not oppose, they complement each other. Simulation remains essential to allow, once validated on instrumentally available scenarios, to approach the variability of the site response by multiplying the scenarios (Maufroy et al. 2017) because the empirical measurements alone do not allow a complete estimate of this variability, especially in areas of low seismicity (Perron 2017). Simulation also allows evaluating the behaviour of the soils in case of strong motions (non-linearity).
The importance of empirical measurements in the site-specific evaluation (whether for the validation of simulations via SSR measurements or for the measurement of high frequency content proxies such as the κ0parameter on rock sites) leads us to very strongly recommend the deployment of seismic instrumentation favouring the use of velocimeters recording in continuous mode instead of accelerometers which are less sensitive on the sites of interest.
Today, under certain conditions and if the recommendations mentioned are followed, it is possible to conclude that the estimation of the local amplification is feasible in an operational way, at least in linear domain and in free field.
The work done over the last years also allowed significant progress on the “reference motion” issue. Only very few methods for GMPEs adjustments (“host-to-target” adjustment HTT) are available and thus widely used internationally for large industrial projects, despite rather fundamental questions as to their physical basis and the practical issues in their actual implementation (especially on the parameter κ0). The work by Laurendeau et al. (2017) showed that alternative approaches for the derivation of hard-rock GMPEs, based on the correction of accelerograms for site effects affecting accelerometric stations, are possible and are based on more satisfactory physical bases leading to very robust results. These works, today developed on a very specific Japanese database, are not yet transposable in a European context. However, they have shown that conventional HTT approaches probably still lead to overprediction of hard rock motion, at least at high frequency.
In parallel, the work carried out on the optimization of site characterization methods, and in particular on the methods based on the measurement and interpretation of surface waves (InterPacific project), allowed significant improvements of practice and thereby their acceptance within the scientific community (Garofalo et al. 2016a; Garofalo et al. 2016b; Foti et al. 2017). Their systematic application on 50 stations of the French accelerometer network (Hollender et al. 2017) is the prerequisite for a better future use of the accelerometer data of this network, such as those developed on the KiK-net network.
In a more operational way, that is to say in terms of the very short-term application of site-specific seismic hazard analysis methods on concrete cases in low-to-moderate seismicity areas, our conclusions are as follows.
1. Cases of sites with local amplification due to site effects. The issue of the availability of “very hard rock reference motions”, although having progressed considerably in recent years, is not yet fully resolved and the application of conventional HTT methods from standard rock to hard-rock probably still leads to an over-estimation of the hazard at high frequency, albeit they allow more reliable estimates for hard rock sites compared to unadjusted GMPEs. The application of an entirely
site-11
specific method to the low-to-moderate seismicity European context requires the prior derivation of “deconvolved” type GMPEs, following the approach proposed by Laurendeau et al. (2017), but applied to pan-European databases more adapted to the French continental context. Consequently, for operational studies on sites with local amplification, the application of simpler methods, such as “aggravation factor” approaches, may be preferred in order to avoid double counting of site effects (local site effect + “residual” site effect in GMPEs even after adjustment), provided the used simulations are validated by SSR empirical measurement.
2. Case of hard rock sites without local amplification. Despite the above mentioned reservations regarding their high-frequency content (probably leading to a conservative bias), the HTT approaches for GMPE correction constitute a significant improvement compared to the use of GMPEs without correction. We therefore consider that these approaches can be used in an operational way as far as the κ0 parameter determination on the host sites is carefully performed, as well as the κ0 parameter in the target site, addressing the uncertainty issue (Perron et al. 2017). In this respect, we discourage the use of the available VS30-κ0 correlations to estimate the target κ0 generally leading to over conservative ground motions when coupled with current HTT approaches.
Therefore, the operational use of fully site-specific methods in low to moderate areas still requires research work on various topics, such as the development of new hard-rock GMPEs that are alternative to current HTT methods, and further progress of non-linear simulation, in particular in 3D. Further investigations are also needed for a better consideration of the effect of the heterogeneities of the geological medium (scattering phenomenon) in the simulations for a better agreement between simulations and measurements at high frequency, a better consideration of the spatial variability of seismic movements for large structures, as well as a complete integration of the soil-structure interaction in 2D and 3D site response calculations.
Figure 5. Top: empirical amplification using SSR for the average horizontal component of 4 soil sites from the Provence site. The colour scale indicates the curve density. Bottom: number of seismic used events as well as the
logarithmic standard deviation. From Perron (2017).
REFERENCES
Borcherdt RD (1970). Effects of local geology on ground motion near San Francisco Bay. Bull Seismol Soc Am 60:29–61.
12
Cadet H, Bard P-Y, Duval A-M, Bertrand E (2012). Site effect assessment using KiK-net data: part 2—site amplification prediction equation based on f0 and Vsz. Bull Earthq Eng 10:451–489. doi:
10.1007/s10518-011-9298-7.
Chaljub E, Maufroy E, Moczo P, Kristek J, Hollender F, Bard P-Y, Priolo E, Klin P, de Martin F, et al. (2015). 3-D numerical simulations of earthquake ground motion in sedimentary basins: testing accuracy through stringent models. Geophys J Int 201:90–111. doi: 10.1093/gji/ggu472.
Foti S, Hollender F, Garofalo F, Albarello D, Asten M, Bard P-Y, Comina C, Cornou C, Cox B, et al. (2017). Guidelines for the good practice of surface wave analysis: a product of the InterPACIFIC project. Bull Earthq
Eng. doi: 10.1007/s10518-017-0206-7.
Garofalo F, Foti S, Hollender F, Bard PY, Cornou C, Cox BR, Ohrnberger M, Sicilia D, Asten M, et al. (2016b). InterPACIFIC project: comparison of invasive and non-invasive methods for seismic site characterization. Part I: intra-comparison of surface wave methods. Soil Dyn Earthq Eng 82:222–240. doi: 10.1016/j.soildyn.2015.12.010.
Garofalo F, Foti S, Hollender F, Bard PY, Cornou C, Cox BR, Dechamp A, Ohrnberger M, et al. (2016a). InterPACIFIC project: comparison of invasive and non-invasive methods for seismic site characterization. Part II: inter-comparison between surface-wave and borehole methods. Soil Dyn Earthq Eng 82:241–254. doi: 10.1016/j.soildyn.2015.12.009.
Hollender F, Cornou C, Dechamp A, Oghalaei K, Renalier F, Maufroy E, Burnouf C, Thomassin S, et al. (2017). Characterization of site conditions (soil class, VS30, velocity profiles) for 33 stations from the French permanent accelerometric network (RAP) using surface-wave methods. Bull Earthq Eng. doi: 10.1007/s10518-017-0135-5. Hollender F, Roumelioti Z, Régnier J, Perron V, Bard P-Y (2018). Respective advantages of surface and downhole reference stations for site effect studies: lessons learnt from the ARGONET (Cephalonia Island, Greece) and Cadarache (Provence, France) vertical arrays. In: Proceedings of the 16th European Conference on
Earthquake Engineering (16ECEE), Thessaloniki, Greece.
Laurendeau A, Bard P-Y, Hollender F, Perron V, Foundotos L, Ktenidou O-J, Hernandez B (2017). Derivation of consistent hard rock (1000 < VS < 3000 m/s) GMPEs from surface and down-hole recordings: analysis of KiK-net data. Bull Earthq Eng. doi: 10.1007/s10518-017-0142-6.
Maufroy E, Chaljub E, Hollender F, Bard P-Y, Kristek J, Moczo P, De Martin F, Theodoulidis N, et al. (2016). 3D numerical simulation and ground motion prediction: Verification, validation and beyond – Lessons from the E2VP project. Soil Dyn Earthq Eng 91:53–71. doi: 10.1016/j.soildyn.2016.09.047.
Maufroy E, Chaljub E, Hollender F, Kristek J, Moczo P, Klin P, Priolo E, Iwaki A, Iwata T, et al. (2015). Earthquake Ground Motion in the Mygdonian Basin, Greece: The E2VP Verification and Validation of 3D Numerical Simulation up to 4 Hz. Bull Seismol Soc Am 105:1398–1418 . doi: 10.1785/0120140228.
Maufroy E, Chaljub E, Theodoulidis NP, Roumelioti Z, Hollender F, Bard P, de Martin F, et al. (2017). Source‐ Related Variability of Site Response in the Mygdonian Basin (Greece) from Accelerometric Recordings and 3D Numerical Simulations. Bull Seismol Soc Am. doi: 10.1785/0120160107.
Perron V (2017). Apport des enregistrements de séismes et de bruit de fond pour l’évaluation site-spécifique de l’aléa sismique en zone de sismicité faible à modérée. Thèse de doctorat, Université Grenoble Alpes.
Perron V, Hollender F, Bard P, Gélis C, Guyonnet‐Benaize C, Hernandez B, Ktenidou O (2017). Robustness of Kappa (κ) Measurement in Low‐to‐Moderate Seismicity Areas: Insight from a Site‐Specific Study in Provence, France. Bull Seismol Soc Am 107:2272–2292. doi: 10.1785/0120160374.
Régnier J, Bonilla L, Bard P, Bertrand E, Hollender F, Kawase H, Sicilia D, et al. (2016). International Benchmark on Numerical Simulations for 1D, Nonlinear Site Response (PRENOLIN): Verification Phase Based on Canonical Cases. Bull Seismol Soc Am 106:2112–2135 . doi: 10.1785/0120150284.
Régnier J, Bonilla LF, Bard P, Bertrand E, Hollender F, Kawase H, Sicilia D, et al. (2018). PRENOLIN: International benchmark on 1D nonlinear site response analysis – Validation phase exercise. Bull Seismol Soc
Am. doi: 10.1785/0120170210.
Van Houtte C, Drouet S, Cotton F (2011). Analysis of the Origins of K (Kappa) to Compute Hard Rock to Rock Adjustment Factors for GMPEs. Bull Seismol Soc Am 101:2926–2941. doi: 10.1785/0120100345.