HAL Id: hal-03108483
https://hal.archives-ouvertes.fr/hal-03108483
Submitted on 13 Jan 2021
HAL is a multi-disciplinary open access archive for the deposit and dissemination of sci-entific research documents, whether they are pub-lished or not. The documents may come from teaching and research institutions in France or abroad, or from public or private research centers.
L’archive ouverte pluridisciplinaire HAL, est destinée au dépôt et à la diffusion de documents scientifiques de niveau recherche, publiés ou non, émanant des établissements d’enseignement et de recherche français ou étrangers, des laboratoires publics ou privés.
NOx removal efficiency and ammonia selectivity during
the NOx storage-reduction process over Pt/BaO(Fe,
Mn, Ce)/Al2O3 model catalysts. Part I: Influence of Fe
and Mn addition
N. Le Phuc, Xavier Courtois, F. Can, S. Royer, P. Marecot, D. Duprez
To cite this version:
N. Le Phuc, Xavier Courtois, F. Can, S. Royer, P. Marecot, et al.. NOx removal efficiency and ammonia selectivity during the NOx storage-reduction process over Pt/BaO(Fe, Mn, Ce)/Al2O3 model catalysts. Part I: Influence of Fe and Mn addition. Applied Catalysis B: Environmental, Elsevier, 2011, 102 (3-4), pp.353 - 361. �10.1016/j.apcatb.2010.12.040�. �hal-03108483�
Applied Catalysis B: Environmental 102 (2011) 353–361. DOI: 10.1016/j.apcatb.2010.12.040
NOx removal efficiency and ammonia selectivity during the NOx
storage-reduction process over Pt/BaO(Fe, Mn, Ce)/Al
2O
3model catalysts.
Part I: influence of Fe and Mn addition.
N. Le Phuc, X. Courtois*, F. Can, S. Royer, P. Marecot, D. Duprez
Laboratoire de Catalyse en Chimie Organique, Université de Poitiers, UMR6503 CNRS, 40 Av. Recteur Pineau, Poitiers, 86022, France
*Corresponding author: E-mail: xavier.courtois@univ-poitiers.fr
Abstract
NOx storage-reduction process was studied using lean/rich cycling condition over Pt/BaO/Al2O3 model catalyst, with a special attention to the ammonia emission. The NOx
reduction selectivity strongly depends on the hydrogen conversion introduced during the rich pulses. NH3 is emitted while hydrogen is not fully converted. It was concluded that the NH3
formation rate via the NOx reduction by H2, is higher than the NH3 reaction rate with NOx to
form N2. The effect of H2O and CO2 on the reduction step were also examined and results were
explained mainly taking into account the reverse water gas shift reaction.
Fe addition in Pt/BaO/Al2O3 leads to a strong deactivation of the catalyst, probably due to
interaction between iron and platinum. Mn is a poison for the reduction step at 200 and 300°C, but it significantly enhances the NOx reduction at 400°C (conversion and selectivity). Mn favors the NOx reduction with ammonia, even if the introduced hydrogen is not fully converted.
1. Introduction:
Lower CO2 emissions from automotive sources are necessary and lead to the developmentof
diesel and lean-burn engines. However, exhaust gases from these engines contain NOx in excess
of O2, which makes NOx reduction into N2 very difficult. One possible way to reduce NOx
emissions is to use a NOx storage reduction (NSR) catalyst [1]. It works mainly in lean condition, and the NOx are then oxidized on precious metals and stored on basic compounds, mainly as nitrates. Periodically, the catalyst is submitted to rich conditions for few seconds, and the nitrates previously formed during the lean step are reduced into N2 on the precious metals
[2,3]. Platinum on alumina based catalysts are the most investigated systems and barium oxide is usually added as NOx storage material. One of the disadvantages of this catalyst is the deactivation, mainly due to sulfur poisoning [4,5,6], and to thermal aging [6,7,8]. Moreover, another problem arises from ammonia emissions. Indeed, NH3 can be formed during short
excursions under rich conditions which are necessary to reduce trapped NOx species [9,10]. The aim of this work is mainly focused on this ammonia emission. NH3 and N2O are both
undesirable products which can be observed during the NOx reduction [11,12,13]. Ammonia formation is favored when H2 is used as reducer, whereas N2O is obtained with CO as reducer
[13,14]. Several publications also showed that NH3 selectivity increases with temperature
[13,15,16]. However, in these studies, neither H2O nor CO2 were included in the reaction
mixture. On the contrary, with H2O and CO2 in the gas mixture, Pihl et al. [17] and Lindholm
et al. [18] have observed a higher NH3 emission at low temperature. Ammonia selectivity
increases with the increase of the H2 concentration [17,18]. According to Lesage et al. [19,20]
and Castoldi et al. [21], the NOx trap regeneration leads to N2 firstly, and NH3 is formed with
reducer progress through the catalytic bed. Pihl et al. [17] have proposed that the stronger adsorbed NOx are responsible for the ammonia formation. Indeed, these species are submitted to more reducing atmosphere since there are still on the catalysts after the beginning of the rich period (near no more residual O2 is present). This hypothesis is consistent with the increase of
the NH3 selectivity with the Ba loading increase [21] since it allows the formation of stable bulk
barium nitrates [22]. Finally, NH3 is assumed to play an important role in the NOx trap
regeneration. However, some points are still in opposition.
The objective of the study is to have a better understanding of the ammonia emission on Pt/BaO/Al2O3 model catalysts. Particularly, we have varied the catalytic test conditions in order
to put in evidence the conditions of ammonia emission and its possible role in the NOx reduction. Moreover, we have studied the influence of CO2 and H2O on the NOx
storage-reduction efficiency, as we have previously done for the NOx storage step [23].
In this first part, we have also examined the effect of two commonly added transition metals in NSR system: iron and manganese. A second part will discuss with cerium and Ce-Mn addition. Mn is known to be active in NO oxidation [24,25,26], a crucial step for the storage process. Moreover, Mn can also participate to the NOx storage [26,27] and exhibits an activity in the NOx reduction by NH3 reaction [28,29,30,31]. Fe is generally added in NSR formulations to
improve the catalyst sulfur resistance. Iron oxide is reported to inhibit the bulk barium sulfates formation [32,33]. Fe is also reported to be active in NOx SCR by ammonia [30].
In a previous work, we have shortly studied 1%Pt/10%BaO/Al2O3 systems modified by Mn or
to bulk barium sulfate formation inhibition as already reported, but the NOx storage property was not fully recovered. Moreover, Fe addition induced rather a degradation of the NOx conversion under rich/lean cycling conditions at high temperature (400°C). Mn addition also improves the NOx storage capacity, but no significant influence on the sulfur elimination was observed. Compared with 1%Pt/10%BaO/Al2O3, the Mn-doped catalyst exhibited slightly
lower NOx conversion but the NH3 selectivity was drastically decreased at 400°C. Additional
test showed that the NOx conversion could be improved over the Mn-based catalyst by increasing H2 concentration in the rich pulse.
In this new study, catalysts were loaded with 20% BaO and catalytic tests and characterizations were done in order to have a better understanding of the role each component, especially toward NH3 emission.
2. Experimental:
2.1. Catalysts preparation
The reference catalyst contains 1wt% Pt and 20wt% BaO on alumina. In addition, the modified samples contain 7.2wt% Mn or 7.0wt% Fe, corresponding to a "additive/Ba" molar ratio of 1. Ba and additives were deposited by co-precipitation. Alumina powder (230 m2.g-1) was suspended in a solution at 60°C and pH 10, in order to ensure complete precipitation of the barium and transition metal. The nitrate salts of the desired compounds (BaII, MnIV, FeIII) were then added under vigorous stirring, and the pH was maintained constant by ammonia addition. After 30 min, the solution was evaporated at 80°C under air and the resulting powder was dried at 120°C. After calcination at 700°C, platinum (1wt%) was impregnated using a Pt(NH3)2(NO2)2 aqueous solution. After drying, the catalyst was pre-treated at 700°C for 4h
under N2, and finally stabilized at 700°C for 4h under a mixture containing 10% O2, 5% H2O
in N2. As previously reported [35], the intermediate nitrogen treatment allows a higher
platinum-barium dispersion. The obtained catalysts are noted Pt/20Ba/Al, Pt/20BaFe/Al and Pt/20BaMn/Al. They exhibit BET specific surface areas of 127 m2g-1, 118 m2g-1 and 115 m2g
-1, respectively. In addition, the influence of manganese loading was studied. The Mn/Ba molar
ratio (noted X in Pt/20BaMnX/Al notation) was varied between 0.1 and 1.5 using the same preparation protocol. For all samples, the platinum dispersion, deduced from H2 chemisorption
measurements, varies between 8 and 11%. 2.2. Catalyst characterizations
The BET surface areas were deduced from N2 adsorption at -196°C carried out with a
Micromeritics apparatus. Prior to the measurement, the samples were treated at 250°C under vacuum for 8 h to eliminate the adsorbed species.
The platinum dispersion was determined using the H2 chemisorption method. After in situ
reduction under pure hydrogen at 500°C for 1h, the sample was flushed at the same temperature under argon for 3h. The hydrogen was dosed on the sample at room temperature until saturation. After flushing under argon for 10 min, the sample was exposed to hydrogen again. The amount of chemisorbed hydrogen was taken as the difference between the two hydrogen exposures.
X-ray powder diffraction was performed at room temperature with a Bruker D5005 using a Kα Cu radiation (λ=1.54056 Å). The powder was deposited on a silicon monocrystal sample holder. The crystalline phases were identified by comparison with the ICDD database files.
2.3. Catalytic activity measurements
2.3.1. NOx storage capacity (NSC) measurement
Before the NOx storage capacity measurements, the catalyst (60mg) was pretreated in situ for 30 min at 550°C, under a 10% O2, 10% H2O, 10% CO2 and N2 mixture (total flow rate: 10 L.h -1), and then cooled down to the storage temperature under the same mixture. The sample was
then submitted to a lean mixture as reported in Table 1, at 200°C, 300°C and 400°C. The gas flow was introduced using mass-flow controllers, except for H2O which was introduced using
a saturator. Both NO and NOx concentrations (NO+NO2) were followed by
chemiluminescence. H2O was removed prior to NOx analysis with a membrane dryer. Long
time storage is not representative of the NSR catalyst working conditions, since the lean periods are commonly around 1 min. The NOx storage capacity was then estimated by the integration of the recorded profile for the first 60 seconds, which corresponds to the lean periods of the NSR test in cycling conditions. The contribution of the reactor volume is subtracted. With the conditions used in this test, 57.4 µmol NOx per gram of catalyst are injected in 60s. For easier comparisons with the NSR tests, results are expressed as the NOx storage rate (%) for 60s (µmolstored NOx g-1cata.x 100 / 57.4) In addition, the platinum oxidation activity was estimated as
the NO2/NOx ratio (%) at saturation (usually about 900s).
Table 1: Rich and lean gas compositions used for the NOx conversion test (60s lean / 3s rich). Lean mixture was used for the NOx storage measurements. Total flow rate: 10 L h-1.
Gas NO H2 O2 CO2 H2O N2
Rich - 1 to 6% - 10% 10% Balance
Lean 500ppm - 10% 10% 10% Balance
2.3.2. NOx conversion in cycling conditions (NSR test)
Before measurement, the catalyst (usually 60mg if no other indications are given) was treated in situ at 450°C under 3% H2, 10% H2O, 10% CO2 and N2 for 15 min. The sample was then
cooled down to test temperatures (200, 300 and 400°C) under the same mixture. The NOx conversion was studied in cycling condition by alternatively switching between lean and rich conditions using electro-valves. The lean and rich periods are 60s and 3s, respectively. The gas composition is described in Table 1. Note that only the stored NOx during the lean periods can be reduced using this procedure since there is no reducer in the lean mixture and no NOx in the rich one. NO and NO2 were followed by chemiluminescence, N2O by specific FTIR, H2 by
mass spectrometry. Before the analyzers, H2O was removed in a condenser at 0°C. For each
stabilization, the outlet water was condensed for one hour in a dry condenser and then analyzed by two different HPLC. One is used for NH4+ analysis, which allows calculating the ammonia
selectivity, and the other one for NO2- and NO3- which were added to the unconverted NOx.
The N2 selectivity is calculated assuming no other N-compounds than NO, NO2, N2O, NH3.
Some tests were also performed using a Multigas FTIR detector (MKS 2030) without water trap system and same results were then obtained.
3. Results
3.1. Pt/20Ba/Al catalyst
3.1.1. XRD Characterization.
The X ray diffractogramms obtained with reference Pt/20Ba/Al before and after the platinum impregnation step are reported in Figure 1.The main crystallized phases detected by X-ray diffraction are BaCO3 and BaAl2O4. However, as previously mentioned [35] some phase
transformation occurred during the platinum addition. Indeed, the XRD pattern of the powder obtained before the platinum impregnation steps exhibits significantly more intense BaCO3 and
BaAl2O4 diffraction peaks than for Pt/20Ba/Al. It can be attributed to barium leaching from the
support during the platinum impregnation step [36,37]. Note that with a lower barium loading (10%), the same trend was observed for BaAl2O4, but BaCO3 peaks were nearly not detected
before the platinum impregnation [33].
Figure 1: X ray diffractogramms obtained with Pt/20Ba/Al (a) and with the same sample before the platinum impregnation step (b): (#) BaCO3, (*) BaAl2O4
3.1.2. NOx storage capacity / NOx conversion in cycling conditions
In this section, NOx storage capacity and NOx conversion in cycling conditions (NSR test) were measured with the reference catalyst Pt/20Ba/Al. The effects of H2O and CO2 in the gas
mixture were evaluated in regard of the catalytic behaviors. The reducer concentration (H2) was
also varied during the reduction steps of the NSR process. The aim of this section is to have a
0 2500 20 25 30 35 40 45 50 2θ (°) I (u .a ) # * * * # * * 20BaAl Pt20BaAl 20Ba/Al Pt/20Ba/Al 0 2500 20 25 30 35 40 45 50 2θ (°) I (u .a ) # * * * # * * 20BaAl Pt20BaAl 20Ba/Al Pt/20Ba/Al
better understanding of the NSR mechanism with the reference catalyst, especially toward the possible ammonia emission.
3.1.2.1. Pt/20Ba/Al behavior using the reference mixture
NOx storage capacities of platinum-barium supported catalysts were extensively studied in previous works in our laboratory [5,23,34,35]. However, new measurements were done using the same duration (60s) and the same gas composition as the lean periods of the cycled NOx storage/reduction catalytic test. Results are expressed as NOx storage rate (%) for each tested temperature (Table 2). Using the complete reaction mixture (with CO2 and H2O), the NOx
storage capacity of Pt/20Ba/Al increases with the temperature test, from 57% at 200°C to 83% at 400°C. Then, whatever the temperature test, the inlet NOx is not totally stored in 60s. The NSR properties of this catalyst are reported Table 2 (complete mixture). First, note that N2O was never significantly observed during these tests in cycling condition, whatever the
tested catalyst and the conditions test. This point is consistent with the study of Abdulhamid et al. [13] who claim that N2O is mainly obtained with CO as reducer. Whatever the tested
temperatures, the NOx conversion is always lower than the NOx storage rate for 60s (Table 2). The maximum NOx conversion is obtained at 400°C and reaches only 45%. In addition, the ammonia selectivity is rather high. It reaches around 20% at 200 and 300°C and 33% at 400°C. In the same time, only 70 to 90% of the introduced hydrogen is converted. Thus, reducers remain (H2, NH3), whereas only around half of the stored NOx reacts. The limiting step of the
process is then the reduction step.
Table 2: Pt/20Ba/Al catalyst: Influence of H2O and CO2 on the NOx storage rate (%) for 60s
(catalyst (60mg) is submitted to 57.4 µmolNOx/g in 60s) and on the NSR test: NOx conversion
rate, NH3 selectivity and H2 conversion (%).
NOx storage test NSR test Temperature test (°C) Reaction mixture NOx storage rate (%) NOx conv. (%) NH3 select. (%) 200 complete 57 35 22 200 without H2O 73 21 17 200 without CO2 81 65 18 300 complete 73 29 21 300 without H2O 89 31 24 300 without CO2 78 54 10 400 complete 83 45 33 400 without H2O 98 41 41 400 without CO2 100 70 12
In opposition with the storage tests, the minimum NOx conversion is observed at 300°C. This can be attributed to the balance between the NOx desorption rate and the NOx reduction rate. At low temperature (200°C), the NOx desorption during the rich pulses should be low but the NOx reduction rate is low too. At 300°C, the storage capacity increases but the NOx conversion is lower compared with 200°C. This observation can be attributed to a higher NOx desorption rate whereas the reduction rate should not increase in the same proportion. At 400°C, the NOx desorption should increase again, but the reduction rate is then high enough to obtain a NOx conversion rate higher than those observed at 200°C or 300°C.
3.1.2.2. Influence of H2O and CO2
As already reported for 100s storage [23], tests without water or carbon dioxide lead to enhancements of the NOx storage capacities (Table 2). H2O was found to inhibit the NO to NO2
oxidation. Indeed, the NO2/NOx ratios after storage saturation with water in the feed stream are
9%, 21% and 42% at 200, 300 and 400°C, respectively. Without H2O in the feed stream, they
reach 18%, 30% and 48%, respectively.
The inhibiting effect of CO2 on the NOx storage is stronger compared with the H2O inhibiting
effect. When CO2 is removed from the feed gas, near all the introduced NOx are trapped at 300
and 400°C (Table 3). CO2 has no influence on the NO to NO2 oxidation rate and the inhibiting
effect of CO2 on the NOx storage was attributed to a competition between nitrates and
carbonates formation on the storage sites [23].
Results of the NOx storage/reduction tests without H2O or CO2 are also reported in Table 2. In
opposition with the storage tests, absence of water leads to a deterioration in the NOx reduction rate, especially at 200°C, from 35 to 21%. At the same time, higher ammonia selectivity is observed in absence of water. On the contrary, tests without CO2 show a significant increase of
the NOx conversion. Moreover, NH3 selectivity is also lowered especially at 300 and 400°C.
In fact, addition of CO2 induces losses between 35 and 45% whereas the losses are between 20
and 30% for the NOx storage. Thus, CO2 also inhibits the reduction step. It can be attributed to
a higher NOx desorption rate during the rich pulses when CO2 is added in the reaction mixture
[38], leading to higher NOx slip. Whatever the test condition, note that the introduced hydrogen is still never fully converted.
However, all these results can be mainly explained taking into account the reverse water gas shift reaction (RWGS, CO2 + H2 CO + H2O) and its consequence on the NH3 formation
pathway proposed by Lesage et al. [19,20], i.e. the hydrolysis of isocyanate Al-NCO and Ba-NCO species (2 Ba-NCO + 3 H2O 2 NH3 + 2 CO2 + ½ O2).
Absence of water favors the H2 conversion into CO (confirmed by CO detection, until 350 ppm
at 400°C), which is less active than H2 for NOx reduction at low temperature [1]. Moreover,
CO is a precursor or the isocyanate species, which can also explain the higher ammonia selectivity in absence of water in the feed stream.
Without CO2 in the feed stream, H2 conversion into CO is not possible, which is favorable for
the NOx reduction. Another consequence is that the formation of isocyanate species is not expected since there is no other carbon source in the used reaction mixture. However, even if the NH3 selectivity is dramatically lowered in absence of CO2, this compound is still
Finally, water induces a positive effect on the reduction step (conversion and selectivity), by limiting the hydrogen transformation into CO via the reverse WGS. On the contrary, CO2 favors
the fast NOx desorption during the rich pulses and promotes the hydrogen transformation into CO which is less efficient for the NOx reduction and leads to higher ammonia formation rate via the isocyanate pathway.
All other results in this study were obtained with both H2O and CO2 in the feed stream.
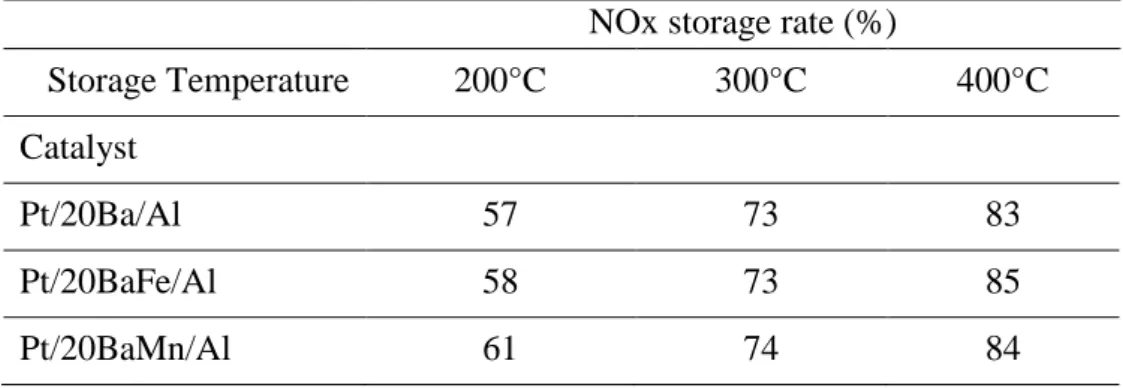
Table 3: NOx storage rate (%) for 60s. Catalyst (60mg) is submitted to 57.4 µmolNOx/g in 60s.
Influence of H2O and CO2 for Pt/20Ba/Al catalyst.
NOx storage rate (%)
Storage Temperature 200°C 300°C 400°C Catalyst
Pt/20Ba/Al 57 73 83
Pt/20BaFe/Al 58 73 85
Pt/20BaMn/Al 61 74 84
3.1.2.3. Influence of the hydrogen concentration in the rich pulses
First, preliminary tests were performed in order to estimate the hydrogen consumption due to the mixing of the lean and rich periods compared with the H2 consumption used for the NOx
reduction. Tests were carried out with 3% H2 in the rich pulses, but without NOx in the lean
periods. Unfortunately, it was observed that the H2 consumptions are similar with or without
NO in the lean periods. As a consequence, it can be deduced that (i) a large part of the reducing agent can react with oxygen, indicating the mixing of the rich and lean mixtures; (ii) it is not possible to evaluate the H2 consumption linked with the NOx reduction when the complete
mixture is used; (iii) H2 should react preferentially with the stored NOx rather than with the
remaining oxygen from the lean periods.
In order to study the influence of the hydrogen concentration on the NOx conversion and the ammonia selectivity, H2 concentration in the rich pulses was varied between 1 and 6%. In
addition, tests were performed with a higher catalyst amount (140 mg instead of 60mg previously) to ensure a possible complete hydrogen conversion.
Results obtained at 400°C are reported in Figure 2. Increasing the H2 concentration from 1 to
2.5% leads to a significant enhancement of the NOx conversion, from 28 to 77%. In this H2
concentration range, H2 is fully converted and nearly no ammonia is detected. Further increase
of the H2 concentration leads only to a small increase of the NOx conversion. It varies from
83% to 87% when the H2 concentration increases from 3% to 6%. In the same time, the
ammonia selectivity continuously raises, it reaches 42% with 6% H2 in the rich pulses. Finally,
at 400°C, when the introduced H2 is totally converted, the NOx conversion is limited by the
reducer amount, but the NOx conversion is very selective in N2. On the contrary, when residual
hydrogen remains, ammonia selectivity dramatically increases even if the NOx conversion is not total.
Figure 2: Pt/20Ba/Al catalyst (140mg): NOx storage/reduction efficiency test at 400°C. NOx conversion (%) into N2 ( ) and into NH3 ( ) and related data. Influence of H2 concentration in
the rich pulses (1-6%).
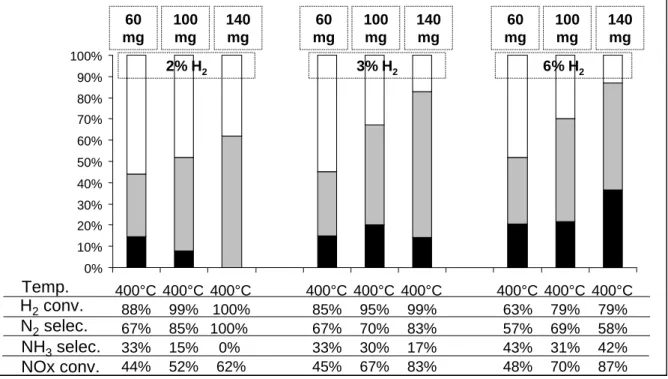
In order to obtain further information about the possible reactions occurring throw the catalytic bed, tests with catalyst amounts of 60, 100 and 140 mg were performed with 2%, 3% and 6% H2 in the rich pulses. Tests were done at 200, 300 and 400°C and the same trends were observed
for the three studied temperature. Results obtained at 400°C are reported in Figure 3. As expected, the NOx conversion increases when the catalyst amount increases whatever the concentration of hydrogen in the rich pulses. No crucial information is obtained with 6%H2 in
the rich pulses. The same behavior is obtained with the three tested catalyst masses: the selectivity of the reduction is rather similar and some hydrogen always remains. Whatever the catalyst mass, the same properties are observed along the catalytic bed. More interesting results are obtained with 2% H2 in the rich pulses. The increase of the catalyst mass leads to both an
enhancement of the NOx conversion and a decrease of the ammonia selectivity. In order to explain this result, the 140 mg catalytic bed can be divided into three parts which corresponds to the results obtained with 60, 100 and 140mg. Figure 3 indicates that ammonia and remaining hydrogen from the first 60mg catalytic bed react with the stored NOx on the end of the 100mg catalytic bed. Hydrogen is then nearly totally converted and a smaller ammonia amount is still available for the end of the 140mg catalytic bed. As no ammonia is observed at the outlet of the 140mg catalytic bed whereas the NOx conversion increases, it induces that ammonia can react with the stored NOx to form N2.
An intermediary behavior is observed with 3%H2 in the rich pulses. Increasing the catalyst mass
from 60mg to 100mg leads to the same results as those obtained with 6%H2: nitrogen and
ammonia amounts increase at the reactor outlet and the introduced H2 is not fully converted.
Increasing the catalyst mass from 100mg to 140mg leads to similar results than those obtained
H2conv. N2selec. NH3selec. NOx conv. 1% H2 1,5% H2 2% H2 2,5% H2 3% H2 3,5% H2 4% H2 4,5% H2 5% H2 6% H2 0% 10% 20% 30% 40% 50% 60% 70% 80% 90% 100% 400°C 100% 100% 0% 28% 400°C 100% 100% 0% 44% 400°C 100% 100% 0% 62% 400°C 100% 97% 3% 77% 400°C 99% 83% 17% 83% 400°C 97% 73% 27% 84% 400°C 90% 70% 30% 86% 400°C 88% 66% 34% 86% 400°C 84% 61% 39% 86% 400°C 79% 58% 42% 87% Temp. H2conv. N2selec. NH3selec. NOx conv. 1% H2 1.5% H2 2% H2 2.5% H2 3% H2 3.5% H2 4% H2 4.5% H2 5% H2 6% H2 0% 10% 20% 30% 40% 50% 60% 70% 80% 90% 100% 400°C 100% 100% 0% 28% 400°C 100% 100% 0% 44% 400°C 100% 100% 0% 62% 400°C 100% 97% 3% 77% 400°C 99% 83% 17% 83% 400°C 97% 73% 27% 84% 400°C 90% 70% 30% 86% 400°C 88% 66% 34% 86% 400°C 84% 61% 39% 86% 400°C 79% 58% 42% 87% Temp. H2conv. N2selec. NH3selec. NOx conv. 1% H2 1,5% H2 2% H2 2,5% H2 3% H2 3,5% H2 4% H2 4,5% H2 5% H2 6% H2 0% 10% 20% 30% 40% 50% 60% 70% 80% 90% 100% 400°C 100% 100% 0% 28% 400°C 100% 100% 0% 44% 400°C 100% 100% 0% 62% 400°C 100% 97% 3% 77% 400°C 99% 83% 17% 83% 400°C 97% 73% 27% 84% 400°C 90% 70% 30% 86% 400°C 88% 66% 34% 86% 400°C 84% 61% 39% 86% 400°C 79% 58% 42% 87% Temp. H2conv. N2selec. NH3selec. NOx conv. 1% H2 1.5% H2 2% H2 2.5% H2 3% H2 3.5% H2 4% H2 4.5% H2 5% H2 6% H2 0% 10% 20% 30% 40% 50% 60% 70% 80% 90% 100% 400°C 100% 100% 0% 28% 400°C 100% 100% 0% 44% 400°C 100% 100% 0% 62% 400°C 100% 97% 3% 77% 400°C 99% 83% 17% 83% 400°C 97% 73% 27% 84% 400°C 90% 70% 30% 86% 400°C 88% 66% 34% 86% 400°C 84% 61% 39% 86% 400°C 79% 58% 42% 87% Temp.
with 2%H2: the NOx conversion increases, the ammonia decreases and the introduced H2 is
nearly fully converted.
Then, the ammonia intermediate pathway is clearly putted in evidence for the reduction of the stored NOx with H2. When the introduced hydrogen is totally converted, the ammonia
selectivity tends to be nil because the produced NH3 can react with the remaining stored NOx.
In opposition, if the some hydrogen remains, the ammonia selectivity increases with the amount of excessive hydrogen. It induces that NOx reduction with H2 into ammonia is faster than the
NOx selective catalytic reduction with ammonia. This hypothesis is in accordance with the proposition of Lindholm et all. [39]. They have observed that during a long time rich period of several minutes, ammonia is not emitted at the beginning of the rich phase. They have suggested that the in situ produced ammonia firstly react with the stored NOx. According to Cumaranatunge et all.[40], NH3 is as efficient as H2 for the NOx reduction on Pt/Ba/Al2O3,
which explain the delay for the NH3 emission.
Figure 3: Pt/20Ba/Al catalyst: NOx storage/reduction efficiency test at 400°C. NOx conversion (%) into N2 ( ) and into NH3 ( ) and related data. Influence of H2 concentration in the rich
pulses (2, 3 and 6%) and influence of the catalyst mass (60, 100 and 140mg).
3.1.2.4. NOx SCR with NH3.
In order to confirm the catalyst activity for the NOx SCR with ammonia, additional tests were performed. Two different SCR stoichiometries can be considered, depending on the presence of oxygen. The first one is observed in oxidizing mixture, with an excess of oxygen and corresponds to the following equations: 2NH3 + NO + NO2 2N2 + 3H2O or 2NH3 + 2NO +
½O2 2N2 + 3H2O, known as fast and standard SCR, respectively. The second one
corresponds to a stoichiometric mixture according the reaction 4NH3 + 6NO 5N2 + 6H2O,
named slow SCR. Both conditions were tested between 150°C and 450°C using a 5°C min-1 heating rate with simplified reaction mixtures: 500ppm NH3, 500ppm NO and 2%O2 balanced
0% 10% 20% 30% 40% 50% 60% 70% 80% 90% 100% 400°C 88% 67% 33% 44% 400°C 99% 85% 15% 52% 400°C 100% 100% 0% 62% 400°C 85% 67% 33% 45% 400°C 95% 70% 30% 67% 400°C 99% 83% 17% 83% 400°C 63% 57% 43% 48% 400°C 79% 69% 31% 70% 400°C 79% 58% 42% 87% Temp. H2conv. N2selec. NH3selec. NOx conv. 140 mg 100 mg 60 mg 140 mg 100 mg 60 mg 140 mg 100 mg 60 mg 2% H2 3% H2 6% H2 0% 10% 20% 30% 40% 50% 60% 70% 80% 90% 100% 400°C 88% 67% 33% 44% 400°C 99% 85% 15% 52% 400°C 100% 100% 0% 62% 400°C 85% 67% 33% 45% 400°C 95% 70% 30% 67% 400°C 99% 83% 17% 83% 400°C 63% 57% 43% 48% 400°C 79% 69% 31% 70% 400°C 79% 58% 42% 87% Temp. 0% 10% 20% 30% 40% 50% 60% 70% 80% 90% 100% 400°C 88% 67% 33% 44% 400°C 99% 85% 15% 52% 400°C 100% 100% 0% 62% 400°C 85% 67% 33% 45% 400°C 95% 70% 30% 67% 400°C 99% 83% 17% 83% 400°C 63% 57% 43% 48% 400°C 79% 69% 31% 70% 400°C 79% 58% 42% 87% Temp. H2conv. N2selec. NH3selec. NOx conv. 140 mg 100 mg 60 mg 140 mg 100 mg 60 mg 140 mg 100 mg 60 mg 2% H2 3% H2 6% H2
in N2 for the first considered stoichiometry, and 333ppm NH3 and 500ppm NO balanced in N2
for the slow SCR (mcata: 60 mg ; total flow rate: 12L h-1).
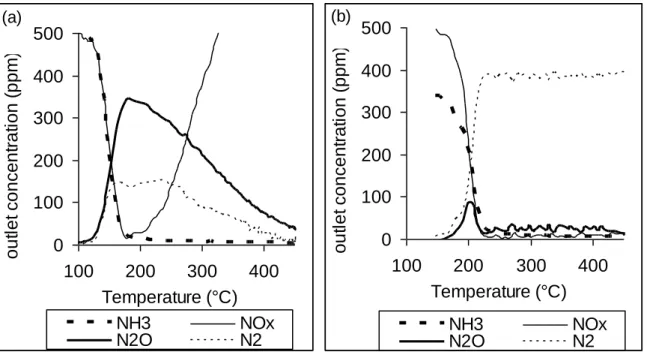
Results obtained with the fast/standard SCR condition are reported in Figure 4a. This condition can be considered since the simultaneous presence of ammonia and oxygen is possible due to the mixing of the lean and rich mixtures. Reaction begins before 150°C and the main product is N2O. The maximum N2O production is observed at 180°C, with a yield of 70%. The
corresponding NOx conversion reaches 80% and NH3 is nearly totally converted. The N2 yield,
which is deduced from the N-balance reaches 20%. For temperatures higher than 210°C, competition with oxidation reaction appears. NH3 is no more detected but NO and NO2
concentration increase whereas N2O and N2 decrease. From this temperature, ammonia is
predominantly oxidized into NOx. These results are not in accordance with those obtained in cycling conditions, especially toward the N2O emission. However, in cycling condition, NOx
reduction occurs during the rich pulses, i.e. in reducing atmosphere. As a consequence, a test was performed with the "slow SCR" condition, without oxygen. Results are reported in Figure 4b. NO and NH3 conversion start near 180°C and they are fully converted in N2 for temperature
higher than 220°C. N2O is observed only near 200°C, with a maximum yield of 20%.
Thus, without oxygen in the feed stream, the NO SCR into N2 only is obtained from 220°C with
the Pt/Ba/Al catalyst and using ammonia as reducer (light-off mode). This result confirms the previous hypothesis about the reaction of ammonia produced in-situ during the rich pulses and the stored NOx to form N2.
Figure 4: NOx SCR with NH3 over Pt/20Ba/Al catalyst (60 mg). (a): fast/standard SCR
light-off test with 500ppm NH3, 500ppm NO and 2%O2 balanced in N2 ; (b): slow SCR light-off test
with 333ppm NH3 and 500ppm NO in N2. Concentration of NH3 (▪▪▪), NOx (─), N2O (…) and
N2 (▬). 0 100 200 300 400 500 100 200 300 400 Temperature (°C) o u tl e t co n ce n tr a ti o n ( p p m ) NH3 NOx N2O N2 (a) 0 100 200 300 400 500 100 200 300 400 Temperature (°C) o u tl e t co n ce n tr a ti o n ( p p m ) NH3 NOx N2O N2 (b)
3.1.3. Conclusion
The N2 selectivity strongly depends on the hydrogen conversion introduced during the rich
pulses. NH3 is emitted since hydrogen is not fully converted, whatever the NOx conversion
rate. The ammonia selectivity increases with the hydrogen excess. Then, the ammonia pathway is clearly put in evidence. In addition, when H2 remains in the reaction mixture, the ammonia
production rate is higher than the ammonia reaction with NOx in order to form N2.
3.2. Influence of Fe and Mn addition.
In a previous study [34], this kind of solids was already studied. However, many points are varying in this new work. For instance, barium and additive loadings are now two times higher and NOx storage tests are performed using the same condition as the lean periods of the testing cycling condition.
The XRD characterization of Pt/20BaFe/Al (diffractogramms not shown) shows that, in addition to BaCO3 and BaAl2O4, characteristic diffraction peaks of Fe2O3 are also detected. No
other phase including iron is detected. For Pt/20BaMn/Al, the BaMnO3 phase was detected. In
opposition with previous results obtained with lower Ba and Mn loading, Mn2O3 is also
detected.
The storage capacities of the modified catalysts are compared with Pt20Ba/Al in Table 3. Whatever the temperature test, no significant influence of the additive is observed. Note that tests performed for 100s with lower barium and additive loadings showed that Mn and Fe addition slightly improved the NOx storage capacity [34]. This observation clearly puts in evidence the crucial role of the storage kinetic in addition with the total storage capacity.
3.2.1. Influence of Fe addition on the NSR activity.
It was previously found that Pt/10FeBa/Al exhibited a lower NOx conversion than Pt/10Ba/Al, [34]. Same results are obtained with Pt/20FeBa/Al. Even if neither the NOx storage rate nor the NO oxidation rate (deduced from the NO2/NOx ratio at saturation) are modified by iron
addition, the NOx conversion decreases of about 30-40% depending on the temperature tests. It was proposed that some Pt-Fe interaction can occur [41], and decrease the platinum activity. Moreover, Luo et all. [42] have showed that iron addition in a Pt/Ba/Al2O3 system decreases
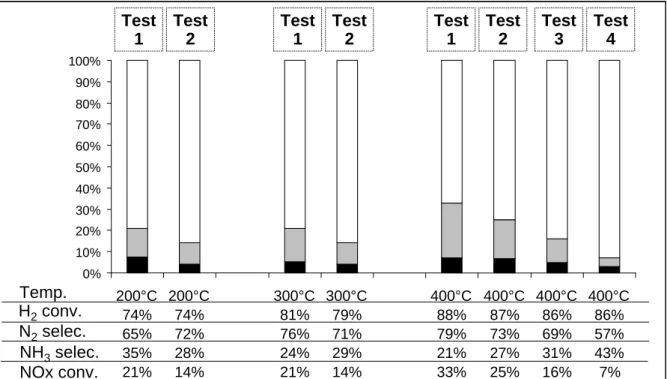
Pt-Ba interaction due to the platinum encapsulation in the Fe/FeOx lattice after repeated redox cycles for sulfur poisoning regeneration. Then, some repeatability tests in cycling condition were carried out with the iron modified catalyst. Successive tests were performed with the same sample. Note that before each test, the catalyst is submitted to a reducing treatment at 450°C for 15 min (rich mixture) in order to clean the catalyst surface, especially toward adsorbed NOx. Figure 5 shows that the catalyst deactivation continue test after test, leading to a very low activity after four consecutive measurements. Then, the poisoning effect of iron addition is again put in evidence. Note that with the other catalysts tested in this study, there is no evolution of the catalyst activity during such consecutive tests.
Figure 5: Pt/20BaFe/Al catalyst (60mg): NOx storage/reduction efficiency test at 200, 300 and 400°C with 3% H2 in the rich pulses. NOx conversion (%) into N2 ( ) and into NH3 ( )
and related data. Evolution of the catalyst behavior test after test (intermediate pretreatment: 450°C, 15 min under rich mixture).
3.2.2. Influence of Mn addition on the NSR activity.
3.2.2.1 Pt/20BaMn/Al catalyst (Mn/Ba molar ratio = 1).
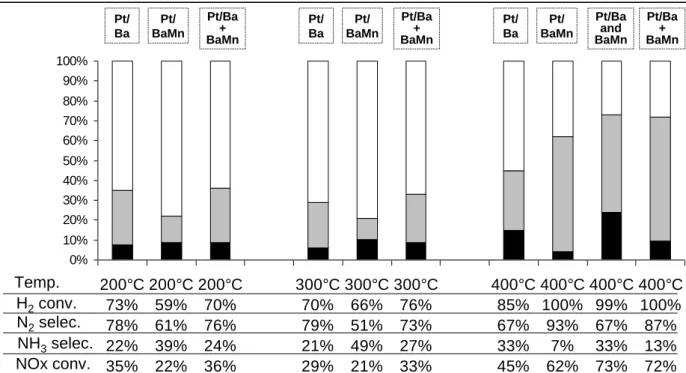
NOx conversions obtained with the manganese modified catalyst are reported in Figure 6. For comparison, Pt/20Ba/Al is also reported. Two different trends are observed depending on the temperature test. At 200 and 300°C, catalyst with Mn exhibits lower NOx conversion and higher ammonia selectivity. On the contrary, test at 400°C showed a beneficial effect of Mn addition, with both a NOx conversion improvement from 45% to 62%, and a lower ammonia selectivity, from 31% to 7%. This low ammonia selectivity is associated with the total hydrogen consumption. It shows again the relation between the ammonia emission and the H2 conversion.
In order to have a better understanding of the role of manganese depending on the temperature test, a 20BaMn/Al sample without platinum was prepared using the same protocol as described in the experimental section, except for the platinum impregnation step which was simulated with an immersion in an ammonia solution. This sample was tested (i) alone and (ii) in association with Pt/20Ba/Al in two consecutive catalytic beds: 60mg of Pt/20Ba/Al and then 60mg of 20BaMn/Al. Catalytic tests results are reported in Figure 6. At 200 and 300°C, the activity of 20BaMn/Al tends to be nil. Then, as expected, results obtained with the association of Pt/20Ba/Al and 20BaMn/Al are similar with those obtained with Pt/20Ba/Al alone. It was also checked that same results are obtained with a mechanical mixture of both powders (results not shown). As described previously, Pt/20Ba/Al and Pt/20BaMn/Al catalysts exhibit similar NOx storage capacities. Then, the negative impact observed in NSR tests at 200°C and 300°C when manganese is added to the reference Pt/20Ba/Al sample is attributed to Pt-Mn interactions
H2conv. N2selec. NH3selec. NOx conv. Test 1 Test 2 Test 1 Test 2 Test 1 Test 2 Test 3 Test 4 0% 10% 20% 30% 40% 50% 60% 70% 80% 90% 100% 200°C 74% 65% 35% 21% 200°C 74% 72% 28% 14% 300°C 81% 76% 24% 21% 300°C 79% 71% 29% 14% 400°C 88% 79% 21% 33% 400°C 87% 73% 27% 25% 400°C 86% 69% 31% 16% 400°C 86% 57% 43% 7% Temp. H2conv. N2selec. NH3selec. NOx conv. Test 1 Test 2 Test 1 Test 2 Test 1 Test 2 Test 3 Test 4 0% 10% 20% 30% 40% 50% 60% 70% 80% 90% 100% 200°C 74% 65% 35% 21% 200°C 74% 72% 28% 14% 300°C 81% 76% 24% 21% 300°C 79% 71% 29% 14% 400°C 88% 79% 21% 33% 400°C 87% 73% 27% 25% 400°C 86% 69% 31% 16% 400°C 86% 57% 43% 7% Temp.
which inhibit the reduction function of the catalyst. At 400°C, the activity of 20BaMn/Al became significant, with a NOx conversion rate of 11% and an ammonia selectivity of 21%. This activity is attributed to manganese since a 20Ba/Al solid exhibits no DeNOx activity (results not shown). Association of Pt/20Ba/Al and 20BaMn/Al leads to higher NOx conversion compared with the addition of their own conversions, and also compared with Pt/20BaMn/Al. Then, platinum allows higher NOx storage on 20BaMn/Al when placed before BaMn/Al. Concerning the role of Mn in the ammonia selectivity, comparison of Pt/20Ba/Al and Pt/20BaMn/Al indicates that in presence of Mn, a part of the produced ammonia react with stored NOx, leading to both NOx conversion improvement and ammonia selectivity decrease. Nevertheless, the hydrogen conversion is then total with Pt/20BaMn/Al, and it could play a crucial role on the ammonia selectivity, as previously discussed with Pt/20Ba/Al catalyst. Supplementary tests were then done with 6%H2 in the rich pulses. In this case, H2 was never
fully converted. With Pt/20Ba/Al, the NOx conversion, the ammonia selectivity and the hydrogen conversion are 48%, 43% and 63%, respectively. Addition of 20BaMn/Al in as a second catalytic bed led to values of 85%, 27% and 81%, respectively. Thus, even if hydrogen conversion is not total, manganese participates to the NOx reduction with ammonia.
Figure 6: NOx storage/reduction efficiency test at 200, 300 and 400°C with 3% H2 in the rich
pulses. NOx conversion (%) into N2 ( ) and into NH3 ( ) and related data for Pt/20Ba/Al
(60mg, noted Pt/Ba), Pt/20BaMn/Al (60mg, noted Pt/BaMn), 20BaMn/Al (60mg, noted BaMn), and association of both Pt/20Ba/Al (60mg) and 20BaMn/Al (60mg), (i) in two consecutive beds (noted Pt/Ba+BaMn) or (ii) mechanically mixed (noted Pt/Ba and BaMn).
0% 10% 20% 30% 40% 50% 60% 70% 80% 90% 100% 200°C 73% 78% 22% 35% 200°C 59% 61% 39% 22% 200°C 70% 76% 24% 36% 300°C 70% 79% 21% 29% 300°C 66% 51% 49% 21% 300°C 76% 73% 27% 33% 400°C 85% 67% 33% 45% 400°C 100% 93% 7% 62% 400°C 99% 67% 33% 73% 400°C 100% 87% 13% 72% H2conv. N2selec. NH3selec. NOx conv. Temp. Pt/ Ba Pt/ BaMn Pt/Ba + BaMn Pt/ Ba Pt/ BaMn Pt/Ba + BaMn Pt/ Ba Pt/ BaMn Pt/Ba + BaMn Pt/Ba and BaMn 0% 10% 20% 30% 40% 50% 60% 70% 80% 90% 100% 200°C 73% 78% 22% 35% 200°C 59% 61% 39% 22% 200°C 70% 76% 24% 36% 300°C 70% 79% 21% 29% 300°C 66% 51% 49% 21% 300°C 76% 73% 27% 33% 400°C 85% 67% 33% 45% 400°C 100% 93% 7% 62% 400°C 99% 67% 33% 73% 400°C 100% 87% 13% 72% H2conv. N2selec. NH3selec. NOx conv. Temp. Pt/ Ba Pt/ BaMn Pt/Ba + BaMn Pt/ Ba Pt/ BaMn Pt/Ba + BaMn Pt/ Ba Pt/ BaMn Pt/Ba + BaMn Pt/Ba and BaMn
Further investigations were done in order to study the influence the hydrogen concentration in the rich pulses on the behavior of Pt/20BaMn/Al catalyst. Results are reported in Figure 7. Until 3%H2 in the rich pulses, NOx conversion increases with hydrogen concentration and ammonia
selectivity remains low, while the introduced hydrogen is fully converted. For higher hydrogen concentration, the NOx conversion becomes near constant at around 70% but the ammonia selectivity significantly increases, and reaches 40% with 8% H2. In fact, the same behavior was
observed with 140mg of Pt/20Ba/Al. Figure 7 compares the results obtained with both catalysts using the same conditions (mcata=60mg). For low hydrogen concentrations, NOx conversions
are similar but the NH3 emission is significantly lower with the Mn modified catalyst, for which
the introduced hydrogen is fully converted. For high hydrogen concentrations, H2 remains at
the rector outlet for both catalysts and ammonia selectivity is always lower with the Mn modified catalyst even if it tends to be equivalent for the highest tested hydrogen concentrations. However, the NOx conversion is approximately 40% higher with Pt/BaMn/Al. Then, the beneficial effect of the manganese addition for the NOx reduction with the in-situ produced NH3 is significant but the NOx conversion is still limited.
Figure 7: NOx conversion rate (full symbols) and NH3 selectivity (open symbols) measured at
400°C depending on hydrogen concentration in the rich pulses for Pt/20Ba/Al (60mg, ,) and Pt/20BaMn/Al (60mg, , ).
3.2.2.2 Influence of the manganese loading
Finally, the influence of the manganese loading was studied. In addition to the Pt/20BaMn/Al catalyst previously studied (7.2wt% Mn, Mn/Ba molar ratio of 1), two other catalysts were prepared with Mn/Ba molar ratio of 0.5 and 1.5. They are noted Pt/20BaMn0.5/Al and Pt/20BaMn1.5/Al, respectively. The increase of the manganese content leads to a significant decrease of the specific surface area for Pt/20BaMn1.5/Al. It drops from 127 m²g-1 for
Pt/20Ba/Al, to 102 m²g-1. The XRD analysis of the manganese containing catalysts shows that the intensities of the characteristic diffraction peaks of BaMnO3 and Mn2O3 increase with Mn
0 20 40 60 80 100 1 2 3 4 5 6 7 8 [H2] (%) N O x c o n v e rs io n (% ) 0 20 40 60 80 100 1 2 3 4 5 6 7 8 [H2] (%) NH 3 se le ct ivi ty (% ) Pt20BaMn Série2 0 20 40 60 80 100 1 2 3 4 5 6 7 8 [H2] (%) NH 3 se le ct ivi ty (% ) Pt20BaMn Série2
loading (XRD patterns not shown). The H2-TPR measurements in the 20-800°C temperature
range (results not shown) indicate that the average oxidation degree increases from 3.2 for Pt/20BaMn0.5/Al to 3.7 pour Pt/20BaMn1.5/Al, assuming a MnII oxidation state at the end of the test. The increase of MnIV species with Mn loading was already showed on alumina by Kapteijn et all. [43]. For the studied Ba-Mn-Al catalysts, the formation of BaMnO3 can also
participate to the enhancement of MnIV species.
Concerning the NOx storage capacity measured after 60s, there is no significant influence of the Mn loading. Similar NO2/NOx ratios were also observed after NOx saturation,
indicating similar behaviors for the NO into NO2 oxidation reaction. NOx removal
efficiencies in cycling condition were measured and results are reported in Figure 8. At 200 and 300°C, the inhibiting effect of the manganese addition is comparable whatever the manganese loading: The NOx conversion decreases and the ammonia selectivity increases with Mn containing catalysts. Some differences appear at 400°C. Mn addition leads to an improvement of the NOx conversion, an optimum of 62% is observed with Pt/BaMn/Al (Mn/Ba molar ratio = 1). For the higher Mn loading, the NOx conversion decreases to 58%. It can be attributed to the loss of approximately 20% for the specific surface area. However, the ammonia selectivity continuously decreases with the manganese loading, at 18%, 7% and 5% for Pt/20BaMn0.5/Al, Pt/20BaMn/Al and Pt/20BaMn1.5/Al, respectively. Without manganese, the ammonia selectivity is 31%. These results show again the role of manganese on the NOx reduction selectivity.
Figure 8: NOx storage/reduction efficiency test at 200, 300 and 400°C with 3% H2 in the rich
pulses. NOx conversion (%) into N2 ( ) and into NH3 ( ) and related data. Influence of
manganese loading (expressed as Mn/Ba molar ratio) in Pt/20BaMnX/Al catalysts. H2conv. N2selec. NH3selec. NOx conv. Mn /Ba 0.5 Mn /Ba 1 Mn /Ba 1.5 0% 10% 20% 30% 40% 50% 60% 70% 80% 90% 100% 200°C 73% 78% 22% 35% 200°C 58% 59% 41% 20% 200°C 59% 61% 39% 22% 200°C 61% 61% 39% 23% 300°C 70% 79% 21% 29% 300°C 65% 55% 45% 22% 300°C 66% 51% 49% 21% 300°C 67% 51% 49% 22% 400°C 90% 67% 33% 45% 400°C 91% 82% 18% 56% 400°C 100% 93% 7% 62% 400°C 100% 95% 5% 58% Temp. Mn /Ba 0.5 Mn /Ba 1 Mn /Ba 1.5 Mn /Ba 0.5 Mn /Ba 1 Mn /Ba 1.5 H2conv. N2selec. NH3selec. NOx conv. Mn /Ba 0.5 Mn /Ba 1 Mn /Ba 1.5 0% 10% 20% 30% 40% 50% 60% 70% 80% 90% 100% 200°C 73% 78% 22% 35% 200°C 58% 59% 41% 20% 200°C 59% 61% 39% 22% 200°C 61% 61% 39% 23% 300°C 70% 79% 21% 29% 300°C 65% 55% 45% 22% 300°C 66% 51% 49% 21% 300°C 67% 51% 49% 22% 400°C 90% 67% 33% 45% 400°C 91% 82% 18% 56% 400°C 100% 93% 7% 62% 400°C 100% 95% 5% 58% Temp. Mn /Ba 0.5 Mn /Ba 1 Mn /Ba 1.5 Mn /Ba 0.5 Mn /Ba 1 Mn /Ba 1.5
4. Conclusion
The NOx reduction selectivity over Pt/Ba/Al catalyst tested in lean/rich cycling condition strongly depends on the hydrogen conversion introduced in the rich pulses. In fact, this catalyst is able to reduce NOx into N2 using NH3 as reducer, but the ammonia formation rate via the
NOx reduction by H2 is higher than the ammonia reaction rate with NOx to form N2. Then, NH3
is emitted since hydrogen is not fully converted, whatever the NOx conversion rate, and the ammonia selectivity increases with the hydrogen excess.
If H2O and CO2 both inhibit the NOx storage, their roles differ for the NOx reduction activity
and selectivity. In accordance with the ammonia formation route via the isocyanate pathway, water inhibits the ammonia formation because it limits the formation of CO via the reverse WGS reaction, CO being necessary for isocyanate formation.CO2 is known to favor the fast
NOx desorption during the rich pulses and to promote the hydrogen transformation into CO which is less efficient for the NOx reduction. In addition, this CO formation also favors the ammonia formation via the isocyanate route.
Fe addition to Pt/20Ba/Al leads to a strong deactivation, probably due to interaction between iron and platinum, enhanced during the redox cycles.
Mn addition induces different behaviors depending on the temperature test. At low temperature (200-300°C), a significant decrease is observed, which is only attributed to the reducing step. Mn acts as a poison for the catalyst. In opposition, at 400°C, a significant enhancement of the NOx conversion is observed after Mn addition. In the same time, the ammonia selectivity decreases. Thus, Mn favors the NOx reduction with ammonia, even if the introduced hydrogen is not fully converted. However, when a large hydrogen excess is introduced, the ammonia selectivity tends to be similar with the one observed with Pt/20Ba/Al.
Finally, the NOx conversion was largely improved at 400°C with manganese addition. However, the NOx conversion at low temperature is still a problem and further investigations were done with Ce and Ce-Mn addition with interesting results. This study is detailed in part II of this work.
References
[1] W. S. Epling, L. E. Campbell, A. Yezeerets, N. W. Currier, J. E. Parks II, Catal. Rev. 46 (2004) 163-245.
[2] T. Kobayashi, T. Yamada, K. Kayano, Society of Automotive Engineers, Inc. Technical Papers 970745 (1997) 63.
[3] S. Matsumoto, Cattech 4 (2000) 102-109.
[4] C. Sedlmair, K. Seshan, A. Jentys, J.A. Lercher, Catal. Today 75 (2002) 413-419. [5] E.C. Corbos, X. Courtois, N. Bion, P. Marecot, D. Duprez, Appl. Catal. B 80 (2008) 62– 71.
[6] J. Li, J. Theis, W. Chun, C. Goralski, R. Kudla, J. Ura, W. Watkins, M. Chattha, R. Hurley, SAE Technical Paper no 2001-01-2503 (2001).
[7] D. Uy, A.E. O’Neill, J. Li and W.L.H. Watkins, Top. Catal. 95 (2004) 191-201.
[8] M. Casapu, J.D. Grunwaldt, M. Maciejewski, M. Wittrock, U. Göbel and A. Baiker, App. Catal. B 63 (2006) 232-242.
[9] R.D. Clayton, M.P. Harold, V. Balakotaiah, Appl. Catal. B 84 (2008) 616-630. [10] L. Lietti, I. Nova, P. Forzatti, J. Catal. 257 (2008) 270-282.
[11] I. Nova, L. Lietti, L. Castoldi, E. Tronconi and P. Forzatti, J. Catal. 239 (2006), 244–254. [12] Z. Liu and J.A. Anderson, J. Catal. 224 (2004) 18-27.
[13] H. Abdulhamid, E. Fridell, M. Skoglundh, Top. Catal. 30/31 (2004) 161-168.
[14] E.C. Corbos, M. Haneda, X. Courtois, P. Marecot, D. Duprez, H. Hamada, Appl. Catal. A 365 (2009) 187-193.
[15] I. Nova, L. Castoldi, L. Lietti, E. Tronconi, and P. Forzatti, Top. Catal. 42/43 (2007) 21-25.
[16] A. Lindholm, N.W. Currier, A. Yezerets and L. Olsson, Topics in Catal. 42–43 (2007) 83-89.
[17] J.A. Pihl, J.E. Parks II, C.S. Daw, T.W. Root, SAE Technical Paper, 01-3441 (2006).
[18] A. Lindholm, N. W. Currier, E. Fridell, A. Yezerets, L. Olsson, Appl. Catal. B 75 (2007) 78-87.
[19] T. Lesage, C. Verrier, P. Bazin, J. Saussey and M. Daturi, Phys. Chem. Chem. Phys. 5
(2003) 4435-4440.
[20] T. Lesage, C. Verrier, P. Bazin, J. Saussey, S. Malo, C. Hedouin, G. Blanchard and M. Daturi, Top. Catal. 30–31 (2004) 31-36.
[21] L. Castoldi, I. Nova, L. Lietti, P. Forzatti, Catal. Today 96 (2004) 43-52.
[22] J.-S. Choi, W.P. Partridge, W.S. Epling, N.W. Currier, T.M. Yonushonis, Catal. Today 114 (2006) 102-111.
[23] E.C. Corbos, X. Courtois, N. Bion, P. Marécot, D. Duprez Appl.Catal. B 76 (2007) 357-367.
[24] K. Eguchi, T. Kondo, T. Hayashi, H. Arai, Appl. Catal. B 16 (1998) 69-77. [25] J. Dawody, M. Skoglundh, E. Fridell, J. Mol. Catal. A 209 (2004) 215-225. [26] J. Xiao, X. Li, S. Deng, F. Wang, L. Wang, Catal. Commun. 9 (2008) 563-567. [27] U. Bentrup, A. Bruckner, M. Richter, R. Fricke, Appl. Catal. B 32 (2001) 229-241. [28] X. Liang, J. Li, Q. Lin, K. Sun, Catal. Commun. 8 (2007) 1901-1904.
[29] Z. Wu, B. Jiang, Y. Liu, Appl. Catal. B 79 (2008) 347-355.
[30] J. Huang, Z. Tong, Y. Huang, J. Zhang, Appl. Catal B 78 (2008) 309-314. [31] Q. Lin, J. Li, L. Ma, J. Hao, Catal. Today, 151 (2010) 251-256.
[32] K. Yamazaki, T. Suzuki, N. Takahasi, K. Yojota, M. Sugiura, Appl. Catal. B 30 (2001) 459-468.
[33] P T. Fanson, M.R. Horton, W.N. Delgass, J. Lauterbach, Appl. Catal. B 46 (2003) 393-413.
[34] P.N. Lê, E.C. Corbos, X. Courtois, F. Can, S. Royer, P. Marecot, D. Duprez, Top. Catal. 52 (2009) 1771-1775.
[35] E.C. Corbos, X. Courtois, F. Can, P. Marécot, D. Duprez, Appl. Catal. B 84 (2008) 514-523.
[36] G.W. Graham, H.W. Jen, H.W. Theis, R.W. McCabe, Catal. Lett. 93 (2004) 3-6. [37] D.H. Kim, Y.H. Chin, I.H. Kwak, J. Szanyi, C.H.F. Peden, Catal. Lett. 105 (2005) 259-268.
[38] S. Balcon, C. Potvin, L. Salin, J.F. Tempère, G. Djega-Mariadassou, Catal. Lett., 60 (1999) 39-43.
[39] A. Lindholm, N. W. Currier, E. Fridell, A. Yezerets, L. Olsson, Appl. Catal. B. 75 (2007) 78-87.
[40] L. Cumaranatunge, S.S. Mulla, A. Yezerets, N.W. Currier, W.N. Delgass and F.H. Ribeiro, J. Catal. 246 (2007) 29-34.
[41] T. Schmauke, M. Menzel, E. Roduner, J. Mol. Catal. A 194 (2003) 211-225.
[42] J-Y. Luo, M. Meng, Y-Q. Zha, Y-N. Xie, T-D. Hu, J. Zhang, T. Liu, Appl. Catal. B. 78 (2008) 38-52.
J.M. Jehng, I.E. Wachs, J. Catal. 150 (1994) 94-104.