Design and Synthesis of Polymers for Corona Phase Molecular Recognition
(CoPhMoRe) of Carbohydrates
by
Jiyoung Ahn
B.S. Chemical and Biological Engineering Yonsei University
SUBMITTED TO THE DEPARTMENT OF CHEMICAL ENGINEERING IN PARTIAL FULFILLMENT OF THE REQUIREMENTS FOR THE DEGREE OF
Doctor of Philosophy
AT THE
MASSACHUSETTS INSTITUTE OF TECHNOLOGY
Sept 2017
2017 Massachusetts Institute of Technology. All rights reserved.
Signature
Signature of A uthor: ...redacted
Department of Chemical EngineeringJune 7th 2017
Signature redacted
C ertified by: ... ...Michael S. Strano Professor of Chemical Engineering Thesis Supervisor A ccepted by : ... MASSACHLS IT11-OF TECHNOLOGY
MAY
2 3
2019
LIBRARIES
Signature redacted
Daniel Blankschtein Professor of Chemical Engineering Chairman, Committee for Graduate Students77 Massachusetts Avenue Cambridge, MA 02139
MfTLibraries
http://Iibraries.mit.edu/askDISCLAIMER NOTICE
Due to the condition of the original material, there are unavoidable
flaws in this reproduction. We have made every effort possible to
provide you with the best copy available.
Thank you.
Design and Synthesis of Polymers for Corona Phase Molecular Recognition
(CoPhMoRe) of Carbohydrates
by
Jiyoung Ahn
SUBMITTED TO THE DEPARTMENT OF CHEMICAL ENGINEERING
ON JUNE
7th2014 IN PARTIAL FULFILLMENT OF THE REQUIREMENTS FOR THE
DEGREE OF
Doctor of Philosophy in Chemical Engineering
ABSTRACT
The molecular recognition of carbohydrates is difficult to realize synthetically due t& their relatively low affinity for a wide range of substrates, yet this recognition is the underpinning of human immunity, cell signaling, and glycobiology. For the past decade, significant effort has been made in this field to create new technologies to profile glycans and carbohydrates.
Corona Phase Molecular Recognition (CoPhMoRe), the concept introduced from Strano group, generates a nanoparticle coupled polymer phase capable of recognizing a specific molecule with high affinity and selectivity. CoPhMoRe has been successfully demonstrated using polymer wrapped single walled carbon nanotubes, resulting in molecular recognition complexes, to date, for dopamine, estradiol, riboflavin, L-thyroxine, and the protein fibrinogen, utilizing combinatorial library screening. As an alternative to this empirical, library screening, we first solve the mathematical formulation that we introduce as the CoPhMoRe inverse problem to provide a theoretical basis for understanding certain types of CoPhMoRe recognition.
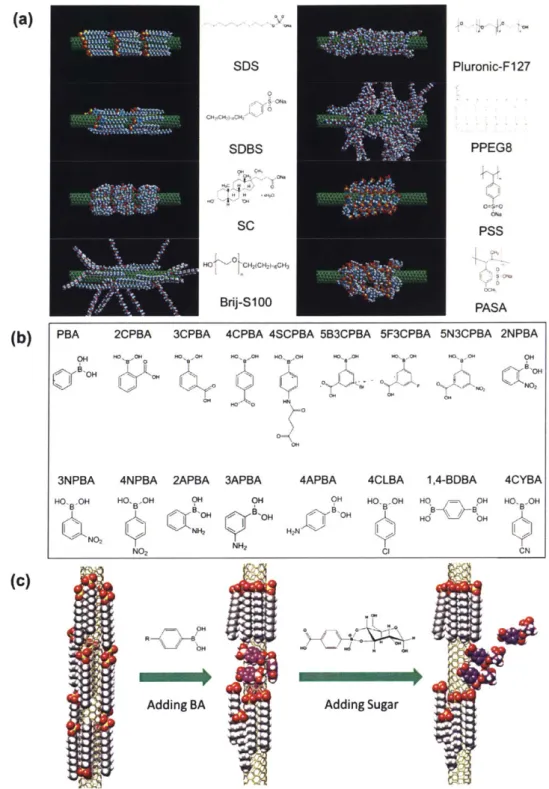
In addition, we demonstrate that a polymer or surfactant corona phase surrounding a single walled carbon nanotube can substantially modify the selectivity of various pre-adsorbed phenyl-boronic acids (PBA) for mono-, di- and polysaccharides. Based on these findings, a simple and robust RAFT polymerization process is employed to produce novel and distinct classes of water-soluble PBA-based polymers. These polymers in SWNT corona phases demonstrate enhanced selectivity towards specific sugar alcohols, which differ only in the orientation of the hydroxyl groups. By changing the polymer backbone structure,
highly selective D-Arabinose sensor was developed and used to differentiate D-Arabinose from
L-Arabinose for the first time. Finally we developed a glucose sensor that can measure glucose concentration instantaneously by detecting changes in local refractive index.
Thesis Supervisor: Michael S. Strano
Acknowledgements
First of all, I would like to thank my thesis advisor, Professor Strano. This thesis would not have been possible without the infinite support from him. Since the time I joined the Strano lab at the end of my second year, Professor Strano has been such a great advisor, available all the time to have any types of scientific discussions and to answer all sorts of research questions that I have. His passion and depth of knowledge always astonished me and gave me such a big driving force to learn and explore. In every aspect he has given me great opportunities to experience and achieve many skill sets that I couldn't have
learned otherwise. I truly believe that all the lessons I learned from him will benefit my career for the rest of my life. On top of his academic excellence, his leadership and communication in subgroups has encouraged me and taught me how to overcome any difficulties that had arisen during Ph.D.
I would like to also thank my committee members, Professor Swager, and Professor Anderson. I found
myself to be very fortunate to be advised by such brilliant professors simultaneously for the past four years. They have led me to take the right direction pursuing my research project and always provided me with insightful comments and recommendations to improve the scientific quality of my thesis.
I feel grateful to Professor Cohen, Professor Rubner and Professor Ribbeck who co-advised me for the
first two years of my Ph.D. Being co-advised by three advisors and working with graduate students in three different departments helped me to learn how to conduct research taking multidisciplinary
approaches and significantly improved my communications skills to deliver ideas to a wide range of audiences. They are the ones who transformed me from an undergraduate student to an actual graduate student who knows what the research is.
I thank the entire Strano group members for the great experiences and wonderful memory. I have
interacted a lot of talented undergraduate/graduate students, Post-docs in Strano lab. Especially I would like to thank Dr. Gili Bisker, Dr. Nicole Iverson, Dr. Pingwei Liu for being so supportive and providing a
great guidance for my research. I want to also that Micheal Lee, Naveed Bakh, Youngwoo Son, Minkyung Park who have been great friends and colleagues in Strano lab.
I would like to acknowledge KSACE and my Korean friends at MIT. Especially I would like to thank
my friend Minae Ouk, and Siwon Choi who have been my best friends and mentors for the past 6 years of my time at MIT. I feel so blessed to have them around and I strongly think I couldn't have survived till graduation without them. Along with them I feel grateful to Prof. Hyomin Lee who has been giving me
infinite mental support as well as being an amazing mentor. I admire him not only for his academic excellence but also for his great personality and sense of humor. Furthermore, I would like to share my gratitude to friends I met at Sloan, especially my BCG fellows Seohyun Choi, Bokyum Kim, and
Kyoungjin Ku for giving me lots of career and life advices. Lastly, but certainly not least, I would like to thank to my family members who have been supporting me with the great love for the entire time of my
Table of Contents
1. List of Figures... 10
2. List of Tables ... 14
4. Introduction and Background ... 15
4.1 Introduction ... 15
4.2 Electrochem ical Glucose Sensor... 17
4.2.1 Enzym atic Glucose Sensor... 17
4.2.2 N on-Enzym atic Glucose Sensor... 20
4.3 Optical G lucose Sensor ... 24
4.3.1' Absorption/Transmission ... 24
4.3.2 Therm al Em ission... 25
4.3.3 D iffusion Reflection ... 25
4.3.4 Sources of Error and Corrective M ethods ... 26
4.3.5 Advanced in Error Correction ... 26
4.3.6 Photoacoustics ... 27
4.3.7 Ram an... 27
4.3.8 Polarization... 28
4.3.9 Optical coherence tom ography (OCT)... 29
4.3.10 Others ... 29
4.4 G lucose Sensor Based on Em erging Technologies... 30
4.4.1 Electrochem ical Enzym atic Sensors Using N anom aterials... 30
4.4.2 Electrochem ical Non-Enzymatic Sensors Using N anomaterials ... 32
4.4.3 Optical Sensors Using Nanom aterials... 33
5. Modification of the Saccharide Affinity of Phenyl Boronic Acids using Single Walled
Carbon Nanotube Corona Phases... 37
5 .1 Introd uction ... 37
5.2 Materials and Methods... 42
5.3 Results and Discussion... . 44
5.4 C onclusion ... 57
6. Mathematical Formulation and Solution of the CoPhMoRe Inverse Problem for Helically W rapping Polymer Corona Phases on Cylindrical Substrates... 59
6 .1 Introduction ... 59
6.2 Theoretical Basis - Case 1: Molecular Recognition Interstitially within a Regular Helix... 62
6.3 Theoretical Basis - Case 2: Molecular Recognition on a Distorted Helix ... 66
6.4 Result and Discussion ... 69
6.4.1 Observed pitch values of DNA wrapping around SW CNT ... 69
6.4.2 Ratio of hydrophilic and hydrophobic moieties and the resulting recognition ... 69
6.4.3 Functionalization to enhance selectivity ... 71
6.4.4 Binding potential maps - Molecular Simulation for Case I ... 72
6.4.5 Effect of the persistence length on helical wrapping and recognition... 77
6.4.6 Distorted Helix Conformation - Molecular Simulation for Case 2 ... 78
6 .5 C onclusion ... 79
7. Phenylboronic Acid co-Polymers enabling Highly Selective Molecular Recognition of Carbohydrates within Nanotube Corona Phases... 83
7 .1 Introd uction ... 83
7.2 Materials and Methods... 84
7.5 Appendix ... 94
8. A Nanoparticle Displacement Mechanism of Optical Saccharide Detection... 108
8.1 Introduction... 108
8.2 M aterials and M ethods... 110
8.3 Results and Discussion... I11 8.4 Conclusion ... 122
8.5 Appendix ... 122
9. Sum m ary and future w ork ... 130
9.1 Thesis Sum m ary...
130
9.2 Future Research Directions... 130
1. LIST OF FIGURES
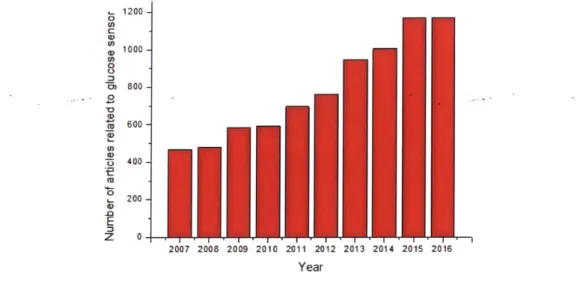
Figure 4-1: Number of articles published from 2007 to 2016 related to glucose sensor (data acquired
through W eb of K now ledge®)... 16
Figure 4-2: Outline of this review. Mainly the past 10 years of advances are covered for each section... 17
Figure 4-3: Assembly of aligned SWNTs for enzymatic glucose sensor, reprinted with permission from reference14 7 (Angewandte Chemie-International Edition 2004, 43 (16), 2113-2117,copyright 2004 Wiley). ... 3 2 Figure 5-1 Schematic of Surfactant Corona Phases... 39
Figure 5-2 UV-vis-nIR absorption spectrum of SWNTs wrapped by different reagents... 45
Figure 5-3 Heatmap of fluorescence intensity change caused by boronic acids and sugar responses... 48
Figure 5-4 Scatter plot of absolute sugar response vs. absolute boronic acid response ... 52
Figure 5-5 Proposed equilibrium, transient ramen spectra analysis of SWNT, and kinetic studies... 53
Figure 5-6 Calibration curve of the response of CSA on 3CPBA+PASA-SWNT complex, which demonstrates a non-linear change of the detection signal with the analyte concentration. The Langmuir adsorption equation provides a good fit to the experimental data with a constant A = 0.15... 57
Figure 6-1 (a) An analyte projected onto a surface with functional groups at p1 and p2. (b) Linear polymer with functional groups at gl, and g2, such that they are co-localized with the functional groups of the analyte when wrapped around a carbon nanotube. (c) Polymer and analyte presented in the 71, z plane. (d) Parametric functions of the edges of the polymer and the matching of the functional group locations. (e) Illustration of available functional groups on a potential target analyte, human serum album in.99 ... 63
Figure 6-2 Schematic illustration of a polymer in which repeating units of hydrophobic and hydrophilic segments form unique binding pockets for a specific analyte when adsorbed onto the surface of a single w alled carbon nanotube. ... 66
fz = const, (b) fz = 1 + sinz, (c) fz = z2e - z22. (d), (e), and (f) The corresponding linear mapping of the hydrophilic and hydrophobic segments to a 1-dimensional space, respectively. (g) An example of
f
(z) chosen to fit a 2-dimensional cross section of the protein albumin. ... 68Figure 6-4 (a) Illustration of a DNA backbone stacked onto the surface of SWCNT, presenting various functional groups to the surrounding environment. (b) DNA nucleotide with available sites for
functionalization ... 72 Figure 6-5 (a) Trinitrotoluene (TNT) molecule. (b) Representation of TNT molecules in our simulation. The central bead stands for the benzene ring, the three blue beads are the nitro groups, and the cyan bead is the m ethyl group... .... 74 Figure 6-6 Potential maps for the highly simplified model system considered in this work, illustrating the binding energy of TNT to the helically-wrapped single walled carbon nanotubes for pitch value (a) 0.19 nm, and (b) 0.4 nm. The white rectangles represents the region that is plotted in (c) and (d), respectively. (e) Snapshots of the TNT molecule on the nanotube surface in-between the helical chains of the polymer for 0.19 nm pitch and (f) 0.3 nm pitch. The polymer backbone is plotted in pink, and its side groups appear in yellow and grey... 77
Figure 6-7 3-dimensional configuration of a distorted helix corresponding to case 2 of distorted helix CoPhMoRe. (a) Initial configuration of a helical wrapping of a polymer consisting of hydrophobic (blue)
- hydrophilic (red) alternating segments. (b) Final configuration of the distorted helix following structure relax atio n ... 79
Figure 7-1. Schematic illustrating construction of boronic acid polymeric corona phases. (a), 14 total polymers were synthesized through RAFT polymerization and then directly sonicated in aqueous
solutions of SWNT. The resulting corona phases were screened against a library of 10 sugar alcohols and 11 saccharides. (b), structure of sugar alcohol sensor. (c), structure of arabinose sensor. For b and c, number of repeating units in the polymer was determined using NMR analysis. ... 86
Figure 7-2 Sugar alcohol CoPhMoRe screening and construct that selectively differentiates 6 carbon sugar alcohols. a, Structure of 6-carbon sugar alcohols (Left: Dulcitol, Center: Sorbitol, Right:
D-mannitol) b, Heat-map of the normalized emission intensity response to the various sugar alcohols at 10mM. c, The normalized emission intensity response of PBA-MAH polymeric corona phases to the addition of different concentrations of 6C sugar alcohols. (Top: ortho, Middle: meta, Bottom: para) The fit is plotted as the solid line. d and e, Front (e) and side (d) schematic views of one of the several binding structures of PBA-MAH polymeric corona phases simulated from a HyperChem simulation package. Figures are aligned in the sam e order with c. ... 88
Figure 7-3 Saccharide CoPhMoRe screening and construct that selectively differentiates D-arabinose over other aldopentoses. a, Structure of aldopentoses used for the screening. b, Heat-map of the normalized emission intensity response to the library of 11 monosaccharides and I disaccharide, all at 10mM c and d, The normalized emission intensity response of PBA-MPA polymeric corona phases to the addition of different concentrations of D-arabinose (c) and L-Arabinose (d)6C monosaccharides. The fit is plotted as the solid line. e w ill be filled in later... 90
Figure 7-4 TEM micrograph of m-PBA-MAH polymeric corona phases around SWNT. a, Cryo-TEM of PBA-MAH SWNT incubated with dextran modified Au nanoparticle. SWNT is individually suspended without any bundling. The dark sphere is Au nanoparticle. Scale bar, 200nm. b, Cryo-TEM of PBA-MAH SWNT incubated with un-modified Au nanoparticle. Scale bar 200nm... 93
Figure 8-1 Schematic of experimental setup (a) and illustration of resulting polymeric corona phase around SWNT using force field calculation, (b) front view (c) side view. Boron is colored purple to visually illustrate its location. (d) Polymer synthesis scheme using RAFT polymerization ... 112 Figure 8-2 Glucose response and the proposed mechanism. The sample was excited using a 785nm laser
(100 mW/pLm2
, 0.5 s exposure time) with the setup in Figure 1(a). (a-c) The proposed mechanism of nanoparticle displacement for saccharide detection, (d) Response of a PBA-SWNT to glucose at various concentrations under continuous laser exposure. 10 pl of 20x concentrated glucose solution was added to
190 pl of SWNT solution at t = 20 min to create the final concentrations of 10 mM, 30 mM, or 100 mM. The control experiment was performed using an equivalent volume of DI water. (e) 10 cycles of adding
experiment procedure of (d). For the control experiment, saline 10 p1 was added. (g) Comparison of
PBA-SWNT response to 10 ul of concentrated NaCi (240 mg/ml) and to 10 ul of IM glucose, which makes the
final concentration of 50 m M after addition. ... 1 14 Figure 8-3 Normalized fluorescence change calculated using glucose diffusion profile in spherical
coordinates. (a) Normalized fluorescence change calculated at r = 1 pm with various glucose
concentration. (b) Initial conditions and boundary condition. (c) Comparison between model and data (d) Summary of normalized fluorescence change and recovery time calculated using the diffusion model,
SWNT fluorescence profile assuming that glucose is not directly added to focal volume. (center)... 118
Figure 8-4 PBA-SWNT response to 30 mM of glucose at three different laser fluences (30 mW/pm 2 (left), 100 mW/pm 2
(center), and 200 mW/pm2
(right)). Test performed using the setup shown in Figure 1(d )...:...,... ... ... 119
Figure 8-5 The effect of concentration and laser exposure (100 mW/pm 2) frequency on assay dynamics (a) Response of PBA-SWNT to glucose at various concentrations with non-continuous laser exposure (0.5 s exposure for every 1 minute) 10 ul of 20x concentrated glucose solution was added to 190 pl of
SWNT solution at t = 20min to create the final concentration of 10 mM, 20 mM, 50 mM or 100 mM. The
control experiment was performed using an equivalent volume of DI water. (b)(c) Comparison between continuous and non-continuous laser exposure for two different glucose concentrations. ... 121 Figure 8-6 Immediate response and recovery time after the addition of 10 mM glucose while varying (a) free polymer concentration (b) SWNT concentration. Recovery time is defined to be the time it takes for the sensor to recover 60% of florescence from immediate response. Experiments were performed using the setup shown in Figure 1(d) at 100 mW/pm2
2. LIST OF TABLES
Table I Summary of non-enzymatic glucose sensor electrochemical sensors ... 24
Table 2 Summary of Solvatochromism Analysis of SWNTs Dispersed by Surfactants/Polymers... 46
Table 3 Summary of kinetic parameters found from concentration dependent curves... 56
Table 4. Pitch and width of DNA wrapping around SWCNT in literature... 69
Table 5 M olecular Sim ulation Param eters... 73
Table 6 The dissociation constants (KD) of PBA-MAH polymeric corona phases to Dulcitol, Sorbitol and M annitol obtained from calibrations curves (Figure 7-2c)... 89
4. INTRODUCTION AND BACKGROUND
4.1 Introduction
Carbohydrates are one of four essential classes of biological molecules critical to the functioning of the human body, including lipids, amino acids and nucleic acids'. Just as with the latter three, carbohydrates contain a wealth of biological information, informing mechanisms ranging from the immune systems2, cell adhesion3 and metabolic processes . Accordingly, carbohydrate characterization and measurement is important for the fundamental understanding of biological phenomena5-6 and promising medical applications 7-8. Of existing and future assays for carbohydrate detection, sensors that provide real time information of their concentration and types including sucrose9-'0, lactosel'"-', fructose'2-14, and
maltose"-16 have particularly compelling medical applications. Of these existing and emerging carbohydrate
sensors, glucose has received special emphasis because of the medical importance of diabetes mellitus, and currently comprises more than 80% of biosensors existing in the world market'.
Diabetes mellitus, which is commonly referenced as diabetes, is a metabolic disease characterized by hyperglycemia or high levels of blood glucose' -20. A recent study2
' revealed that almost half of adults in the U.S. have pre-diabetes, a state of persistent, elevated blood sugar, which can lead to diabetes, or diabetes. According to the Centers for Disease Control and Prevention (CDC), currently 29 million adults are suffered with Diabetes while another 86 million have pre-diabetes22. One of the main challenges dealing with diabetes is that many of these individuals are not aware of their illness820. CDC indicated that only 75% of patients with diabetes, and 10% of prediabetes know their condition. Persistent and frequent hyperglycemia can lead to long-term complications, including cardiovascular disease, retinopathy, neuropathy, and nephropathy- 20. A key clinical issue facing people with diabetes and pre-diabetes is meeting targets in blood glucose 23-25; these patients highly depend on the glucose sensor to
control their blood glucose levels. The current consensus is that real-time monitoring of blood glucose levels (at the rate of less than 10 min/measurement) is required to effectively manage diabetic complications26 .A reliable and simple to use sensor would thus dramatically impact both patient behavior
and performance of blood glucose control, leading to the prevention and/or reduction of the risk of diabetes complications. The most common means of glucose level measurement is with a finger-prick method multiple times a day. However, this method suffers not only with its own inconvenience but also with the nature of the method itself, being not capable of providing information about continuous blood glucose levels. To overcome these limitations, non-invasive blood glucose sensing is also being actively explored, and many classes of techniques seem promising not limited to but including: bioimpedence, optical, electromagnetic and ultrasound27
1200 0 U) U) 0 1000 0, U) U 2 400 z 0 2007 2008 2009 2010 2011 2012 2013 2014 2015 2016 Year
Figure 4-1: Number of articles published from 2007 to 2016 related to glucose sensor (data acquired through Web of Knowledge@).
All these efforts for glucose sensor development led to a dramatic increase in the volume of studies
performed on this topic. As shown in Figure 4-1, the number of articles published in each year on glucose sensor nearly doubled from 2007 to 2016.
Advances in glucose sensor Electrochemical glucose sensors Enzymatic Non-enzymatic Commercially available system Optical glucose sensors Biocompatibility Glucose sensor based on emerging technologiesI
Figure 4-2: Outline of this review. Mainly the past 10 years of advances are covered for each section. Instead of summarizing the vast field of glucose sensor research, here in this review, we will restrict the review mainly on advances in glucose sensor development for the past 10 years. We will first cover the advances in glucose sensor based on three different aspects as shown in Figure 4-22835. Then we will briefly cover advances in commercially available glucose sensor, and lastly implications associated with glucose sensors implantation and biocompatibilities.
4.2 Electrochemical Glucose Sensor 4.2.1 Enzymatic Glucose Sensor
A large body of work has been developed around continuous biosensors3 6. The various biosensors have are capable of detecting a wide variety of analytes in a number different of biological environments36. The most successful demonstration of continuous biosensors in a clinical setting is the development of the continuous glucose monitor (CGM), which measures blood glucose in the interstitial fluid!7-39. The CGM has solved many of the problems of continuous biomolecule detection. The CGM has become important
for the treatment of diabetes mellitus and is also a practical demonstration the advantages of continuous biomolecule monitoring. CGM in conjunction with an insulin infusion pump has shown significant improvement over injection therapy in maintaining glycemic control, while minimizing the need for patient adherence and lowering hypoglycemia4o.
CGMs are based on the concept of amperometric sensing, which measures the current output of an analyte reacting at the surface of an electrode. In many cases, the reaction rate and selectivity is facilitated by the coupling of an enzyme to the surface of an electrode to catalyze the reaction. Glucose oxidase (GOx) is the primary enzyme used in enzymatic amperometric sensors of as it has high stability, low cost, and good bioactivity4 1. GOx oxidizes glucose to gluconic acid through the reduction of a flavin group in the enzyme (FAD to FADH2)42
. Under normal circumstances, the FAD is restored by oxidation
from 02, which results in the following overall reaction42
glucose+02 GOx > gluconicacid+H202 (1.1)
The first example of a GOx based electrochemical sensor was developed by Clark and Lyons in 1962, where a semipermeable membrane entrapped GOx against the surface of an electrode and the change in the concentration of 02 was detected by a Pt electrode43. The key difference between all of the enzymatic glucose sensors is how they regenerate the FAD in the GOx. Based on this criteria, Chen et al. described three generations of glucose sensors as follows - (i) those that use 02 to regenerate FAD, (ii) those that use chemical mediators to regenerate FAD, and (iii) those that directly couple GOx to the electrode, which donate directly donate electrons to the enzyme42
Generation I sensors can measure one of two things to correlate to the glucose concentration, 02 or H202. However, measurement of H202 conveniently regenerates 02 as a product of the reaction at the electrode
surface. Recent work has developed photoelectrochemical sensors which use light and TiO2 nanowires to facilitate the regeneration of 02 from H202 and show an increase in photocurrent. One downside of H202 detection is the presence of other redox active molecules in the same potential window such as ascorbic
acid, uric acid, and acetomenophen . Much work has been down to lower the potential window, for example through using Prussian blue to catalyze the H202 reaction at the electrode surface, such as the
work done by Li et al. using a molecularly imprinted film with Prussian blue and GOx to significantly increase sensitivity and selectivity44. Various nanoparticles have also been used to lower the operating potential45-46, such as reduced graphene oxide sheets with gold-palladium nanoparticles which have increased sensitivity to 02 redution4 7. An alternative solution for dealing with this problem is to coat the
38
electrode with polymers that screen or react away the interferants
Due to the excess of glucose over oxygen in vivo, the system quickly becomes limited by the
42 mei
consumption of endogenous oxygen. Using mediators overcomes this problem of electron transfer rate to the enzyme. However, many solution phase mediators based on diffusion are toxic and cannot be used
in vivo4 2 4 8, so instead many rely entrapping GOx in redox active polymers which shuttle electrons to the
enzyme, such as those incorporated with Os49. More recently, nanomaterials have been connected to GOx
through to facilitate electron transfer from electrode to enzyme. Polypyrrole-graphene-GOx nanosheets have been shown to enhance the performance of the electrode0. Graphite nanosheets and ZnO nanoparticles have also been used facilitate electron transfer51. However, when enzymes are directly
coupled to electrodes concerns over enzyme activity loss due to changes in conformation arise .
Ultimately, the development of these sensors is primarily for use in patients. Many form factors have been developed for enzymatic glucose sensors. Miniaturizing CGM electrodes to minimize discomfort and inflammation of the subcutaneous implant is an ongoing effort53. Additionally, much work has been done on the development of other form factors such as those based on contact lenses54, to aid in diabetes management. These contact lens based form factors are capable of transmitting data wirelessly5 5; however, powering the devices is still an issue. Recently, biofuel cells have been integrated into these form factors to power the electrochemical sensing methods56-57. Such contact lens form factors are transitioning into commercial products. Recently, a variety of sensors have been combined into a fully
integrated wearable array on the surface of the skin, which multiplexes multiple analytes (glucose, lactate, sodium, and potassium) for sweat sensing and updates the user through their cellular phone".
4.2.2 Non-Enzymatic Glucose Sensor
The drawbacks of enzymatic electrochemical detection of glucose, including stability, sensitivity to environmental conditions, and changes in activity upon immobilization, have spurred researchers to pursue nonezymatic methods of electorchemical detection, in which electrodes oxidize glucose directly into gluconic acid without the aid of glucose oxidase. To date, non-enzymatic glucose suffer from several disadvantages compared to those employing glucose oxidase, most notably insufficient sensitivity of the sensor, slow response times, poisoning at the catalytic surface, and non-functionality at physiological pH levels3 4. The introduction of nanoscale materials as electrode materials and coatings, however, has begun to address these issues and make non-enzymatic glucose sensing a real possibility. Several comprehensive reviews have been written about non-enzymatic electrochemical glucose sensors about the literature prior to 201428-35. This review summarizes work from 2014 onwards.
Numerous types of non-enzymatic glucose sensors in a variety of morphologies and consisting of various types of materials have been proposed. Noble metals such as gold and platinum have been used extensively as electrodes for glucose oxidation". However, disadvantages - as high price, low availability, poor sensitivity, poor selectivity, and fouling of the surfaces - have encouraged researchers to pursue alternative materials, such as transition metals, metal oxides, and al1oys59~60, which are reported to have higher sensitivities, lower costs, and better stabilities". Some of this enhanced sensitivity may be attributed to a synergistic interaction between the multiple metals in a material61. Various materials have been reported, including Fe304,5 9 Ni/Au bimetallic materials, 61-62 Co304,63 Cu20,60 Pt3Ru,6' Ni,61
NiCo204,66 Ni-Ti-0,67 NiO,68 CoOOH 69 Ni(OH)2,70 NiS,7' bimetallic Cu-Ag,72
hybrids of Cu/CuO/ZnO,73 MnCo204,74 and Co304/PbO2 superstructures52. Additionally, the introduction of nanomaterials has greatly increased available surface area for glucose oxidation, consequently improving kinetics of the reaction. Various configurations have been reported in the literature, including metal
oxide, bimetallic, and metal alloy nanotube;59, 62, 67 metal alloy nanowires,52, 60-61, 74 hollow
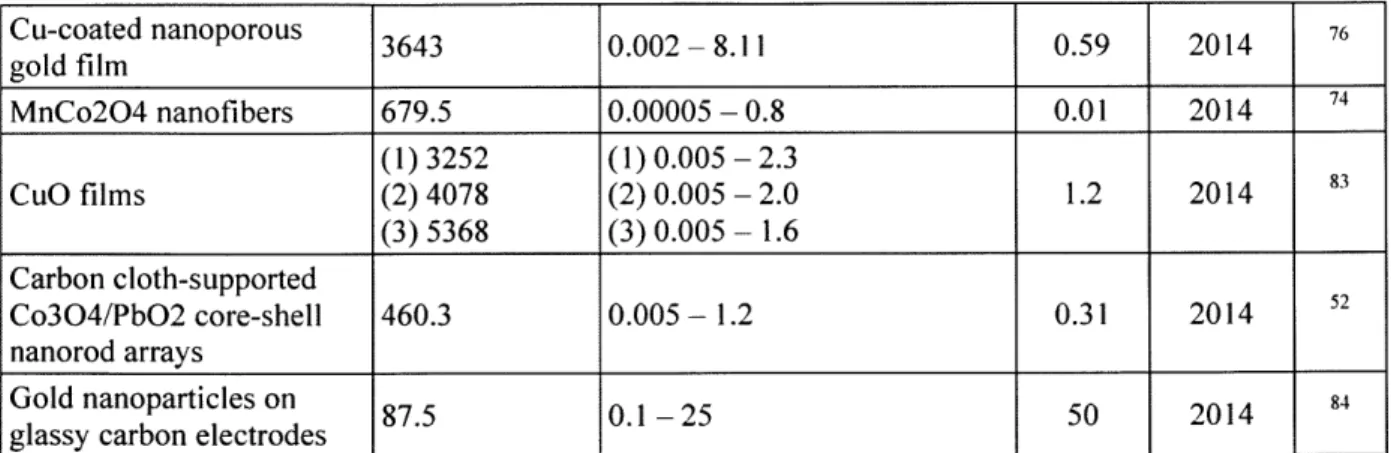
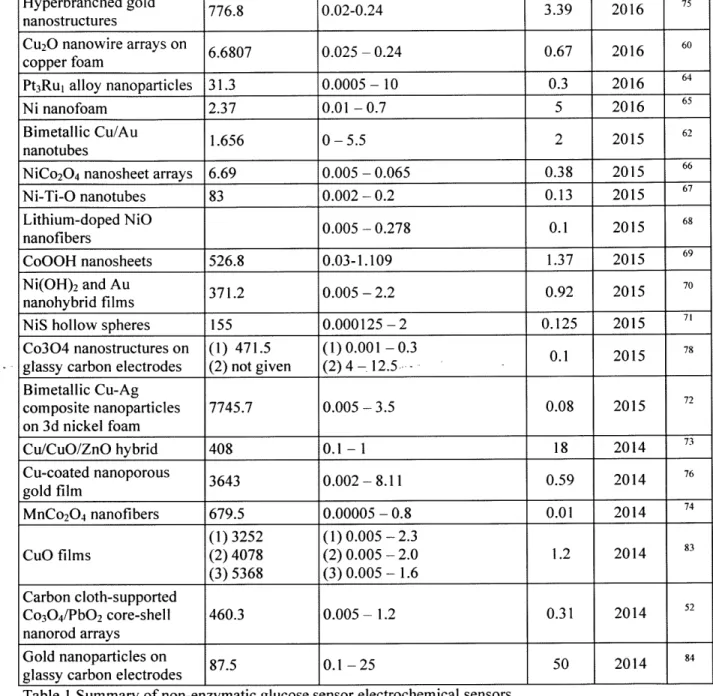
nanododecahedra,63 hyperbranched dendrites,75 nanofoam,6 5 nanosheets and films,66' 69-70, 76 and other types of nanostructures73'77. As shown in
Sensitivity Linear range LOD
Electrode Composition (sA mM-I cm- (mM) (M) Year Ref.
Molecularly imprinted
polymer on gold 3.2x10⁻⁴ - 1 0.19 2017 79
nanoparticles
(1)673.3 (1) 0.1 x 10⁻³ - 125 x 10-3
Fe304 nanotube arrays (2) 71.2 (2) 125 x 10-3 - 1 0.1 2017 59
(3) 9.58 (3) 0.001 - 5
Ni/Au multilayer nanowire (1) 3372 (1) 0.25 x 10⁻³ - 2 0.1 2017 61
arrays (2) 1906 (2)2-5.5
Co304 hollow 708.4 2.0 x 10⁻³ -6.06 0.58 2016 63
nanododecahedra Glass carbon with
nanoporous copper, carbon 33.75 0.006-3.4 2.6 2016 8
black, and nafion
Hyperbranched gold 776.8 0.02-0.24 3.39 2016 75
nanostructures
Cu2O nanowire arrays on 6.6807 0.025 - 0.24 0.67 2016 60
copper foam
Pt3Rul alloy nanoparticles 31.3 0.0005 - 10 0.3 2016 64
Ni nanofoam 2.37 0.01-0.7 5 2016 65
Bimetallic Cu/Au 1.656 0-5.5 2 2015
62 nanotubes
NiCo204 nanosheet arrays 6.69 0.005 - 0.065 0.38 2015 66
Ni-Ti-O nanotubes 83 0.002-0.2 0.13 2015 67 Lithium-doped NiO 0.005 - 0.278 0.1 2015 68 nanofibers CoOOH nanosheets 526.8 0.03-1.109 1.37 2015 69 Ni(OH)2 and Au 371.2 0.005-2.2 0.92 2015 70 nanohybrid films
NiS hollow spheres 155 0.000125-2 0.125 2015 71
Co304 nanostructures on (1) 471.5 (1) 0.001 - 0.3 0.1 2015 78
glassy carbon electrodes (2) not given (2)4-12.5
Bimetallic Cu-Ag
composite nanoparticles 7745.7 0.005-3.5 0.08 2015 72
on 3d nickel foam 1
_1
Cu-coated nanoporous 3643 0.002-8.11 0.59 2014 76 gold film MnCo204 nanofibers 679.5 0.00005 - 0.8 0.01 2014 74 (1) 3252 (1) 0.005 - 2.3 CuO films (2) 4078 (2) 0.005 - 2.0 1.2 2014 83 (3) 5368 (3) 0.005 - 1.6 Carbon cloth-supported Co304/PbO2 core-shell 460.3 0.005 - 1.2 0.31 2014 2
nanorod
arrays Gold nanoparticles on 87.5 0.1-25 50 2014 84glassy carbon electrodes
Table 1, several of these materials demonstrate a linear range of responsivity in the physiologically relevant range of blood glucose concentrations. Additionally, some of these materials demonstrate high sensitivities, indicating promising developments in this field. Such advancements lend hope to non-enzymatic electrochemical detection of glucose someday becoming a practical application.
In order to produce these glucose sensitive materials in a more environmentally friendly and sustainable manner, some groups have explored using plant materials as raw material in the calcination process. Han et al. created porous Co304 nanostructures using gingko leaves as a template. The resulting structure
showed two linear regions from 1-300 pM and 4-12.5 mM7 . Li et al. used leaves from a holly tree and performed hydrothermal synthesis of bimetallic Cu-Ag composites, which showed a linear response to glucose from 0.005-3.5 mM at a sensitivity of 7745.7 ptA mM 1CM-2 72. Such methods of production are
simple and may be more sustainable than alternative methods.
As an alternative strategy to introduce greater selectivity into the sensor, Kim et al. introduced a molecularly imprinted polymer with boronic acid moieties onto a benzoic acid functionalized poly(terthiophene) with gold nanoparticles deposited on a carbon electrode9. Molecular imprinting is a molecular recognition strategy in which polymerization occurs in the presence of a template molecule (e.g. glucose) to create a binding pocket remaining after removal of the template8 0. Boronic acids have commonly been used to bind diol-containing molecules to create many glucose-responsive materials and sensors'. In this sensor, reaction of glucose with the boronic acid generates protons, which change the
fell between 0.3 to 1000 ptM of glucose, well-below the physiological range, the introduction of
molecular recognition components into the electrode is one promising strategy to increase sensing selectivity without the use of an enzyme.
One of the remaining and perhaps most difficult challenges in the field is demonstrating glucose detection functionality after in vivo implantation. While many studies commonly employ real biological samples from human patients (i.e. blood and saliva), the samples themselves are often diluted many-fold into alkaline media, dramatically changing the pH and the concentration of interfering or fouling molecules. Additionally, while most studies in the literature demonstrate glucose responsivity above certain interferent levels, most commonly ascorbic acid, uric acid, chloride ions, acetaminophen, and dopamine, the effects of other molecules are often not reported. Some studies remove the protein components of blood, which have the real potential of fouling the electrode surfaces. Furthermore, long-term stability of electrode functionality is commonly demonstrated in air. For in vivo measurements, however, air is not an appropriate medium to demonstrate long-term functionality, given the myriad species present in blood and other biological fluids. Despite the progress made thus far, if these novel sensors are to be long-term, implantable devices for glucose monitoring, functionality will have to be demonstrated in complex biological media such as the blood for much greater periods than have been previously demonstrated.
Electrode Composition Sensitivity Linear range LOD Year Ref.
(ptA mM' cm) (mM) (ptM) Molecularly imprinted polymer on gold 3.2x10⁻⁴ - 1 0.19 2017 79 nanoparticles (1)673.3 (1) 0.1 x 10⁻³ - 125 x 10-3 Fe304 nanotube arrays (2) 71.2 (2) 125 x 10-' - 1 0.1 2017 5 (3) 9.58 (3) 0.001 - 5
Ni/Au multilayer nanowire (1)3372 (1) 0.25 x 10~3 -2 0.1 2017 61
arrays (2) 1906 (2) 2 - 5.5
C0304 hollow 708.4 2.0 x 10⁻³ -6.06 0.58 2016 63
nanododecahedra Glass carbon with
nanoporous copper, carbon 33.75 0.006-3.4 2.6 2016 82
Hyperbranched gold 776.8 0.02-0.24 3.39 2016 7
nanostructures
Cu2O nanowire arrays on 6.6807 0.025 -0.24 0.67 2016 60
copper foam
Pt3Rui alloy nanoparticles 31.3 0.0005 - 10 0.3 2016 64
Ni nanofoam 2.37 0.01-0.7 5 2016 65
Bimetallic Cu/Au 1.656 0-5.5 2 2015 62
nanotubes
NiCo2O4 nanosheet arrays 6.69 0.005 - 0.065 0.38 2015 66
Ni-Ti-O nanotubes 83 0.002 - 0.2 0.13 2015 67 Lithium-doped NiO 0.005 - 0.278 0.1 2015 68 nanofibers CoOOH nanosheets 526.8 0.03-1.109 1.37 2015 69 Ni(OH)2 and Au 371.2 0.005-2.2 0.92 2015 nanohybrid films
NiS hollow spheres 155 0.000125-2 0.125 2015
Co304 nanostructures on (1) 471.5 (1) 0.001 - 0.3 0.1 2015 78
glassy carbon electrodes (2) not given (2) 4 -
12.5.-Bimetallic Cu-Ag 72 composite nanoparticles 7745.7 0.005-3.5 0.08 2015 on 3d nickel foam Cu/CuO/ZnO hybrid 408 0.1-1 18 2014 73 Cu-coated nanoporous 3643 0.002-8.11 0.59 2014 76 gold film MnCo2O4 nanofibers 679.5 0.00005 - 0.8 0.01 2014 74 (1)3252 (1) 0.005 - 2.3 Cuo films (2) 4078 (2) 0.005 - 2.0 1.2 2014 83 (3) 5368 (3) 0.005 - 1.6 Carbon cloth-supported 52 Co304/PbO2 core-shell 460.3 0.005 - 1.2 0.31 2014 nanorod arrays Gold nanoparticles on 87.5 0.1-25 50 2014 84
glassy carbon electrodes
Table I Summary of non-enzymatic glucose sensor electrochemical sensors 4.3 Optical Glucose Sensor
4.3.1 Absorption/Transmission
Spectroscopy methods were the first optical techniques employed to tissue measurement. Most of these methods involve traditional techniques of measuring light attenuation in the path of a light source. Mid-infrared (MIR) and Near-Mid-infrared (NIR) are used due to their high tissue penetration.
These techniques were first described by Robinson and colleagues in 1992 where they collected transmission spectra 800-1300 nm on fingers of type-I diabetic (DM1) patients, reaching a detection limit of 19.8 mg/dL81. This method was further improved to a detection limit of 15.3 mg/dL using wavelength ranges of 1500-1600 nm86.
However, since glucose absorption is weak and there is strong interference with other blood and tissue contributions'78 - , obtaining reliable concentration predictions are difficult without other information
about the patient or circumstances of data acquisition. In general, these techniques involve complex statistical correlation methods to extract glucose concentration from spectra.
4.3.2 Thermal Emission
Thermal emission is a method to monitor glucose, ethyl alcohol and other blood constituents through monitoring the long wavelengths infrared energy emitted by the person as heat. The thermal gradient of the outer skin results in MIR emission contains a fingerprint spectral region of glucoss [Patent
US5615672]. This method uses the human body and thus eliminates the need for a light source. It was
further advanced using fibers and multiple detectors for reference and human use [US Patent
No.5666956]. However, the signal for glucose is much smaller as compared to other blood components,
89 such as water
4.3.3 Diffusion Reflection
Another method of using NIR spectroscopy for glucose measurement is via diffuse reflection. This method involves illumination of a spot on the body with NIR light where it is absorbed and scattered based on chemical components. The reflected component is studied and correlated with tissue content**.
As surround tissue contributes to the aggregate signal, techniques were developed for background elimination lowering detection limit down to 14.4-19.8 mg/dL91. In a test of 34 patients during carbohydrate tolerance tests, where glucose were given to test subjects, wavelengths of 700-1050 nm were used to determine glucose concentrations with errors of 11.7+/5.03 mg/dL92. A set of back
scattering experiments from human palm in the 8-1 Oum range was able to detect in the range of 80-160
93
mg/dL with 84% accuracy . The advantages of refraction methods include small size of instrument, 94
immunity to electromagnetic interference
4.3.4 Sources of Error and Corrective Methods
For most optical methods, sources of error is inherent in background variations"5. This can include changes in measurement (depth and positional changes), variation in temperature and contact pressure. These can all change temporally and be misinterpreted as glucose concentrations. Additionally, many molecules directly interfere with the glucose signal, including: proteins, cholesterol (at 8 mg/dl)96, urea, water7. Clinically, different regions of the body such as tongue, forearm and ear have been considered for measurement. However, it is important to understand that all tissues also contain glucose, so it is difficult to measure a true blood glucose concentration.
4.3.5 Advanced in Error Correction
As mentioned, extraction of information is a complex process. The most common methods to extract concentration from a spectrum of complex mixture of molecules include partial least squares fitting and modeling98.
Improvement to measurement quality can be made through the acquisition of additional data via multiple wavelength beams86'99. Up to 5 wavelengths can be used to error down to 3.8 mg/dl'00. Orthogonal methods have also been used to reduce measurement error, including: multiple scattering correction'0', bioimpedance02, and 2-dimentional correlation spectroscopy03
Computational methods also aid the process of data deconvolution. Monte Carlo simulations have been constructed specifically for study of different layers of light propagation in tissue'4. Complex mechanical and computational methods to reproduce measurement conditions9'. New methods of data processing, such has finding the correlation between second derivative of differences and glucose concentration, has been implemented0 5.
To circumvent differences between patients and the necessity of individual calibration, efficient reference point calibration methods'06 and relative measurement methods'0 7, similar to the blood oxygen meter, have been developed. In addition to bulk tissue measurements, these methods have been more finely tuned to study intracellular measurements" and miniaturized for portability 19-1.
4.3.6 Photoacoustics
Photoacoustic methods involve using the pulsation of a laser to generative heat and pressure gradients within a target tissue. Cyclic thermal expansion will generate pressure waves within a certain media that can be picked up via a detector'". The resulting wave propagation is dependent on the wavelength of the laser as well as glucose and other analytes, with wave detection performed with an ultrasonic transducer"2
MIR photoacoustics at 1010-1095 nm can reach a detection limit of 100 mg/dL 3. However, water absorption limits the method to a depth of 100um into skin, only detecting interstitial glucose"4.
The laser can be pulsed at different frequencies to increase detection limits down to 1.39 mg/dL' "5. The types of waveforms can also be optimized"'. Other methods include using a combination of ultrasound for wave generation and IR for detection'16. But currently this mode of detection is mostly performed on laboratory solutions"'.
Like other optical methods, photoacoustics is also purvey to interference from other substances'1 7. Laser fluctuations can also be a challenge'1 8. Lastly, thermal diffusion and boundary conditions presents the need to have mathematical modeling for different types of photoacoustic cells and devices"".. 19. One of
the main advantages of employing this method is the avoidance optical scattering and increased sensitivity 112
4.3.7 Raman
Raman spectroscopy uses the inelastic scattering of photons to study the structure of molecules through their vibrational states. The technique is promising for non-invasive diagnostics because of its molecular
specificity in signature for analytes and its minimal interference from water. However, it is limited by the weakness of Raman scattered light (10-3 weaker)12 0.
The transparent nature of optical tissue also lends it to Raman studies'. In vivo studies conducted with this method while measuring a dog ear shows approximately 10% error 22. A mouse experiment with 785 nm excitation and characteristic peak of 1125 cm-1 show that glucose concentrations lower than 9g/dl would be too low to detect 3.
Similar to other optical methods, due to the complexity of the turbid nature of body fluids, a multivariate calibration is necessary to correlate with glucose concentration. Also, due to mostly measuring interstitial fluid, there is significant lag in correlation with blood glucose24. Incoming beam source can also significantly contribute to error 125. Lastly, Raman systems are large and cumbersome126. Techniques
such as surface-enhanced Raman scattering can much improve the signal, but its sample collection ruins the non-invasive nature of these optical techniques27
4.3.8 Polarization
Reflection polarimetry is the study of changes in plane polarized light following scattering off of a sample volume. Using different states of polarization (linear or circular) as probes, the reflected light off can be measured with a polarimeter. The rotation of polarized light occurs due to the differential scattering of left versus right polarized light, which is correlated with temperature, wavelength and chiral molecules such as glucose 28. This method is also called a Stokes-Mueller matrix polarimetry system, and can detect glucose concentrations ranging from 30-500 mg/dl with 5% error29. This measurement technique is very
130
much suited for measurement of turbid mediums such as the aqueous humor of the human eye
In the case of tissue measurements, scattering element contributions such as lipid particles, water,
131 Smlrt te ehdteene ob
hemoglobin, protein and fats are major contributors to noise Similar to other methods, there need to be consideration for the time lag between interstitial fluid and blood 2. Individual differences in skin also
requires extensive calibration3 . Multiple wavelengths and frequency modulations are ways to improve
134
the measurement signal
Polarization methods also require extensive instrumentation 5, and testing it in an in vivo animal model shows up to 15% of error'36. Despite noise sources, tests with tissue phantoms and blood from diabetic patients shown at minimum the potential to differentiate between normal and pathologic states"'.
4.3.9 Optical coherence tomography (OCT)
Optical coherence tomography (OCT) is a technique that involves the usage of light reflection to achieve axial resolution in tissue material. OCT usually uses a NIR signal and detects backscattered light from samples. Studying of the coherence of the reflect signal with a reference, fine spatial as well as materials properties can be determined from changes in scattering coefficient'38. Due to the absorption properties of glucose in the 1540-1640 nm range, the interference spectra from reflection changes can be correlated
'39
with concentrations
OCT signal slope can be correlated to glucose concentration, but is limited to best measurements at
specific locations such as the papillary-reticular and dermis-hypodermis junctions 14. Studies have been
performed with OCT to study properties of human blood in vitro"' and in vivo.142
4.3.10 Others
Non-traditional optical methods have also been proven effective for glucose measurement. Computation technique include using multiple angle laser and detector setups combined with neural networks and signal processing to train a system for glucose detection 43 with 99% accuracy in over 200 patients.
Another example involves measurement of peak RBC absorption at 535 nm. as glucose concentration increases the RBC swells, changing the path length. A change can be detected in vivo, but with no exact concentration determination'4'.
4.4 Glucose Sensor Based on Emerging Technologies
The considerable demand for improved glucose sensor has geared research toward using nanomaterials.
A variety of materials including metal and metal oxide nanoparticles (NPs), carbon nanomaterials,
polymer nanocomposites and hybrid nanostructures have been studied for their electrochemical activity in both enzymatic and non-enzymatic glucose sensors. These materials possess high surface area that enhances the electrochemical performance and biocatalytic activity.
4.4.1 Electrochemical Enzymatic Sensors Using Nanomaterials
Carbon nanomaterials offer multiple advantages over traditional glucose sensors, including facile preparation methods, higher stability of the sensor, reproducibility, and higher electrical conductivity. Carbon nanotubes (CNTs) indicate lower noise levels and wider potential window that is desirable for designing a glucose sensor.145 The hollow one' dimensional morphology of CNTs promote the electron transfer from the analyte onto the electrode surface.146 Thus, the CNT-based sensors indicate faster response time and higher sensitivity levels. In an early example of CNT-based enzymatic glucose sensors, CNTs were aligned to connect the redox center to the electrode surface (Figure 4-3). 147 The FDA was then covalently attached to and immobilized at the CNTs end. The idea of using CNTs as a bridge between the electrode and GO led to the usage of vertically aligned CNT arrays as a molecular route for electron transfer.45-148 Lower signal to noise ratio and detection limits as low as 0.08 mM were reported for such designs of enzymatic CNT-based sensors.149 Moreover, CVD-synthesized and wet-spun CNT fibers and yarn have been investigated for their efficiency in electron capture and transfer through similar bridging mechanism.-15 0 1 5 Detection limits as low as 25 pM and fast response over 25 ptM to 30 mM of analyte were achieved using CNT fibers.'5 6
Although the high surface area of carbon nanomaterials increases the current response in presence of the analyte, it also promotes the background current and reduces the sensitivity of a pure CNT device. 157158 To overcome this issue, metal nanoparticles, conducting polymers have been added to CNT sensors.145 These nanoparticles electrochemically reduce some of the active sites of CNT during the sensing process
and lower the background noise. Metal and metal oxide nanoparticles such as Cu, Au, Ni, Pt have been studied for their promoting effect on the detection limit and sensitivity of the enzymatic CNT-based sensors.148' 159-161 Furthermore, hybrids and composites of CNT/polymer have been reported to improve
the stability of the sensors. 162-164 For example CNT fibers covered with nafion showed great sensitivity and selectivity for glucose. 12 Another example is a multilayered hybrid of poly(allylamine),
functionalized MWNTs, gold nanoparticles on which a layer of GOx was immobilized.6 5 This polymer/CNT/NP hybrid demonstrated linear response over a large range of 0.1-10 mM and long-term stability and minimal interference of other analytes.
Graphene, the new addition to carbon nanomaterials family, has recently attracted attention in the field of glucose sensors.166-167 Like CNTs the conjugated molecular structure of graphene allows for fast electron transfer. Its high electrochemical activity in reduction of H202 makes a promising candidate for
enzymatic glucose sensors. Moreover, the presence of oxygen-containing functional groups in the graphene oxide (an oxidized derivative of graphene) provides active sites for binding of GOx amine groups onto the surface. The first graphene-based sensors where prepared by immobilizing of GOx on pristine graphene stabilized by polyvinylpyrrolidone (PVP) through 7r-7i interactions. 16 This sensor demonstrated a direct electron transfer mechanism and yielded a large response window (2-14 mM). On the other hand, the covalent binding of GOx onto the graphene oxide surface improved the sensitivity of the sensor to 3 pM.169 Chitosan-modified graphene oxide improves the enzyme loading through providing more available adsorption sites on the chitosan chains. 17-171
SWCNTs EDC NN .* Ohc OH VO MR! Nh apo-GOx (1) 4WNH2 EDC
Figure 4-3: Assembly of aligned SWNTs for enzymatic glucose sensor, reprinted with permission from reference'4 7 (Angewandte Chemie-International Edition 2004, 43 (16), 2113-2117,copyright 2004 Wiley).
Hybridization of graphene with nanoparticles improves the sensors properties. Fe304, Au, CdS, Pd, and
various combinations of these metals have been studied for their performance in enzymatic glucose sensors.47, 172-174 Biocompatibility, fast electron transfer, higher loading of enzyme, high sensitivity and stability are the main features of these sensors.41
4.4.2 Electrochemical Non-Enzymatic Sensors Using Nanomaterials
Similarly, non-enzymatic glucose sensors have been developed and improved by incorporation CNTs into their structure. Addition of CNTs to catalytically active metal/metal oxide nanoparticles increases the sensitivity of the device through fast electron transfer and providing a better distribution of nanoparticles on the electrode surface.17 5-177 Electrodeposition of Ni and CuO on the CNT arrays has tremendously increased the sensitivity, detection limit, and the linear response of these sensors. 70, 178-179 Chemical
Glucose
Gluconi
vapor deposition of Ni on functionalized CNT demonstrated a wide linear response window (5 pM-2 mM) and low detection limit (2 ptm).'
Like CNTs, graphene addition to non-enzymatic sensors improves the dispersion of metal/metal oxide catalytic nanoparticles and prevents their aggregation. Various methods such as chemical reduction, electrochemical synthesis, and electrodeposition have been used to embed nanoparticles on the graphene surface.1 0-112
Bimetal graphene sensors usually exhibit better performance and achieve detection limits as low as a few nM.183-184 These sensors offer fast response, stability, and selectivity over first and second generation enzymatic sensors.
Other carbon nanomaterials have been used to improve the performance of non-enzymatic glucose sensors. Mesoporous carbon 3D frameworks possess high pore volume and large surface area; thus, these can be used as catalyst support to improve the nanoparticles distribution. 1' Linear response window of
2ptM to 1 mM, with detection limits as low as 0.65 pM have been reported for such structures. Onion-like mesoporous vesicles have also served as catalyst support for Pt and Pd nanoparticles.8 6 Diamond-like 3D carbon and carbon black are some examples of other carbon nanomaterials that have been used in glucose sensor fabrication.188 Reports of other nanomaterials with improved performance in glucose sensors can be found elsewhere.'8 9
4.4.3 Optical Sensors Using Nanomaterials
Along with the electrochemical sensors, fluorescent-based sensors have been also studied extensively using nanomaterial. An extensive review'90 has been written on this topic previously and in this section, we briefly introduce some of the key results. Among nanomaterial, single walled carbon nanotubes have unique absorption and emission spectra, which make it have fluorescence near infrared ranges. The fluorescence of SWNT has several advantages for biosensor application and this includes tissue transparency'9' and prolonged fluorescence over a long time period without photobleaching 92
. Due to these benefits, SWNT has been used to develop a new type of glucose sensors through being combined with other glucose binding moiety such as glucose binding protein and phenyl boronic acids. Real time glucose monitoring was performed using SWNT wrapped with vinyl chloride based
polymer which is functionalized with glucose binding protein '. Upon the binding of glucose, glucose binding
protein goes through conformation changes, which leads a quenching of fluorescence signal of SWNT. Successful
measurement of glucose at physiological concentration ranges was demonstrated over 60 hours without any sign of
sensor deformations. Another study was performed by pairing SWNT with phenylboronic acid, the molecule that is
well known for its covalent interaction with diols'94.Initial fluorescence quenching was observed upon the addition of PBA, which was subsequently followed with fluorescent recovery by adding glucose.
4.5 Commercially Available System
3 most common invasive continuous glucose monitoring (CGM) sensors in the market include Guardian®
REAL-Time, SEVENTM STS@ and FreeStyle Navigator. Guardian® REAL-Time is one of continuous glucose
monitoring (CGM) sensors introduced by Medtronic Minimed. The device requires a measurement of glucose
in blood every 12 hours and renders trend of change in glucose enough to confirm the sensitivity of device itself.95
It is noted that the Guardian® REAL-Time provides capability of setting an alert to patients once the blood glucose
signal deviates the low and high cutoff limits.'96 The glucose oxidase membrane consisting electrode inside the
sensor reacts with the glucose and produces hydrogen peroxide. The sensor is also classified as a first-generation
sensor since the hydrogen peroxide formed by reaction of oxygen with glucose oxidase is the main source to
measure glucose concentration.' 1' Guardian® REAL-Time is implanted inside the body and data is recorded for 3
days. 195
One of more advanced option extending the duration of sensor life was provided by Dexcom. Dexcom developed
the long-term CGM sensor called SEVEN TmSTS® which monitors glucose concentration up to 7 days and was
approved by FDA in 2007. Similar to Guardian® REAL-Time, it is a first-generation sensor and the calibration of
device is required every 12 hours and sensor collects data every 5 minutes.'98 It is recommended that the
acetaminophen may interfere the signal from the sensor because acetaminophen can be oxidized at the metal surface
of electrode instead of hydrogen peroxide.'9 6
FreeStyle Navigator developed by Abbott Diabetes Care, another implanted amperometric sensor, was approved by
FDA in 2008. FreeStyle Navigator is different from the Guardian® REAL-Time and SEVENTMSTS® in that the
direct electrooxidation of glucose occurs by utilizing exogenous mediator. It is classified as the second-generation
the abdomen or the back of arm and patients can painlessly measure blood-glucose concentration because the sensor
requires only infinitesimal amount in blood sampling (approximately 300nL). The sensor has to be replaced every 5
days and it also necessitates the calibration after 12, 24 and 72 hours after insertion.198
Glucowatch is classified as non-invasive CGM sensor which is included in different category from other devices
aforementioned. It is a transdermal sensor approved by FDA in 2001. Reverse iontophoresis is applied to extract
glucose through skin and hydrogen peroxide formed by glucose oxidase-catalyzed reaction is detected by an
amperometric sensor.'9 7 Its shape is similar to wrist-watch which makes it easy to handle. Transdermal sampling has
advantage over other sampling methods since it prevents any interruption by species which is relevant to
peroxide-based sensing mechanisms. 200 However, due to its inaccuracy of measurement and malfunction of alarm and skin