HAL Id: hal-03140005
https://hal-amu.archives-ouvertes.fr/hal-03140005
Submitted on 12 Feb 2021
HAL is a multi-disciplinary open access
archive for the deposit and dissemination of
sci-entific research documents, whether they are
pub-lished or not. The documents may come from
teaching and research institutions in France or
abroad, or from public or private research centers.
L’archive ouverte pluridisciplinaire HAL, est
destinée au dépôt et à la diffusion de documents
scientifiques de niveau recherche, publiés ou non,
émanant des établissements d’enseignement et de
recherche français ou étrangers, des laboratoires
publics ou privés.
C. Baunez, Mickael Degoulet, Stéphane Luchini, Patrick Pintus, Miriam
Teschl
To cite this version:
C. Baunez, Mickael Degoulet, Stéphane Luchini, Patrick Pintus, Miriam Teschl. Sub-National
Allo-cation of COVID-19 Tests: An Efficiency Criterion with an AppliAllo-cation to Italian Regions. Covid
Economics, Centre for Economic Policy Research CEPR, 2020, 12, pp.192-209. �hal-03140005�
COVID-19 tests: An efficiency
criterion with an application to
Italian regions
1
Christelle Baunez,
2Mickael Degoulet,
3Stéphane Luchini,
4Patrick A. Pintus
5and Miriam Teschl
6Date submitted: 23 April 2020; Date accepted: 24 April 2020
Tests are crucial to know about the number of people who have
fallen ill with COVID-19 and to understand in real-time whether the
dynamics of the pandemic is accelerating or decelerating. But tests are
a scarce resource in many countries. The key but still open question
is thus how to allocate tests across sub-national levels. We provide
a data-driven and operational criterion to allocate tests efficiently
across regions or provinces, with the view to maximize detection
of people who have been infected. We apply our criterion to Italian
regions and compute the shares of tests that should go to each region,
which are shown to differ significantly from the actual distribution.
1 This work was supported by French National Research Agency Grants ANR-17-EURE-0020. The authors gratefully thank the Editor and referee for suggestions that helped improve this paper.
2 Senior Research Fellow, Aix-Marseille University, CNRS, Institut Neuroscience Timone. 3 Research Fellow, Aix-Marseille University, CNRS, Institut Neuroscience Timone.
4 Research Fellow, Aix-Marseille University, CNRS, EHESS, Centrale Marseille, Aix-Marseille School of Economics..
Covid Economics
1
Introduction
Testing is crucial to detect people with SARS-CoV-2, the virus responsible for the COVID 19 pan-demic (see e.g. [1], [2], [6], [3], [14]). In this vein, on March 16th2020, the Director-General of the WHO strongly advised countries to “test, test, test” because “a fire cannot be fought blindfolded”.1 But in many countries, tests are too scarce a resource to guarantee widespread and comprehensive testing (see e.g. [13]). Countries have set up guidelines spelling out the priority of who should get tested given that not all people can be tested. But this is only one side of the story and does not address the question of how to allocate a limited amount of tests across sub-national levels. We provide in this paper a data-driven and operational criterion that distributes tests according to how the virus spreads during the pandemic in different geographical units that either accelerate or decelerate.
The idea of the criterion is to base the allocation decision of a limited number of tests on data about the marginal benefit of an additional test. Such marginal benefit can be measured directly on the basis of a function representing the dynamics of the pandemic. Such a function is estimated using data on the numbers of both COVID-19 confirmed cases and total tests. Section 2 explains what information is necessary to calculate this function in real-time and how to derive the weights for the distribution of tests on a sub-national level. In Section 3 we apply this criterion to Italian regions, where certain regions struggle more than others with the pandemic. We compute the optimal shares of tests for each region and compare it with the actual distribution. Our main conclusion is that there is room for significant improvement in the geographical allocation of COVID-19 tests across Italian regions.
An important point of our approach is that it does not provide predictive model but rather relates to now-casting analysis. Forecasting models typically have many parameters, are highly uncertain at times of unknown and new events and can fall prey to estimation errors. Our data-driven criterion builds upon non-parametric estimation and as such constitutes an important real-time source of information for decision-makers, complements traditional epidemiological models and is amenable to public health analysis.
2
Characterization of the Testing Allocation Criterion
Our criterion builds upon a new approach that is designed to monitor and respond to a pandemic like COVID-19 (see [12]). The approach organises the data in real time in order to detect whether an ongoing pandemic is accelerating or decelerating. It is based on the idea that in times of thick uncertainty, when it is difficult to have precise estimates of probabilities and thus difficult to make reliable forecasting models, decisions should arguably put more weight on the information available in real time. Following [17] and [12], the question is how we can use available information
1
https://www.who.int/dg/speeches/detail/who-director-general-s-opening-remarks-at-the-media-briefing-on-covid-19—16-march-2020-last access April 14th2020
Covid Economics
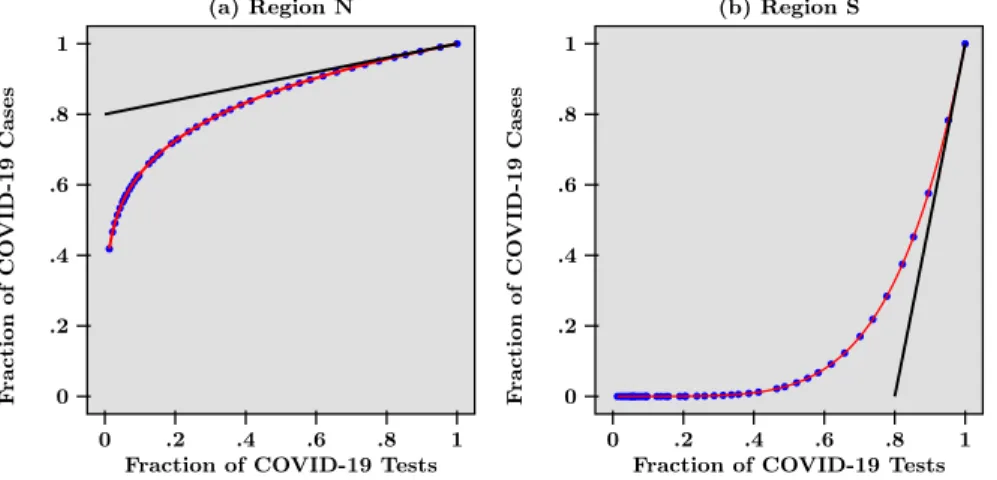
Figure 1: Epidemic Dynamics in Two Hypothetical Regions with Different Dynamics
(a) Region N
Fraction of COVID-19 Tests
0 .2 .4 .6 .8 1 F raction of CO VID-19 Cases 0 .2 .4 .6 .8 1 (b) Region S
Fraction of COVID-19 Tests
0 .2 .4 .6 .8 1 F raction of CO VID-19 Cases 0 .2 .4 .6 .8 1
Note: Blue dots represent the Fraction of Total COVID-19 Cases (y-axis) against Fraction of COVID-19 Tests (x-axis) across Time, for Region Q in panel (a) and Region S in panel (b). Fraction of realised tests (resp. of cases) equals the cumulative number of tests realised (resp. cases) on day t divided by the cumulative number of tests (resp. cases) realised at the end date T - Red lines are the functional relationship between positive cases and total tests and depict the dynamic of the pandemic - Black Lines are the tangent lines od the functions in red at end point, the slopes of which measure the marginal benefits of testing at end point.
to detect acceleration or deceleration of harm in the current case of the pandemic. To answer this question the number of tests is crucial. Tests allow visualising the spread of the pandemic and are therefore a precondition for a reliable real-time analysis. If ever more cases of infected people are detected with an increasing number of total tests, the pandemic is accelerating. If, on the contrary, ever fewer infected people are detected with an increasing number of test, the pandemic is decelerating. This insight can be visualised by plotting the cumulated number of cases that have been tested positively against the cumulated number of total tests. The convexity of such functional relationship indicates acceleration, concavity deceleration. This is an important real-time guide for health policy decisions that aim to curb the pandemic: what health policy decision want to achieve and to keep is a concave functional relationship of positively tested subjects to total tests and eventually a flat relationship that indicates the end of the pandemic.2
We illustrate our approach by considering the following hypothetical example. A country has been subject to an epidemic like COVID-19 for several weeks. This country is composed of two regions labeled, say, N and S. While in region N, the virus spread rapidly from very early on, region S only saw a few cases at the beginning but experienced subsequently a rapid increase of infected people.
2 Tests may also be an important health policy response to contain the pandemic, but this is not what we
are discussing here. In this paper, testing allows to know about the pandemic spread whatever the health policy response put in place.
Covid Economics
The pandemic has followed different dynamics across the two regions and the resulting hetero-geneity is best visualized in Figure 1. Figure 1 depicts a scatter-plot of the number of COVID-19 tests against the number of COVID-19 cases, for hypothetical daily data from the two regions N and S, at a given date that we think of as today (the blue dots). Both the number of cases and the number of tests are normalized by dividing raw data over the last data point available today. The red lines in Figure 1 are the functional relationship between positive cases and total tests and thus represent the dynamics of the pandemic in each region. While in Figure 1 panel (a) this line is concave and indicates that tests find ever fewer infected people, in Figure 1 panel (b), the line is convex and points to the fact that tests find ever more cases of infected people. Said differently, what testing tells us is that while in region N the pandemic is decelerating, in region S it is accelerating.
With that interpretation in mind, deriving a criterion for allocating a given number of tests across the two regions is straightforward. The most important information is the marginal benefit of an additional test in each region. Knowing this, it is possible to compute the proportion of total available tests at the national level that each region should get. It should be obvious that a larger fraction of tests should go to the region where the marginal test is higher.
In Figure 1, the marginal benefit of a test is measured by the slope of the tangent of each curve at x = 1, which is the end point of each graph.3 Marginal benefits are depicted as the black lines, tangent to the red curve in Figure 1 panels (a) and (b). Given the steepness of the tangent in Figure 1 panel (b) due to the acceleration of the pandemic, it is obvious that more tests should be done in region S than in region N. Both curves in Figure 1 are the graphs of power function, so that in this example the slope at x = 1 is directly given by the exponent, which equals 0.2 for region N and 5 for region S. These numbers are interpreted as follows. In region N, the most recent 10% of the total number of test have helped uncover 2% (that is, 0.2×10) of total confirmed infections. This is much less than in region S, where the most recent 10% are associated with the detection of 50% (that is, 5 × 10) of the total number of COVID-19 cases. In that sense, more testing is needed in region S than in region N. Therefore, given that the marginal benefit of an additional test in region S is 25 (that is, 5/0.2) times higher than in region N, the number of total tests available today should be divided as follows. Region S would get about 96% (that is, 5/5.2) while region N would get the remainder 4% (that is, 0.2/5.2).
It goes without saying that shares should be updated regularly, given the time-varying nature of the weights defined using our criterion, following changes in the marginal benefits/slopes of some regions relative to others. For example, the allocations derived from the early points in Figure 1 would imply that more tests should go to region N than to region S. Although the above weights do not take into account population in each region, it is straightforward to combine them with population weights, as we now show. We summarize below, for convenience, the steps to compute
3The marginal benefit of testing as defined here is reminiscent of distributional weights used in public policy
analysis–see [7] for a discussion on distributional weights for health policies.
Covid Economics
such weights and the corresponding share for each sub-national level, i = 1, . . . , n:
Criterion to allocate COVID-19 tests across sub-national levels i = 1, . . . , N , with population ni:
• for each sub-national level i, estimate a smooth curve from the scatter-plot of the number of confirmed COVID-19 cases against the number of COVID-19 tests across time. Estimate next at end point, that is, at the latest date for which data is available, the slope of such a curve for each i, which delivers a weight wi
• each sub-national level i should receive a share of the total number of tests available at the national level that is defined by Ai = wini
Pn iwini,
taking into account population. Alternatively, such a share is defined as ai= wi
Pn
iwi if population is not accounted for.
3
An Application to Italian Regions
Italy is in a national lock-down period since March 9th 2020. About a month later, the number of newly detected cases are decreasing every day on a national level. However, across regions, the pandemic spread was and still is not uniform. As it is commonly known, regions such as Lombardia and Veneto have seen very high numbers of infected people as well as deaths, whereas more southern regions have had much fewer cases. Although testing has been deficient at the early stage of the pandemic (see [13]), Italy has successively implemented an aggressive testing strategy reaching a total of over a million tests by mid-April. These are many tests but still a low number for a population of about 60 million inhabitants. Given this limited number of possible tests for a large population, the crucial but still open question is how to distribute tests efficiently, in particular in view of the differences in pandemic dynamics across regions.
The data we use is made publicly available by the Italian Department of Civil Protection4 from which can be accessed the official dashboard that monitors the situation of the COVID-19 pandemic in Italy (“Mappa della situazione”). This map provides the link to data that contains information on all Italian regions.5 There are 20 regions, but the data has 21 entries because the region of Trentino-Alto Adige counts for two to take account of the two autonomous provinces (P.A.) that form that region, named P.A. Bolzano and P.A. Trento in the data set. From this
4
http://www.protezionecivile.gov.it/home: last access April 14th2020
5
https://github.com/pcm-dpc/COVID-19/tree/master/dati-regioni: last access April 14th2020
Covid Economics
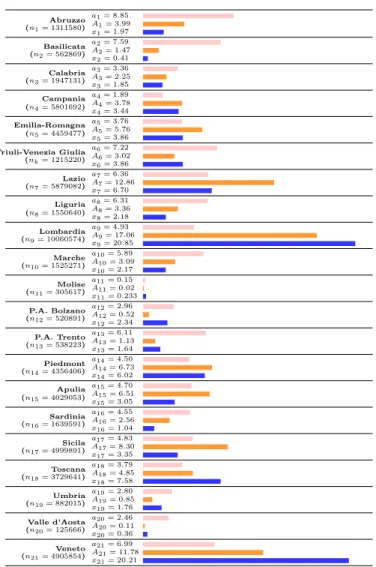
Figure 2: Optimal Allocations of tests in Italian regions as compared to actual allocation Abruzzo (n1= 1311580) a1= 8.85 A1= 3.99 x1= 1.97 Basilicata (n2= 562869) a2= 7.59 A2= 1.47 x2= 0.41 Calabria (n3= 1947131) a3= 3.36 A3= 2.25 x3= 1.85 Campania (n4= 5801692) a4= 1.89 A4= 3.78 x4= 3.44 Emilia-Romagna (n5= 4459477) a5= 3.76 A5= 5.76 x5= 3.86 Friuli-Venezia Giulia (nk= 1215220) a6= 7.22 A6= 3.02 x6= 3.86 Lazio (n7= 5879082) a7= 6.36 A7= 12.86 x7= 6.70 Liguria (n8= 1550640) a8= 6.31 A8= 3.36 x8= 2.18 Lombardia (n9= 10060574) a9= 4.93 A9= 17.06 x9= 20.85 Marche (n10= 1525271) a10= 5.89 A10= 3.09 x10= 2.17 Molise (n11= 305617) a11= 0.15 A11= 0.02 x11= 0.233 P.A. Bolzano (n12= 520891) a12= 2.96 A12= 0.52 x12= 2.34 P.A. Trento (n13= 538223) a13= 6.11 A13= 1.13 x13= 1.64 Piedmont (n14= 4356406) a14= 4.50 A14= 6.73 x14= 6.02 Apulia (n15= 4029053) a15= 4.70 A15= 6.51 x15= 3.05 Sardinia (n16= 1639591) a16= 4.55 A16= 2.56 x16= 1.04 Sicila (n17= 4999891) a17= 4.83 A17= 8.30 x17= 3.35 Toscana (n18= 3729641) a18= 3.79 A18= 4.85 x18= 7.58 Umbria (n19= 882015) a19= 2.80 A19= 0.85 x19= 1.76 Valle d’Aosta (n20= 125666) a20= 2.46 A20= 0.11 x20= 0.36 Veneto (n21= 4905854) a21= 6.99 A21= 11.78 x21= 20.21
Note: The figure presents the optimal allocations for each region as well as the mean actual allocation of tests in the last three days in the region (xi, i ∈ 1 . . . 21). ni, k ∈ 1 . . . 21, is the number of inhabitants in the region. ai, i ∈ 1 . . . 21, is the optimal allocation that does not account for population size whereas Ai, i ∈ 1 . . . 21, is the optimal allocation that ponderates by population size ni. Pink (resp. orange and blue) bar represents the optimal allocation (resp. the optimal allocation weighted by population size and the mean actual allocation).
dataset, we use the information on the total number of tests performed (“tamponi”) and the total number of positive cases (“totale casi”) for each region, which is updated on a daily basis.
We estimate both the functional relationship between the total number of tests and the total
Covid Economics
number of positive case for each region and its first derivative non-parametrically by local polyno-mial regression fitting with Epanechnikov weights [15]. The method allows to fit a smooth curve relating tests and cases without imposing restrictive parametric restrictions on the functional form [9]. We report in Figure 2 the estimated (population-unweighted) optimal shares ai, i = 1 . . . 21, and the (population-weighted) optimal shares Ai, i = 1 . . . 21, using the mean estimate of the first derivative on the last 2.5% of output design points (see Appendix A and B for the detailed results). We also report as a benchmark the mean actual allocation of tests in the last three days of the observed sample, for comparison purpose.
In Figure 2, each line represents an Italian region, whose population niappears in parentheses under the name of the region in the first column. In the second column we report the population-weighted and population-unpopulation-weighted shares, respectively, Ai and ai, as well as the actual share denoted xi. The third column helps visualising those shares. As can be seen in Figure 2, differences between the optimal shares as computed by using our (population-weighted and unweighted) criterion and actual shares of tests in all regions are significant. A striking conclusion is that certain regions currently receive too many tests, compared to others who have received too little. In particular, a substantial share of tests conducted in regions such as Lombardia, Veneto and Emilia-Romagna, where the pandemic spread more rapidely at the beginning, should be allocated to other regions. This is particularly true if we consider the population-unweighted share ai of tests but also if we take the population-weighted share Ai into account. However, what also becomes apparent is that Lombardia and Veneto have currently about the same share of total tests allocated (about 20% each) despite the fact that Veneto has only about half of the population of Lombardia. Our population-weighted criterion Aitakes this into account and allocates more tests to Lombardia than to Veneto given its population size. If we continue to focus on the population-weighted share Ai, another striking example are the regions of Lazio, but also Sicily, which should receive a much larger share of tests, given the number of inhabitants in those regions, than they currently do. Indeed, Lazio, the second most populated region, should receive twice as many tests as it currently does, that is about 13% of the total number of Italian tests. This is because both its marginal benefit of testing and its regional population are among the largest across Italy. Sicily is in a similar situation and should also get twice as many tests. Generally, in view of Figure 2, it is hard to conclude that tests have been allocated across Italian regions where they are the most efficient and mostly needed. Obviously, to achieve the goal of efficient distribution of tests, it is important that regional governments and administrations are team-players and a nation-wide coordination is possible.
4
Conclusion
In this paper, we provide a data-driven and operational criterion that allows to distribute efficiently a limited amount of tests across sub-national units, depending on the dynamic of the pandemic.
Covid Economics
This allocation enhances the likelihood of detecting the largest possible number of infected persons. Knowing about the number of infected people is crucial to understand in real-time whether the dynamics of pandemic is accelerating or decelerating. If with an increasing number of tests ever more positive cases are found, the harm of the pandemic is accelerating. If with an increasing number of tests the number of detected positive cases declines on a daily basis, the pandemic starts to be contained and harm decelerates. We represented this in terms of a scatter-plot of total number of positive cases over total number of tests and pointed to the curvature of the underlying functional relationship. The pandemic ends when further tests do not find any new positive cases and the functional relationship becomes a flat line. The test-distribution criterion uses the information of the tangent to this functional form at endpoint, which we claim is a useful measure of the marginal benefit of testing. The policy implication of our criterion is that more tests will be needed in regions where the tangent is steeper and indicates an acceleration of the pandemic in comparison to regions where the tangent is flatter and thus means that the pandemic is spreading less quickly. Our criterion could be combined with group or pool testing (see [10] and [8]) and drive-in testing ([11] and [19]) so as to use the limited amount of test capacity in a best way in each region or province. Pool testing is currently developed and implemented in Germany ([16]) and Israel6. We show how the criterion can be applied to Italy and its regions where the pandemic had a very different dynamic. We find that the current actual allocation of tests across regions is not efficient with respect to the criterion we provide in this paper. In particular, there should be a shift in testing from certain regions where the pandemic at first spread very quickly but has subsequently been more and more controlled, to some of those regions where the pandemic started out slower, but seems to speed up more recently.
Although our application makes use of Italian data, a similar exercise could obviously be done for other countries where more fine-tuned regional data is available. Using such a criterion will be particularly important at a moment where certain countries start considering to remove at least some aspects of the lock-down. Removing the lock-down will certainly trigger a change in the dynamic of the pandemic and it is crucial to have real-time evaluations of the re-opening of the social and economic life as well as a tool to allocate tests efficiently within the country. It goes without saying that this criterion could also be used across nations and in particular for political unions such as the European Union to efficiently allocate tests across member countries. It has become clear quite soon that certain countries were better prepared for testing from very early on than others. In this context, it turns out that the often cited aspect of “European solidarity” may have most usefully been an economic principle of efficient testing.
6
https://www.timesofisrael.com/to-ease-global-virus-test-bottleneck-israeli-scientists-suggest-pooling-samples/
Covid Economics
References
[1] Bedford J., Enria D., Giesecke J., et al. COVID-19 (2020): Towards Controlling of a Pandemic. The Lancet S0140-6736(20)30673-5. Available at https://doi.org/10.1016/ S0140-6736(20)30673-5
[2] Binnicker, M.J. (2020): Emergence of a Novel Coronavirus Disease (COVID-19) and the Importance of Diagnostic Testing: Why Partnership between Clinical Laboratories, Pub-lic Health Agencies, and Industry Is Essential to Control the Outbreak. Clinical Chemistry hvaa071 Available at https://doi.org/10.1093/clinchem/hvaa071
[3] COVID-19 National Emergency Response Center, Epidemiology and Case Management Team, Korea Centers for Disease Control and Prevention (2020): Contact Transmission of COVID-19 in South Korea: Novel Investigation Techniques for Tracing Contacts. Osong Pub-lic Health Res Perspect 2020, 11:60-63. Available at https://doi.org/10.24171/j.phrp. 2020.11.1.09
[4] De Brabanter, K., and Liu, Y. (2015): Smoothed Nonparametric Derivative Estimation Based on Weighted Difference Sequences, In Stochastic Models, Statistics and Their Applications, A. Steland, E. Rafajlowicz, K. Szajowski (Eds.), Chapter 4 (pp. 31-38), Springer.
[5] ECDC technical report (2020): Guidelines for the use of non-pharmaceutical mea-sures to delay and mitigate the impact of 2019-nCoV. European Center for Dis-ease Countrol. https://www.ecdc.europa.eu/sites/default/files/documents/ novel-coronavirus-guidelines-non-pharmaceutical-measures_0.pdf
[6] Fineberg, H.V. (2020): Ten Weeks to Crush the Curve. New England Journal of Medicine 10.1056/NEJMe2007263. Available at https://www.nejm.org/doi/full/10.1056/ NEJMe2007263
[7] Fleurbaey, M, Luchini, S., Muller, C. and E. Schokkaert (2013): Equivalent Income and fair evaluation of health care. Health economics, 22(6) 711-729. Available at https:// onlinelibrary.wiley.com/doi/abs/10.1002/hec.2859
[8] Gollier, C., and Gossner, O. (2020): Group Testing against Covid-19. Covid Economics, Issue 2. Available at https://cepr.org/sites/default/files/news/CovidEcon1%20final.pdf [9] Harrel, F.Z. Jr (2015). Regression Modeling Strategies: With Applications to Linear Models,
Logistic and Ordinal Regression, and Survival Analysis. Springer.
[10] Jain, B.N., and Jain, T. (2020). Accelerated Infection Testing at Scale: a Proposal for In-ference with Single Test on Multiple Patients. Available at https://arxiv.org/ftp/arxiv/ papers/2003/2003.13282.pdf
Covid Economics
[11] Kwon, K.T., Ko J.H., Shin H., Sung M., Kim J.Y. (2020): Drive-Through Screening Center for COVID-19: a Safe and Efficient Screening System against Massive Community Outbreak. Journal of Korean Medical Science 35:e123. Available at https://doi.org/10.3346/jkms. 2020.35.e123
[12] Luchini, S., Teschl, M., Pintus, P.A., Baunez, C., Degoulet, M., and Moatti, J.P. (2020): Urgently Needed for Policy Guidance: An Operational Tool for Monitoring the COVID-19 Pandemic. AMSE working paper 2020-09, available at https://ssrn.com/abstract=3563688 and https://www.amse-aixmarseille.fr/en/research/working-papers
[13] Rosenbaum, L. (2020): Facing Covid-19 in Italy - Ethics, Logistics, and Therapeutics on the Epidemic’s Front Line. New England Journal of Medicine 10.1056/NEJMp2005492. Available at https://doi.org/10.1056/NEJMp2005492
[14] Salathé M., Christian A., Richard N., et al. COVID-19 (2020): Epidemic in Switzerland: on the Importance of Testing, Contact Tracing and Isolation. Available at https://doi.org/ 10.4414/smw.2020.20225
[15] Seifert, B., Brockmann, M., Engel, J. and T. Gasser (1994) Fast algorithms for nonparametric curve estimation. J. Computational and Graphical Statistics 3, 192-213. Available at https: //www.tandfonline.com/doi/abs/10.1080/10618600.1994.10474638
[16] Seifried, E., Ciesek, S., et al. (2020): Pool testing of SARS-CoV-02 samples increases worldwide test capacities many times over. Available at https://aktuelles.uni-frankfurt.de/englisch/
pool-testing-of-sars-cov-02-samples-increases-worldwide-test-capacities-many-times-over/ [17] Taleb, N. (2012). Antifragile, things that gain from disorder. Random House.
[18] Watkins, J. (2020): Preventing a covid-19 pandemic. BMJ 368:m810. Available at https: //doi.org/10.1136/bmj.m810
[19] Won, J., Lee S., Park M., et al. (2020): Development of a Laboratory-safe and Low-cost De-tection Protocol for SARS-CoV-2 of the Coronavirus Disease 2019 (COVID-19). Experimental Neurobiology 10.5607/en20009. Available at https://doi.org/10.5607/en20009
Covid Economics
A
Epidemic Dynamics in Italian Regions
In the following figures, we present for each region a scatter-plot of the raw data as well as of the non parametric estimation of the functional relationship between the fraction of COVID-19 tests tests and the fraction of COVID-19 cases. The fraction of COVID-19 tests is the daily obervation of the cumulative sum of tests divided by the total number of tests observed at the end date. The fraction of COVID-19 cases is the daily observation of the cumulative sum of positive cases divided by the total number of cases observed at the end date. Blue dots correspond to raw data. Each blue dot corresponds to a daily observation. The lowest dot (down, left) on on each Figure is the first date and the highest (up, right) dot corresponds to the end date. The red line is the non parametric estimation of the functional relationship between tests and cases using local polynomial regression fitting with Epanechnikov weights. The plain line in black is the tangent line derived from the end point from a non-parametric estimate of the first derivative of the functional relationship. The dashed line is the tangent line obtained from the mean first derivative estimate of the last 2.5% output design points and the dotted line is the tangent line derived from the mean first derivative estimate of the 10% output design points – see Appendix B for numerical results.
Covid Economics
(1) Abruzzo
Fraction of COVID-19 Tests 0 .125 .25 .375 .5 .625 .75 .875 1 F raction of CO VID-19 Cases 0 .125 .25 .375 .5 .625 .75 .875 1 (2) Basilicata
Fraction of COVID-19 Tests 0 .125 .25 .375 .5 .625 .75 .875 1 F raction of CO VID-19 Cases 0 .125 .25 .375 .5 .625 .75 .875 1 (3) Calabria
Fraction of COVID-19 Tests 0 .125 .25 .375 .5 .625 .75 .875 1 F raction of CO VID-19 Cases 0 .125 .25 .375 .5 .625 .75 .875 1 (4) Campania
Fraction of COVID-19 Tests 0 .125 .25 .375 .5 .625 .75 .875 1 F raction of CO VID-19 Cases 0 .125 .25 .375 .5 .625 .75 .875 1 (5) Emilia-Romagna
Fraction of COVID-19 Tests 0 .125 .25 .375 .5 .625 .75 .875 1 F raction of CO VID-19 Cases 0 .125 .25 .375 .5 .625 .75 .875 1
(6) Friuli Venezia Giulia
Fraction of COVID-19 Tests 0 .125 .25 .375 .5 .625 .75 .875 1 F raction of CO VID-19 Cases 0 .125 .25 .375 .5 .625 .75 .875 1
Covid Economics
12, 1 May 2020: 192-209
(7) Lazio
Fraction of COVID-19 Tests 0 .125 .25 .375 .5 .625 .75 .875 1 F raction of CO VID-19 Cases 0 .125 .25 .375 .5 .625 .75 .875 1 (8) Liguria
Fraction of COVID-19 Tests 0 .125 .25 .375 .5 .625 .75 .875 1 F raction of CO VID-19 Cases 0 .125 .25 .375 .5 .625 .75 .875 1 (9) Lombardia
Fraction of COVID-19 Tests 0 .125 .25 .375 .5 .625 .75 .875 1 F raction of CO VID-19 Cases 0 .125 .25 .375 .5 .625 .75 .875 1 (10) Marche
Fraction of COVID-19 Tests 0 .125 .25 .375 .5 .625 .75 .875 1 F raction of CO VID-19 Cases 0 .125 .25 .375 .5 .625 .75 .875 1 (11) Molise
Fraction of COVID-19 Tests 0 .125 .25 .375 .5 .625 .75 .875 1 F raction of CO VID-19 Cases 0 .125 .25 .375 .5 .625 .75 .875 1 (12) P.A. Bolzano
Fraction of COVID-19 Tests 0 .125 .25 .375 .5 .625 .75 .875 1 F raction of CO VID-19 Cases 0 .125 .25 .375 .5 .625 .75 .875 1
Covid Economics
12, 1 May 2020: 192-209
(13) P.A. Trento
Fraction of COVID-19 Tests 0 .125 .25 .375 .5 .625 .75 .875 1 F raction of CO VID-19 Cases 0 .125 .25 .375 .5 .625 .75 .875 1 (14) Piemonte
Fraction of COVID-19 Tests 0 .125 .25 .375 .5 .625 .75 .875 1 F raction of CO VID-19 Cases 0 .125 .25 .375 .5 .625 .75 .875 1 (15) Puglia
Fraction of COVID-19 Tests 0 .125 .25 .375 .5 .625 .75 .875 1 F raction of CO VID-19 Cases 0 .125 .25 .375 .5 .625 .75 .875 1 (16) Sardegna
Fraction of COVID-19 Tests 0 .125 .25 .375 .5 .625 .75 .875 1 F raction of CO VID-19 Cases 0 .125 .25 .375 .5 .625 .75 .875 1 (17) Sicilia
Fraction of COVID-19 Tests 0 .125 .25 .375 .5 .625 .75 .875 1 F raction of CO VID-19 Cases 0 .125 .25 .375 .5 .625 .75 .875 1 (18) Toscana
Fraction of COVID-19 Tests 0 .125 .25 .375 .5 .625 .75 .875 1 F raction of CO VID-19 Cases 0 .125 .25 .375 .5 .625 .75 .875 1
Covid Economics
12, 1 May 2020: 192-209
(19) Umbria
Fraction of COVID-19 Tests 0 .125 .25 .375 .5 .625 .75 .875 1 F raction of CO VID-19 Cases 0 .125 .25 .375 .5 .625 .75 .875 1 (20) Valle d’Aosta
Fraction of COVID-19 Tests 0 .125 .25 .375 .5 .625 .75 .875 1 F raction of CO VID-19 Cases 0 .125 .25 .375 .5 .625 .75 .875 1 (21) Veneto
Fraction of COVID-19 Tests 0 .125 .25 .375 .5 .625 .75 .875 1 F raction of CO VID-19 Cases 0 .125 .25 .375 .5 .625 .75 .875 1
Covid Economics
12, 1 May 2020: 192-209
B
Numerical Estimates
In the following tables, we present the estimated efficient allocations using different non-parametric estimates of the first derivative at the end date: (1) the end point estimate, (2) the mean estimate of the last 2.5% output design points and (3) the mean estimate of the last 10% outut design points. The sensitivity analysis indicates that efficient allocation shares are robust to the choice of the first estimate derivative. We consider that the mean estimate of the last 2.5% output design points offers the most versatility for our purpose in our setting.
B.1 Efficient Allocations with End Point Estimate
Region Inhabitants (ni) Weight (wi) Allocation (ai) Allocation (Ai) Actual All. (xi)
Abruzzo 1.311.580 1.354 9.27 4.19 1.970 Basilicata 562.869 1.147 7.85 1.52 0.411 Calabria 1.947.131 0.466 3.19 2.14 1.853 Campania 5.801.692 0.229 1.57 3.14 3.444 Emilia-Romagna 4.459.477 0.497 3.40 5.23 9.746 Friuli-Venezia Giulia 1.215.220 1.077 7.37 3.09 3.086 Lazio 5.879.082 0.949 6.50 13.17 6.702 Liguria 1.550.640 0.928 6.35 3.40 2.176 Lombardia 10.060.574 0.732 5.01 17.38 20.862 Marche 1.525.271 0.871 5.96 3.13 2.168 Molise 305.617 -0.010 0.07 -0.01 0.233 P.A. Bolzano 520.891 0.405 2.78 0.50 2.339 P.A. Trento 538.223 0.908 6.21 1.15 1.638 Piedmont 4.356.406 0.643 4.40 6.61 6.012 Apulia 4.029.053 0.679 4.65 6.46 3.052 Sardinia 1.639.591 0.651 4.46 2.52 1.038 Sicilia 4.999.891 0.730 5.00 8.61 3.353 Toscana 3.729.641 0.547 3.74 4.81 7.575 Umbria 882.015 0.418 2.86 0.87 1.761 Valle d’Aosta 125.666 0.351 2.40 0.10 0.366 Veneto 4.905.854 1.035 7.09 11.99 20.214
Covid Economics
12, 1 May 2020: 192-209
B.2 Efficient Allocations with Last 2.5% Output Design Points
Region Inhabitants (ni) Weight (wi) Allocation (ai) Allocation (Ai) Actual All. (xi)
Abruzzo 1.311.580 1.248 8.85 3.99 1.970 Basilicata 562.869 1.071 7.59 1.47 0.411 Calabria 1.947.131 0.473 3.36 2.25 1.853 Campania 5.801.692 0.267 1.89 3.78 3.444 Emilia-Romagna 4.459.477 0.530 3.76 5.76 9.746 Friuli-Venezia Giulia 1.215.220 1.019 7.22 3.02 3.086 Lazio 5.879.082 0.898 6.36 12.86 6.702 Liguria 1.550.640 0.890 6.31 3.36 2.176 Lombardia 10.060.574 0.696 4.93 17.06 20.862 Marche 1.525.271 0.831 5.89 3.09 2.168 Molise 305.617 0.020 0.15 0.02 0.233 P.A. Bolzano 520.891 0.417 2.96 0.53 2.339 P.A. Trento 538.223 0.862 6.11 1.13 1.638 Piedmont 4.356.406 0.634 4.50 6.73 6.012 Apulia 4.029.053 0.663 4.70 6.51 3.052 Sardinia 1.639.591 0.641 4.55 2.56 1.038 Sicilia 4.999.891 0.681 4.83 8.30 3.353 Toscana 3.729.641 0.534 3.79 4.85 7.575 Umbria 882.015 0.396 2.80 0.85 1.761 Valle d’Aosta 125.666 0.347 2.46 0.11 0.366 Veneto 4.905.854 0.986 6.99 11.78 20.214
Covid Economics
12, 1 May 2020: 192-209
B.3 Efficient Allocations with Last 10% Output Design Points
Region Inhabitants (ni) Weight (wi) Allocation (ai) Allocation (Ai) Actual All. (xi)
Abruzzo 1.311.580 0.988 7.58 3.39 1.970 Basilicata 562.869 0.885 6.79 1.30 0.411 Calabria 1.947.131 0.500 3.84 2.55 1.853 Campania 5.801.692 0.370 2.84 5.61 3.444 Emilia-Romagna 4.459.477 0.618 4.74 7.20 9.746 Friuli-Venezia Giulia 1.215.220 0.880 6.75 2.80 3.086 Lazio 5.879.082 0.780 5.99 11.99 6.702 Liguria 1.550.640 0.801 6.14 3.25 2.176 Lombardia 10.060.574 0.619 4.75 16.29 20.862 Marche 1.525.271 0.738 5.66 2.94 2.168 Molise 305.617 0.120 0.92 0.10 0.233 P.A. Bolzano 520.891 0.457 3.51 0.62 2.339 P.A. Trento 538.223 0.752 5.77 1.06 1.638 Piedmont 4.356.406 0.621 4.77 7.08 6.012 Apulia 4.029.053 0.632 4.85 6.66 3.052 Sardinia 1.639.591 0.625 4.79 2.68 1.038 Sicilia 4.999.891 0.571 4.38 7.46 3.353 Toscana 3.729.641 0.509 3.90 4.96 7.575 Umbria 882.015 0.347 2.66 0.80 1.761 Valle d’Aosta 125.666 0.352 2.70 0.12 0.366 Veneto 4.905.854 0.869 6.67 11.15 20.214