Ankle Mechanical Impedance Under Muscle Fatigue
The MIT Faculty has made this article openly available.
Please share
how this access benefits you. Your story matters.
Citation
Wang, Shuo, Hyunglae Lee, and Neville Hogan. “Ankle Mechanical
Impedance Under Muscle Fatigue.” ASME, 2013. V003T43A006. ©
2013 by ASME
As Published
http://dx.doi.org/10.1115/DSCC2013-4060
Publisher
ASME International
Version
Final published version
Citable link
http://hdl.handle.net/1721.1/107229
Terms of Use
Article is made available in accordance with the publisher's
policy and may be subject to US copyright law. Please refer to the
publisher's site for terms of use.
ANKLE MECHANICAL IMPEDANCE UNDER MUSCLE FATIGUE
Shuo Wang1 Hyunglae Lee1 Neville Hogan1, 2
[email protected] [email protected] [email protected]
1 Department of Mechanical Engineering, Massachusetts Institute of Technology, Cambridge MA 02139 2 Department of Brain and Cognitive Science, Massachusetts Institute of Technology, Cambridge, MA 02139
ABSTRACT
This paper reports preliminary results on the effects of ankle muscle fatigue on ankle mechanical impedance. The experiment was designed to induce fatigue in the Tibialis Anterior and Triceps Surae muscle group by asking subjects to perform isometric contractions against a constant ankle torque generated by the Anklebot, a backdriveable robot that interacts with the ankle in two degrees of freedom. Median frequencies of surface electromyographic signals collected from Tibialis Anterior and Triceps Surae muscle group were evaluated to assess muscle fatigue. Using a standard input and multi-output stochastic impedance identification method, multivariable ankle mechanical impedance was measured in two degrees of freedom under muscle fatigue. Preliminary results indicate that, for both Tibialis Anterior and Triceps Surae muscle group, ankle mechanical impedance decreases in both the dorsi-plantarflexion and inversion-eversion directions under muscle fatigue. This finding suggests that decreasing ankle impedance with muscle fatigue may help to develop joint support systems to prevent ankle injuries caused by muscle fatigue.
INTRODUCTION
Ankle dynamic behavior has been studied widely because of its impact on lower extremity function. Ankle mechanical impedance changes with varying force production and may also be expected to decrease with fatigue. Muscle fatigue reduces the maximal force muscle can produce [1]. Investigating ankle mechanical impedance under muscle fatigue will facilitate the design of ankle joint support systems and exoskeletons to compensate for fatigue, leading to potential applications on rehabilitation and the protection of the ankle in military and athletic scenarios.
Multi-variable static and dynamic ankle mechanical
impedance in two coupled degrees of freedom (DOF) have been previously studied [2-5]. Ankle impedance in the dorsiflexion-plantarflexion (DP) direction coupled with the inversion-eversion (IE) direction are characterized, and ankle impedance has been shown to be weakest in the IE direction [2-3]. In addition, muscle activation levels are linearly related to ankle mechanical impedance in the DP and IE directions [6]. However, no previous studies on the effects of muscle fatigue on multi-variable ankle mechanical impedance have been reported.
Muscle fiber conduction velocity is known to decrease as a result of fatigue during sustained muscle contractions, with multiple factors contributing to this phenomenon [7-10]. A direct consequence is a decrease in the frequency content of the measured surface electromyographic (EMG) signal. Thus, the median frequency of an EMG signal can be used to quantify the extent of fatigue [10]. Median frequency, defined as the frequency which divides the area under the power density spectrum in half, decreases over time. It typically exhibits a curvilinear behavior and is fit to an exponential curve [7, 10].
Many experiments have investigated muscle fatigue using isometric voluntary contractions [9,11-12]. These experiments report similar results on the changes of conduction velocity and median frequency, and the rate of change in median frequency is greater than in conduction velocity [7].
In this study, we induce muscle fatigue over a short period of time using voluntary isometric muscle contractions against a constant torque applied to the Tibialis Anterior (TA) and Triceps Surae (TS) muscle groups in separate trials, where TS includes Soleus (SOL), and Gastrocnemius (GA). We analyzed the median frequency shift of the EMG signals during these sustained contractions to measure fatigue. This
Proceedings of the ASME 2013 Dynamic Systems and Control Conference DSCC2013 October 21-23, 2013, Palo Alto, California, USA
DSCC2013-4060
study contributes a new understanding of the relationship between multi-variable ankle mechanical impedance and muscle fatigue.
METHODS Subjects
Two young subjects, with no history of neuromuscular disorders involving the ankle, were recruited for this study: one female (Age: 23, Height: 163cm, Weight: 63 kg) and one male (Age: 33, Height: 172cm, Weight: 61 kg). Informed consent was obtained as approved by MIT’s Committee on the Use of Human as Experimental Subjects.
Experimental Setup
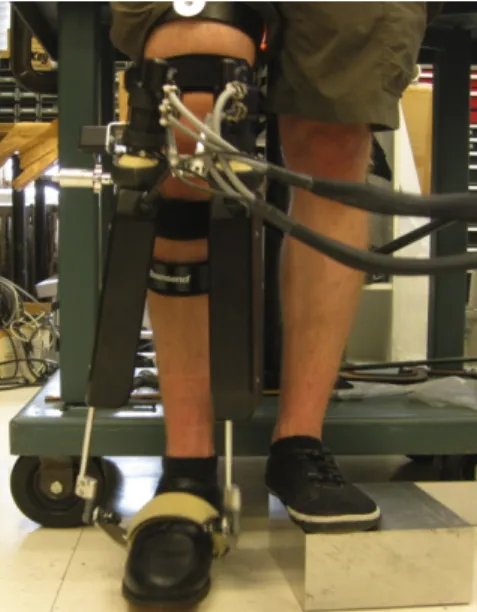
A wearable robot, Anklebot, and EMG sensors were attached to the subject’s dominant leg to measure ankle impedance and muscle activities (Figure 1). The Anklebot (Interactive Motion Technologies, Watertown, MA, USA) applied random torque perturbations to the ankle in the DP and IE directions. To measure muscle activation levels, EMG surface electrodes (Delsys, Boston, MA, USA) were attached to four primary muscles related to ankle dynamics: TA, Peroneus Longus (PL), SOL, and GA. The EMG signals were sampled at 1000 Hz, and their magnitudes were estimated by a root-mean-square method described in [13]. A visual feedback system presenting muscle activation levels was provided to help subjects to identify muscle activation levels. The specific Anklebot setup instructions were described in previously published studies from the author’s group [2, 14].
Figure 1. The Anklebot and knee brace were attached on a subject in the standing position with the dominant foot clear of the ground.
Experimental Protocol
We investigated ankle impedance under TA and TS muscle fatigue, where TS includes SOL and GA. In this preliminary study, we explored alternative procedures: for Subject 1,
fatigue was induced in TA and SOL and impedance was measured while seated; for Subject 2, fatigue was induced in TA and GA and impedance was measured in was measured while standing. In order to obtain references for active muscle studies, the maximal voluntary contraction (MVC) of each muscle, TA, PL, SOL, and GA was measured using the method recommended in [15].
To induce fatigue in both TA and TS in a short period of time, both subjects performed isometric muscle contractions against a constant torque generated by the Anklebot. The target active muscles were TA and TS, since the TA acts to dorsiflex the ankle, and the TS muscle groups act to plantarflex the ankle. While seated, all of the subjects were asked to activate TA and TS to 50% of MVC for three repetitions, and each repetition lasted for two minutes, following the method introduced in [7, 10]. If subjects could not maintain the constant 50% of MVC level for the entire two minutes period, we asked subjects to reach the maximal level they could maintain.
The subjects’ ankle mechanical impedances were measured at three distinct times during the experiment: before muscle fatigue, immediately after fatigue, and once more after 15 minutes of recovery from fatigue. At each of these times, the impedance was measured under three conditions: active TA (20% of MVC), active TS (20% of MVC), and fully relaxed muscle conditions, respectively. Measurements were repeated twice in each case. It is typically difficult for some subjects to maintain constant muscle activations that are higher than 20% of MVC. To investigate the effect of muscle fatigue, ankle mechanical impedance should be measured under consistent muscle activation levels across pre- and post-fatigue protocol; therefore, we asked subjects to maintain the 20% of MVC muscle activation level for both TA and TS.
The Anklebot stiffness applied to TA activation was 1000 N/m, while to TS activation was 2000 N/m. Positive Anklebot stiffness was applied to retain the nominal ankle position at a nominal neutral position. A larger value was set for the TS study since larger restoring torque was needed to oppose plantarflexion torque, which was typically greater than for the TA study.
Data Analysis Method
Median frequencies of EMG signals collected from TA and TS isometric contractions were evaluated and compared based on the power spectral density (PSD) using MATLAB PSD function [16]. Median frequency, fmedian, is the frequency
at which half of the area under the PSD lies at lower frequencies and half at higher frequencies.
Welch’s periodogram approach (MATLAB’s pwelch function) was used to calculate auto-power spectral density. The number of points for Fast Fourier Transform was set to be 1024. A periodic Hamming window was used to provide 50% overlap of the window size, 0.5 s. EMG signals were analyzed in three sessions based on time: 1– 40s, 41 – 80s and 81–
120s. The median frequency of each session was calculated as 0
S( f )df
fmedian∫
=
1
2
0S( f )df
fs∫
(1)where PSD is denoted as S (f).
Ankle mechanical impedance was estimated by a standard non-parametric multi-input multi-output (MIMO) stochastic identification method [17]. Mild random white noise inputs (bandwidth of 100 Hz) were applied to each actuator of the Anklebot for a duration of 40 seconds. Correlation based spectral analysis was applied to the time history of torques and corresponding angular displacements at the ankle joint to identify ankle impedance in two major directions: DP and IE. Torque and angular displacement signals were sampled at 1000 Hz. Details of ankle impedance identification methods were described in [2].
Jarque-Bera tests (MATLAB, jbtest function) were applied to find normality of data, and one-way ANOVA was used to calculate the differences of muscle activation level and impedance change between pre-fatigue, post-fatigue 1, and post-fatigue 2. Moreover, we used Tukey’s honestly significant different (HSD) test for pairwise comparisons.
RESULTS
In this study, we investigated the ankle mechanical impedance under muscle fatigue. Muscle activities and ankle mechanical impedance of two subjects were evaluated and compared, and the results have shown that ankle mechanical impedance decreases under muscle fatigue.
Muscle Fatigue
Over the two-minute muscle fatigue experiment, we noticed that subjects could only maintain the target muscle activation levels, i.e. 50% of MVC for both TA and TS for at most 90s. Therefore, subjects were asked to reach the maximal level they could maintain for the remaining 30s. Subject 1, whose ankle mechanical impedance was measured in the seated position, could only reach TS 30 % of MVC.
The evaluation of median frequencies for EMG signals collected from 1- 40s (Initial), 41-80s (Mid), and 81-120s (Final) of muscle isometric contraction showed that median frequencies decreased over time, suggesting that muscles were fatigued in a short period of time. For each of the three trials that inducing TA and TS muscle fatigue, Final median frequencies were significantly lower (p < 0.05) than Initial median frequencies for both TA and TS (Figure 2).
Ankle Impedance
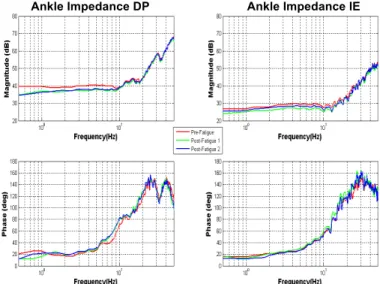
The ankle mechanical impedance was estimated by averaging the impedance magnitude in low frequency region from 0.5 to 5 Hz, where most of lower-extremity functions fall in this frequency range. Impedance magnitude below 0.5 Hz was not considered, since partial coherences below 0.5 Hz were very low. Bode plots from an example study were provided,
illustrating the impedance magnitude drop from pre-fatigue (pre) to post-fatigue (post1 and post 2) between low and median frequency regions (Figure 3).
Figure 2. This figure represents the decrease of median frequencies with time for both subjects. The three dots represent the median frequency of EMG signals collected from the fatigue protocol, 1- 40s, 41 – 80s, and 81- 120s (Initial, Mid, Final), respectively. The final median frequencies (81-120s) are significantly lower (p < 0.05) than the initial median frequencies (1-40s), suggesting TA and TS (GA and SOL) muscle fatigue.
Ankle Impedance DP Ankle Impedance IE
Figure 3. This figure represents bode plots of ankle mechanical impedance from an example study (Subject 2 active TA study) in both DP and IE directions. Impedance was calculated by averaging the magnitude from 0.5 to 5 Hz.
Muscle activation levels were consistent before and after the fatigue protocol for both targeting active muscles (TA or TS) and total measured muscles (TA, PL, SOL, and GA). Since activation of target muscles evokes activities in related muscles, it is necessary to show muscle activation consistency
of the total measured muscle as well as target active muscles. To show this consistency, we calculated the ratios of post-fatigue (Post1 and Post2) to pre-post-fatigue (Pre) muscle activation level; the ratios were close to 1 (Table 1). Post1 represented the ankle impedance measurement right after muscle fatigue; Post2 represented the ankle impedance measurement 15 minutes after muscle fatigue.
Measured at approximately same muscle activation levels, ankle mechanical impedance decreased under muscle fatigue in general. The ratios of ankle impedance measured from the post fatigue protocol (Post1 and Post2) to the pre fatigue protocol (Pre) were estimated in DP and IE directions for both TA and TS (Table 2). For Subject 1, all of the ratios were significantly less than 1 (p < 0.05), demonstrating that ankle mechanical impedance significantly decreased under fatigue in both DP and IE directions. For Subject 2, ankle mechanical impedance decreased in both DP and IE directions under TA muscle fatigue; however, the ankle impedance under TS muscle fatigue did not decrease (ratios are close or greater than 1). No preferential change of impedance was found in the DP or IE directions.
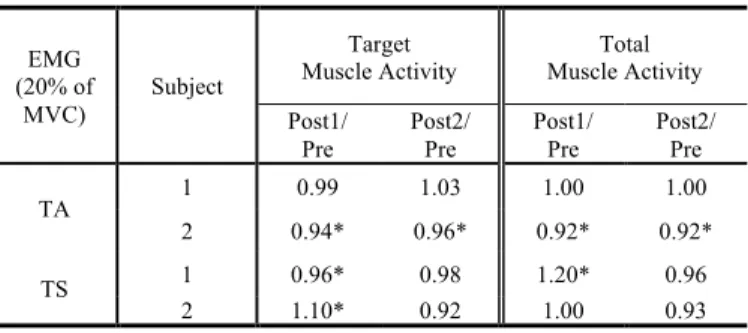
Table 1. Ratio of post-fatigue to pre-fatigue muscle activation levels of Target muscles (TA, TS) and Total muscles (TA, PL, SOL, GA)
EMG (20% of
MVC)
Subject
Target
Muscle Activity Muscle Activity Total Post1/ Pre Post2/ Pre Post1/ Pre Post2/ Pre TA 1 0.99 1.03 1.00 1.00 2 0.94* 0.96* 0.92* 0.92* TS 1 0.96* 0.98 1.20* 0.96 2 1.10* 0.92 1.00 0.93 Ratios of muscle activation levels between post-fatigue (Post1 and Post2) to pre-fatigue (Pre) impedance measurements were evaluated in TA and TS active studies for both Target muscles (TA and TS) and Total muscles (TA, SOL, GA, and PL) involving ankle movements. The ratios are not significantly different from 1 (p < 0.05), indicating the consistency of muscle activation of pre and post the fatigue protocol. * denotes statistically significantly different from 1 (p < 0.05).
Table 2. Ratio of post-fatigue ankle impedance
Impedance Subject DP IE Post1/ Pre Post2/ Pre Post1/ Pre Post2/ Pre TA 1 0.84* 0.81* 0.76* 0.82* 2 0.75* 0.78* 0.77* 0.89* TS 1 0.81* 0.68* 0.87* 0.84* 2 1.03 1.01 0.93 1.02 For Subject 1, the ratios are significantly less than 1 (p < 0.05), showing a clear impedance decrease under muscle fatigue for both TA and TS. Subject 2 showed a decrease of ankle impedance under TA muscle fatigue but not under TS. * denotes statistically significantly different from 1.
DISCUSSION
Studying ankle mechanical impedance under rapid muscle fatigue has application to athletic, clinical, and military contexts. This study has investigated the effects of TA and TS muscle fatigue on ankle mechanical impedance in 2 DOF, DP and IE directions. Our preliminary results showed that ankle mechanical impedance decreases under muscle fatigue.
Our experiment induced muscle fatigue in TA and TS effectively. Median frequencies of EMG signals collected from fatigued TA and TS muscles during fatigue protocol decreased over time, indicating muscle fatigue. This decrease agrees with the shift of median frequency under muscle fatigue calculated in EMG recordings [16]. However, subjects reported difficulties on maintaining high muscle activation levels (50 % of TA and TS MVC) for two minutes.
As Table 1 shows, the study illustrated the consistency of muscle activation for both targeted muscles and all monitored muscles during ankle mechanical impedance measurement before and after the muscle fatigue protocol. Since activation of a single muscle normally involves activation of related muscles due to muscle synergy [18], estimation of total muscle activity is required to investigate the effect of muscle fatigue on the corresponding ankle mechanical impedance. Even when the target muscle activation levels are comparable across measurements, if the total muscle activations are significantly different, we may not conclude that impedance changes are due to muscle fatigue. The consistency of muscle activation levels before and after muscle fatigue eliminates the possibility that the observed impedance reduction was caused by changing muscle activation levels [6]. Indeed, this consistency confirms that muscle fatigue contributed to the decreases of ankle mechanical impedance.
Under TA muscle fatigue, ankle impedance decreased in all principal directions, DP and IE. In contrast, under TS muscle fatigue, ankle impedance decreased in all principal directions only for Subject 1 who targeted on activating SOL, but not for Subject 2 who targeted on activating GA (Table II). Nonetheless, the results were based on only two subjects; further investigation and more subjects are needed.
Fifteen minutes of rest was given to subjects to study the effects of the muscle fatigue recovery on ankle mechanical impedance; however, the impedance was lower under fatigued muscles than it was under pre-fatigued muscles. Ratios of post-fatigue measurements 2 (Post 2) and post-fatigue measurements 1 (Post 1) were not significantly different from 1 (p < 0.05), suggesting that muscles did not recover after fifteen minutes of rest (Table 2). A longer period may be needed for the muscle to recover from fatigue. For future studies, we are planning to explore the ankle mechanical impedance under muscle fatigue with various muscle recovery times.
This study showed ankle impedance decreases in both DP and IE directions under TA muscle fatigue. Decrease of ankle
mechanical impedance may increase the probability of ankle injuries. Therefore, this finding may help to develop joint support systems to prevent ankle injuries caused by muscle fatigue.
ACKNOWLEDGEMENTS
This work was supported in part by DARPA’s Warrior Web program, BAA-11-72. H. Lee was supported by the Samsung Scholarship. Dr. N.Hogan is a co-inventor of the MIT patents for the robotic devices used in this study. He holds equity positions in Interactive Motion Technologies, Inc., the company that manufactures this type of technology under license to MIT. We would like to thank Mr. Daniel E Klenk for his generous help.
REFERENCES
[1] Enoka, R. M., & Duchateau, J. (2008). Muscle fatigue: what, why and how it influences muscle function.
Journal of physiology, 586(1), 11-23.
[2] Lee, H., Krebs, H. I., & Hogan, N. (2012). A novel characterization method to study multivariable joint mechanical impedance. In Proc. 4th IEEE RAS & EMBS
International Conference on Biomedical Robotics and Biomechatronics (BioRob 2012), 1524-1529
[3] Lee, H., Ho, P., Rastgaar, M. A., Krebs, H. I., & Hogan, N. (2011). Multivariable static ankle mechanical impedance with relaxed muscles. Journal of biomechanics,
44(10), 1901-1908.
[4] Lee, H., Ho, P., Rastgaar, M., Krebs, H. I., & Hogan, N. (2010). Quantitative characterization of steady-state ankle impedance with muscle activation. In Proceedings ASME
Dynamic Systems and Control Conference.
[5] Lee, H., Ho, P., Rastgaar, M. A., Krebs, H. I., & Hogan, N. Multivariable static ankle mechanical impedance with active muscles. IEEE Transaction on Neural Systems and Rehabilitation Engineering, accepted (DOI 10.1109/TNSRE.2013.2262689)
[6] Lee, H., Wang, S., & Hogan, N. (2012, August). Relationship between ankle stiffness structure and muscle activation. In Proc. IEEE International Conference on
Engineering in Medicine and Biology Society (EMBC 2012), 4879-4882.
[7] Merletti, R., Knaflitz, M., & De Luca, C. J. (1990). Myoelectric manifestations of fatigue in voluntary and electrically elicited contractions. Journal of Applied
Physiology, 69(5), 1810-1820.
[8] Arendt-Nielsen, L., & Mills, K. R. (1985). The relationship between mean power frequency of the EMG spectrum and muscle fibre conduction velocity.
Electroencephalography and clinical Neurophysiology, 60(2), 130-134.
[9] Bigland-Ritchie, B., E. F. Donovan, and C. S. Roussos. (1981) Conduction velocity and EMG power spectrum changes in fatigue of sustained maximal efforts. Journal
of Applied Physiology 51(5), 1300-1305.
[10] Merletti, R. and Parker, P. J., Electromyography: Physiology, Engineering, and Non-Invasive Applications, 1st edition, Wiley, 2005.
[11] Clancy, E. A., Farina, D., & Merletti, R. (2005). Cross-comparison of time-and frequency-domain methods for monitoring the myoelectric signal during a cyclic, force-varying, fatiguing hand-grip task. Journal of
Electromyography and kinesiology, 15(3), 256-265.
[12] Masuda, K., Masuda, T., Sadoyama, T., Inaki, M., & Katsuta, S. (1999). Changes in surface EMG parameters during static and dynamic fatiguing contractions.
Journal of Electromyography and Kinesiology, 9(1),
39-46.
[13] Clancy, E.A., Hogan, N., "Relating agonist-antagonist electromyograms to joint torque during isometric, quasi-isotonic, nonfatiguing contractions," Biomedical Engineering, IEEE Transactions on , vol.44, no.10,
pp.1024,1028, Oct. 1997.
[14] Roy, A., Krebs, H. I., Williams, D. J., Bever, C. T., Forrester, L. W., Macko, R. M., & Hogan, N. (2009). Robot-aided neurorehabilitation: a novel robot for ankle rehabilitation. IEEE Trans. on Robotics, 25(3), 569-582.
[15] Hislop, H. J., Montgomery, J., & Connolly, B. H. (1995). Daniels and Worthingham's muscle testing:
techniques of manual examination (pp. 207-208).
Philadelphia, PA: WB Saunders.
[16] Merletti, R., Balestra, G., & Knaflitz, M. (1989). Effect of FFT based algorithms on estimation of myoelectric signal spectral parameters. In Proc. IEEE Egineering in
Medicine and Biology Society, 1022-1023.
[17] J.Bendat and A.Piersol, Random Data: Analysis and Measurement Process, 4th edition, Wiley, 2010
[18] A. d'Avella, and E. Bizzi, “Shared and specific muscle synergies in natural motor behaviors,” Proceedings of the National Academy of Sciences of the United States of America, vol. 102, no. 8, pp. 3076-3081, Feb 22, 2005.