Economic Behavior from an Evolutionary
Perspective
by
Ruixun Zhang
Bachelor of Science, Peking University (2011)
ARCH VES
MASSACHUSETTS INSTITUTEOF TECHNOLOGY
DEC 2 4 2015
LIBRARIES
Submitted to the Department of Mathematics
in partial fulfillment of the requirements for the degree of
Doctor of Philosophy
at the
MASSACHUSETTS INSTITUTE OF TECHNOLOGY
September 2015
@
Massachusetts Institute of Technology 2015. All rights reserved.
Author...Signature
redacted
Department of Mathematics
Certified by...
August
8, 2015
Signature redacted
Andrew W. Lo
Charles E. and Susan T. Harris Professor of Finance
Thesis Supervisor
Accepted by...
Signature redacted
/Michel Goemans
Leighton Family Professor of Mathematics
Chairman, Department Committee on Graduate Theses
Economic Behavior from an Evolutionary Perspective
by
Ruixun Zhang
Submitted to the Department of Mathematics on August 8, 2015, in partial fulfillment of the
requirements for the degree of Doctor of Philosophy
Abstract
The conflict between rational models of economic behavior and their systematic de-viations, often referred to as behavioral economics, is one of the most hotly debated issues in social sciences. This thesis reconciles the two opposing perspectives by ap-plying evolutionary principles to economic behavior and deriving implications that cut across species, physiology, and genetic origins.
In the context of a binary-choice model, we first show that risk aversion emerges via natural selection if reproductive risk is "systematic", i.e., correlated across individ-uals in a given generation. The degree of risk aversion is determined by the stochastic nature of reproductive rates, and different statistical properties lead to different util-ity functions. More generally, irrational behaviors are not just mere divergence from rationality, but seeds necessary for successfully coping with environmental transfor-mations. Furthermore, there is an optimal degree of irrationality in the population depending on the degree of environmental stochasticity.
When applied to evolutionary biology, we show that what appears to be group selection may, in fact, simply be the consequence of natural selection occurring in stochastic environments with "systematic" risks. Those individuals with highly corre-lated risks will appear to form "groups", even if their actions are totally autonomous, mindless, and, prior to selection, uniformly randomly distributed in the population.
Evolutionary principles can also be used to model the dynamics of financial mar-kets. In a multiperiod model of the contagion of investment ideas, we show that heterogeneous investment styles can coexist in the long run, implying a wider varia-tion of diverse strategies compared to tradivaria-tional theories. These results may provide new insights to the survival of a wide range of hedge funds. In a model that investors maximize their relative wealth, the initial wealth plays a critical role in determining how the optimal behavior deviates from the Kelly Criterion, regardless of whether the investor is myopic or maximizing the infinite-horizon wealth.
Thesis Supervisor: Andrew W. Lo
Acknowledgments
Graduate school is not an easy process. I have learned tremendously during my four years at MIT.
First and foremost, I am fortunate to have studied with my advisor, Andrew Lo. He has been a tremendous mentor and perfect role model for me. Working with him has been an inspiring experience. I am greatful for his continuous support, encouragement, and patience in me throughout my PhD study. His advice on both research as well as on my career have been priceless.
This thesis would not have been possible without the many insights that I learned from my collaborators: Professor Tom Brennan from the Northwestern University, Professor David Hirshleifer from the University of California at Irvine, and Professor Allen Orr from the University of Rochester. It was a pleasure to work with them.
I would like to thank professors on my thesis committee and qualification
com-mittee: Michel Goemans, Peter Kempthorne, and Lie Wang, who have always been generous with their time and expertise. I have also benefited from interactions with other faculty from whom I have taken classes. In particular, I thank Richard Dudley, Jun Liu, and Jake Xia for their support on both my research and career.
I am very grateful to my classmates and officemates at MIT. Being part of such
a high quality group of peers motivated me to keep moving forward. In particular,
I learned a lot from discussions with Xuwen Zhu, Wenzhe Wei, Yi Zeng, Xin Sun,
Teng Fei, Guozhen Wang, Yufei Zhao, Chenjie Fan, Ben Yang, Qiang Guang, Hong Wang, and Haihao Lu from the Math Department, Vahid Montazerhodjat, William Li, Shomesh Chaudhuri, Pablo Azar, and Valentine de Weck from the Laboratory for Financial Engineering.
I appreciate the wonderful support from the people at MIT, including Barbara
Peskin and Michele Gallarelli from the Math Department, Jayna Cummings, Patsy Thompson, Allie McDonough, and Neil Zimmerman from the Sloan School of Man-agement, and Jennifer Walker from the Behavioral Research Lab.
I thank my friends for listening, offering me advice, and supporting me through
this entire process. My roommates, Yichen Shen, Chia Wei Hsu, and Xuan Wei, made our house such an enjoyable place. Zhan Su and many other friends on the division-2 basketball list were always ready to have fun together. My life as a graduate student would not have been so colorful without you.
I gratefully acknowledge the funding sources that supported my PhD study. This includes the Akamai Presidential Fellowship in the first year, MIT Mathematics De-partment and MIT Laboratory for Financial Engineering in the subsequent years.
Last but not least, I would like to thank my parents for their endless love, support and encouragement. They have made tremendous sacrifices to ensure that I had an excellent education. I would never have enough motivation throughout the years without their unfailing faith in me. For this and much more, I am forever in their debt. It is to them that I dedicate this thesis.
Contents
1 Introduction
1.1 Background . . . .
1.2 Overview of the Thesis . . . .
2 The Origin of Risk Aversion
2.1 Introduction ...
2.2 The Binary Choice Model . . . . .
2.3 Individual Preferences . . . .
2.4 Risk Aversion and Systematic Risk
2.5 Testable Implications . . . .
2.6 Additional Results and Examples .
2.7 Discussion . . . .
3 Variety Is the Spice of Life: Irrational Behavior as Adaptation to
Stochastic Environments
3.1 Introduction . . . .
3.2 Binary Choice Model with Mutation . . . .
3.2.1 Mutation: a link between optimal and sub-optimal behavior .
3.2.2 Asymptotic population dynamics . . . .
3.2.3 Extinction probability . . . .
3.3 Results: Optimal Degree of Irrationality . . . .
3.3.1 Regime-switching environments . . . ... . . . .
3.3.2 An example of two behaviors . . . .
15 15 18 21 . . . . 21 . . . . 24 . . . . 28 . . . . 29 . . . . 31 . . . . 34 . . . . 38 43 43 47 49 52 54 56 58 58
3.3.3 Generalization and simulation experiments . . . .
3.3.4 Optimal degree of irrationality . . . .
3.4 Additional Results and Technical Details . . . .
3.4.1 Birkhoff's contraction coefficient . . . .
3.4.2 Additional results for population dynamics . . . .
3.4.3 Simulation for the limit distribution of population proportions
3.5 D iscussion . . . .
4 Group Selection as Behavioral Adaptation to Systematic Risk
4.1 Introduction . . . .
4.1.1 Literature review . . . .
4.2 Binary Choice Model with Systematic Risk . . . .
4.3 Individually Optimal versus Group Optimal Behavior . . . .
4.4 A Numerical Example . . . .
4.5 The General Model: Multinomial Choice with Multiple Factors . . . .
4.6 D iscussion . . . .
5 Contagion and the Evolutionary Survival of Diverse Investment
Strategies
5.1 Introduction . . . .
5.2 Binary Choice Model . . . .
5.2.1 Population Dynamics . . . .
5.2.2 Strategy Returns . . . .
5.3 Optimal Investment Strategies . . . .
5.3.1 Single Dominant Strategy . . . .
5.3.2 The Evolution of Diversity . . . .
5.3.3 A Special Case . . . .
5.4 Evolutionary Survival of Diversity in Market
5.4.1 Equilibrium Behavior . . . . 5.4.2 A Simulation Example . . . . 5.5 Discussion . . . . Equilibrium 60 65 66 66 67 69 71 75 78 81 85 87 90 94 97 . . . . 97 . . . . 101 . . . . 102 . . . . 104 . . . . 105 . . . . 105 . . . . 109 . . . . 112 . . . . 113 . . . . 115 . . . . 117 . . . . 118
6 Growth of Relative Wealth and Kelly Criterion 121
6.1 Introduction . . . .. . . . . 121
6.2 Maximizing Absolute Wealth: the Kelly Criterion . . . . 123
6.3 Maximizing Relative Wealth . . . . 125
6.3.1 One-period results . . . . 126 6.3.2 Multi-period results . . . . 128 6.3.3 Infinite horizon . . . . 130 6.4 A Numerical Example . . . . 131 6.5 D iscussion . . . . 133 A Proofs 137 A.1 Proofs for Chapter 2 . . . . 137
A.2 Proofs for Chapter 3 . . . . 138
A.3 Proofs for Chapter 4 . . . . 145
A.4 Proofs for Chapter 5 . . . . 148
List of Figures
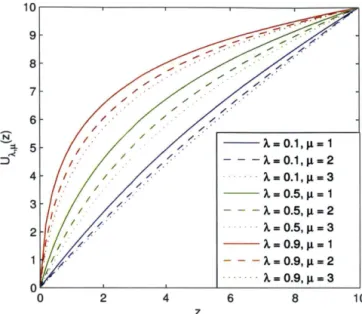
2-1 Utility functions implied by environments with different portion of
sys-tematic risk and different level of idiosyncratic risk. A = 0.1 represents
a low level of systematic risk; A = 0.9 represents a high level of
sys-tematic risk. p = 1 represents a low level of idiosyncratic risk; P = 3 represents a high level of idiosyncratic risk. All nine utility functions
are normalized by setting U\,,(0) = 0 and UA,,(10) = 10. . . . . 30
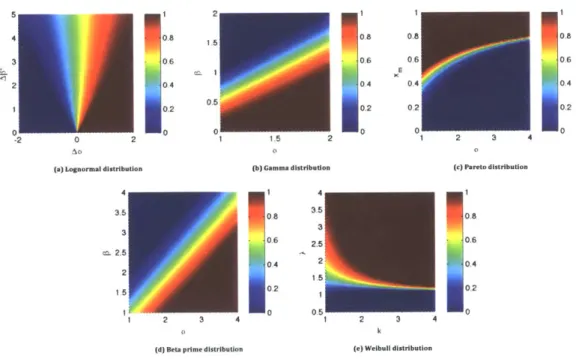
2-2 Optimal behavior
f*
for several distributions of relative fecundity R =w1/wA. In each subfigure, different color corresponds to deterministic
(f* 0 or 1) or randomizing (0 <
f*
< 1) behavior given particularparameters of the distribution. . . . . 35
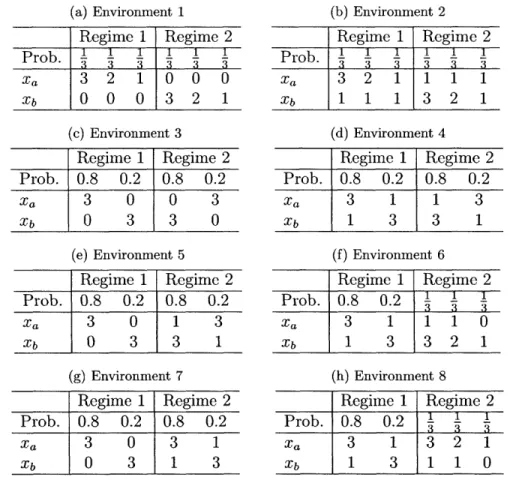
3-1 Optimal degree of mutation and optimal log-geometric-average growth
rate as a function of regime lengths E[T1] and E[T2]. Eight subfigures
show simulation results of eight different environments in Table 3.1. The colored plain with the colorbar shows the optimal mutation rates; the transparent surface of which the height is indicated by the z-axis shows the optimal log-geometric-average growth rate associated with
3-2 Simulation for the limit distribution of population proportions. (3-2a):
simulation of one evolution path without mutation. (3-2b): simulation
of one evolution path with mutation c = 0.01. (3-2c): simulation
of one evolution path with mutation E = 0.05. (3-2d): simulation
of limit distribution of 1000 evolution paths with mutation E = 0.01;
only
f
= 0.6,0.8, 1 are shown. (3-2e): simulation of limit distributionof 1000 evolution paths with mutation e = 0.05; only f = 0.6, 0.8, 1
are shown. 3-2f): sample paths averaged over 1000 simulation with mutation c = 0.01. 3-2g): sample paths averaged over 1000 simulation
with mutation E = 0.05 . . . . . 70
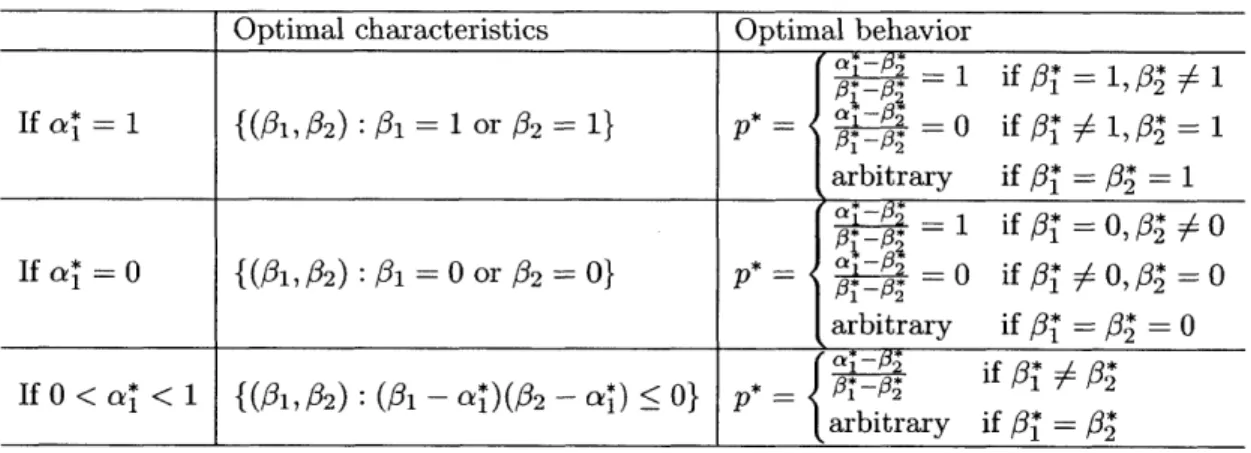
4-1 The optimal behavior for each group in the numerical example of group selection. The optimal groups described by Equation (4.7) correspond to the upper-left and lower-right blocks. Randomized behaviors are
optimal for these groups. . . . . 89
4-2 The optimal log-geometric-average growth rate for each group in the
numerical example of group selection. All groups described by
Equa-tion (4.7) have the largest growth rate. . . . . 89
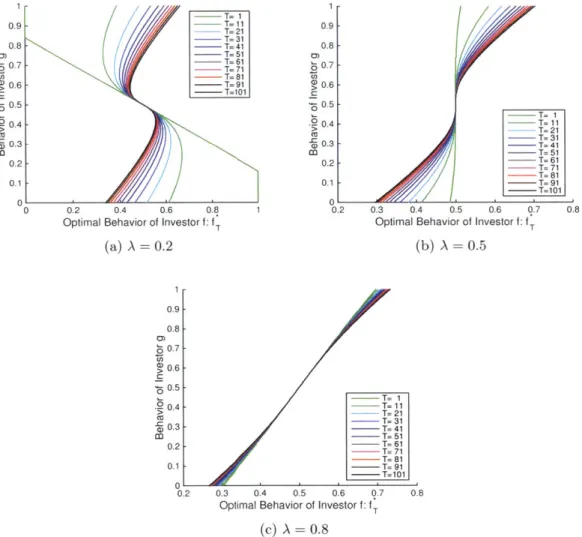
5-1 Evolution of the optimal behavior
f*
with exogenous returns (5-1a)and the equilibrium behavior f' with endogenous returns (5-1b) over
500 generations. The vertical axis represents the frequency of each
type of investor in the population, and the horizontal axis represents
time. Different colors correspond to different behaviors. . . . . 118
6-1 Optimal behavior of investor
f
as a function of g:f*.
(6-1a):f*
forseveral different cases of investor f's initial relative wealth A. (6-1b):
comparison between
f*
and fKelly when A = 0.49 with the f-axis from0.495 to 0.505. . . . . 132
6-2 Evolution of the optimal behavior of investor
f: f.,
T = 1, 11, - - , 101.List of Tables
3.1 Probability table for the simulation of optimal mutation rates:
envi-ronm ent 1-8 . . . . 62
3.2 Probability table for the simulation of asymptotic population dynamics 69
4.1 Optimal type
f*
= (p* 0*, 0) for the binary choice model withdiffer-ent factor loadings a* . ... 84
Chapter 1
Introduction
1.1
Background
Rationality is the key assumption behind standard economic models of human be-havior. The idea that individuals maximize their own self-interest subject to re-source constraints has led to numerous breakthroughs, including the expected util-ity theory (von Neumann and Morgenstern 1944), game theory (von Neumann and Morgenstern 1944, Nash 1950), rational expectations (Lucas Jr 1972), and the option pricing theory (Black and Scholes 1973, Merton 1973). The influence of this paradigm goes far beyond academia-it underlies current macroeconomic and monetary poli-cies, and has also become an integral part of the rules and regulations that govern financial markets today (Kocherlakota 2010, Hu 2012).
Two of the theories that are particularly relavant for this thesis are the modern portfolio theory (Markowitz 1952) and the Efficient Markets Hypothesis (Samuelson
1965, Fama 1970). Ever since Markowitz's groundbreaking work, the mean variance
approach has remained the cornerstone of modern portfolio theory, which has led to the famous Capital Asset Pricing Model (Sharpe 1964, Treynor 1965, Lintner 1965b, Lintner 1965a, Mossin 1966). As one of the most influential ideas in all the social sciences, the Efficient Markets Hypothesis argues that market prices "fully reflect all available information"; agents with incorrect beliefs will be driven out of the market
result in behavior consistent with maximization (Alchian 1950, Friedman 1953). However, accumulating evidence from pychology, cognitive science, behavioral economics and finance has documented significant inconsistencies to the rational-ity assumption. These systematic deviations from rational behaviors are hard to reconcile with the standard economic models, and are therefore considered "irra-tional". Representatives of these cognitive biases include probability matching (Grant et al. 1951, Herrnstein 1961) (the tendency to choose randomly between heads and tails when asked to guess the outcomes of a series of independent biased-coin tosses, where the randomization matches the probability of the biased coin), loss aversion (Tversky and Kahneman 1974, Tom et al. 2007) (the tendency to take greater risk when choosing between two potential losses, and less risk when choosing between two potential gains), uncertainty effect (Gneezy et al. 2006) (a risky prospect is val-ued less than its worst possible outcome), and confirmation bias (Mahoney 1977) (the tendency to search for or interpret information in a way that confirms one's preconceptions). Such anomalous behaviors have also been observed in many non-human subjects ranging from bacteria to primates (Harder and Real 1987, Pasteels
et al. 1987, Kirman 1993, Smallwood 1996, Chen et al. 2006, Ben-Jacob 2008, Santos
and Chen 2009), which suggests that they may have a common and ancient origin, and an evolutionary role that belies their apparent shortcomings.
The debate between rational models of behavior and their systematic devia-tions has attracted an enormous amount of attention in both theoretical (Becker
1962, Stanovich and West 2000, Rabin and Thaler 2001, McKenzie 2003, Burnham
2013, Gneezy and List 2013) and empirical research (Hsu et al. 2005, Camerer and
Fehr 2006, Gneezy and List 2006, Apicella et al. 2008, Dreber et al. 2009, Chen and
Chen 2011, Bednar et al. 2012, Fershtman et al. 2012, Gneezy and Imas 2014). It is interesting that neoclassical economists dismiss the behavioral anomalies as inter-esting quirks or laboratory artifacts, while behavioral economists, in turn, dismiss neoclassical economics as irrelevant, applied math (Burnham 2013).
This thesis applies evolutionary principles to human economic behavior and rec-onciles the two opposing perspectives. The idea of natural selection in economics can
be traced back to 1950s (Alchian 1950, Penrose 1952, Friedman 1953). Since then the
Darwinian selection perspective has been applied to a variety of economic behaviors and concepts including altruism (Alexander 1974, Becker 1976, Hirshleifer 1977, Al-menberg and Dreber 2013), evolutionary game theory (Maynard Smith 1982), the rate of time preference (Rogers 1994, Robson and Samuelson 2009), and utility
func-tions (Campbell 1986, Robson 1996a, Robson 1996b, Dekel and Scotchmer 1999,
Samuelson 2001). In particular, irrational behavior-as opposed to utility-maximizing behavior-has been found useful and persistent in a variety of environments in
evolu-tion (Belavkin 2006, Houston et al. 2007, Waksberg et al. 2009, Ross and Wilke 2011,
Okasha and Binmore 2012). However, it is still unclear how these behaviors relate to standard economic theories of individual rationality, and why they emerge in some instances and not others.
In the context of financial markets, evolutionary models have also been pro-posed to understand market selection (Blume and Easley 1992, Luo 1995, Kogan et al. 2006a, Hirshleifer and Teoh 2009) and the geometric mean principle or "Kelly cri-terion" (Kelly Jr. 1956). In recent years, the Adaptive Markets Hypothesis (Lo 2004) provides an evolutionary perspective and reconciles economic theories based on the Efficient Markets Hypothesis with behavioral economics: the neoclassical models of rational behavior can coexist with behavioral models, and what was cited as coun-terexamples to rationality-loss aversion, overconfidence, overreaction, and other be-havioral biases-are, in fact, consistent with an evolutionary model of human behav-ior.
More recently, Brennan and Lo (2011) have proposed a binary choice model that provides an evolutionary framework for generating a variety of behaviors that are considered "anomalous" from the perspective of traditional economic models, i.e., loss aversion, probability matching, and bounded rationality. In this framework, natural selection yields standard risk-neutral optimizing economic behavior when reproduc-tive risk is idiosyncratic, i.e., uncorrelated across individuals within a given gener-ation. But when reproductive risk is systematic, i.e., correlated among individuals within a given generation, some seemingly irrational behaviors such as probability
matching and loss aversion become evolutionarily dominant.
This thesis extends the binary choice model in various aspects. Next section summarizes the main results, and more specific backgrounds are given in the beginning of each chapter.
1.2
Overview of the Thesis
The main results in this thesis are divided into five chapters. Each chapter is self-contained and, therefore, can be read in isolation.
Chapter 2 studies the origin of risk aversion. Risk aversion is one of the most basic assumptions of economic behavior, but few studies have addressed the question of where risk preferences come from and why they differ from one individual to the next. Here we propose an evolutionary explanation for the origin of risk aversion. In the context of a simple binary-choice model, we show that risk aversion emerges via natural selection if reproductive risk is "systematic", i.e., correlated across individu-als in a given generation. In contrast, risk neutrality emerges if reproductive risk is "idiosyncratic", i.e., uncorrelated across each given generation. More generally, our framework implies that the degree of risk aversion is determined by the stochastic nature of reproductive rates, and we show that different statistical properties lead to different utility functions. The simplicity and generality of our model suggest that these implications are primitive and cut across species, physiology, and genetic ori-gins. From a policy perspective, our results underscore the importance of addressing systematic risk through insurance markets, capital markets, and government policy. However, our results also highlight the potential dangers of sustained government intervention, which can become a source of systematic risk in its own right.
Chapter 3 shows that irrational behaviors are evolutionary adaptations to stochas-tic environments. The debate between rational models of behavior and their system-atic deviations, often referred to as "irrational behavior", has attracted an enormous amount of research. Here we reconcile the debate by proposing an evolutionary ex-planation for irrational behavior. In the context of a simple binary choice model, we
show that irrational behaviors are necessary for evolution in stochastic environments. Furthermore, there is an optimal degree of irrationality in the population depending on the degree of environmental stochasticity. In this process, mutation provides the important link between rational and irrational behaviors, and hence the variety in evolution. Simulation confirms the generality of these implications in a wide range of stochastic environments. Our results yield widespread implications for science, management, and public policy.
Chapter 4 applies the binary choice model to group selection, one of the most important concept in evolutionary biology. Despite many compelling applications in economics, sociobiology, and evolutionary psychology, group selection is still one of the most hotly contested ideas in evolutionary biology. Here we propose a simple evolutionary model of behavior and show that what appears to be group selection may, in fact, simply be the consequence of natural selection occurring in stochastic environments with reproductive risks that are correlated across individuals. Those individuals with highly correlated risks will appear to form "groups", even if their actions are, in fact, totally autonomous, mindless, and, prior to selection, uniformly
randomly distributed in the population. This framework implies that a separate
theory of group selection is not strictly necessary to explain observed phenomena such as altruism and cooperation. At the same time, it shows that the notion of group selection does captures a unique aspect of evolution-selection with correlated reproductive risk-that may be sufficiently widespread to warrant a separate term for the phenomenon.
Chapter 5 turns to the application of the binary choice model in financial context. This chapter studies the contagion of investment ideas in a multiperiod model where each investor has a propensity to invest in one of the two strategies with general distri-butions of returns. Investors with higher realized payoffs are more likely to transmit their ideas to other investors from social interaction and, therefore, generate more "offspring". We show that when returns are endogenous, heterogeneous investment styles can coexist in the long run, implying a wider variation of diverse strategies compared to traditional theories. In addition, our model gives a characterization of
which strategies survive in relation to security return characteristics. These results may provide new insights to the survival of investment strategies and, more broadly, the survival of a wide range of hedge funds.
Chapter 6 adds to the literature of the optimal portfolio growth theory. We pro-pose an evolutionary framework for portfolio growth where investors allocate their wealth between two assets. By considering criteria with both absolute wealth and relative wealth, we show that different investor behaviors survive under different en-vironments. In the case that investors maximize their relative wealth, conditions under which the Kelly Criterion is optimal are identified. It is shown that the initial relative wealth plays a critical role in determining how the optimal behavior deviates from the Kelly Criterion, regardless of whether the investor is myopic or maximizing the infinite-horizon wealth.
Chapter 2-4 are joint work with Andrew W. Lo and Thomas J. Brennan, and are
derived from Zhang et al. (2014b), Zhang et al. (2015), and Zhang et al. (2014a).
Chapter 5 is joint work with Andrew W. Lo and David Hirshleifer. Chapter 6 is joint work with Andrew W. Lo and H. Allen Orr. Proofs of the main results for all chapters are given in Appendix A.
Chapter 2
The Origin of Risk Aversion
2.1
Introduction
Risk aversion is one of the most fundamental properties of human behavior. Ever since Bernoulli's pioneering work in gambling and the St. Petersburg Paradox in the 17th century (Bernoulli 1954), considerable research has been devoted to understand-ing human decision makunderstand-ing under uncertainty. Two of the most well-known theories are expected utility theory (von Neumann and Morgenstern 1944) (an axiomatic for-mulation of rational behavior under uncertainty) and prospect theory (Kahneman and Tversky 1979) (a behavioral theory of decision making under uncertainty). Sev-eral measures of risk aversion have been developed, including curvature measures of utility functions (Arrow 1971, Pratt 1964), human-subject experiments and surveys
(Rabin and Thaler 2001, Holt and Laury 2002), portfolio choice for financial investors (Guiso and Paiella 2008), labor-supply behavior (Chetty 2006), deductible choices in insurance contracts (Szpiro 1986, Cohen and Einav 2007), contestant behavior on game shows (Post et al. 2008), option prices (Aft-Sahalia and Lo 2000), and auction
behavior (Lu and Perrigne 2008).
Despite its importance and myriad applications in the past several decades, few economists have addressed the question: where does risk aversion come from? Biolo-gists and ecoloBiolo-gists have documented risk aversion in non-human animal
(Harder and Real 1987, Pasteels et al. 1987, Kirman 1993, Smallwood 1996,
Ben-Jacob 2008). Recently, the neural basis of risk aversion has also received much at-tention as researchers discovered that the activity of a specific brain region correlates with risk-taking and risk-averse behavior (Knoch et al. 2006, Fecteau et al. 2007, Tom
et al. 2007).
Evolutionary principles have been applied by economists to a variety of eco-nomic behaviors and concepts including altruism (Becker 1976, Hirshleifer 1977), the rate of time preference (Robson and Samuelson 2009), and utility functions (Robson 1996a, Robson 1996b, Dekel and Scotchmer 1999, Samuelson 2001, Robatto and Szentes 2013). In particular, Robson (1996a) proposes an evolutionary model of risk preferences in which he assumes an increasing concave relation between an indi-vidual's number of offspring and the amount of resources available to that individual, and given this concave "biological production function", he shows that expected utility arises from idiosyncratic environmental risk and non-expected utility arises from sys-tematic risk. In the context of financial markets, evolutionary models have also been proposed to capture market selection (Blume and Easley 1992) and the geometric mean principle or "Kelly criterion" (Kelly Jr. 1956). And as an alternative to the tra-ditional view that markets are always and everywhere efficient and that "prices fully reflect all possible information" (Samuelson 1965, Fama 1970), the Adaptive Markets
Hypothesis (Lo 2004) provides an evolutionary perspective of financial markets. More recently, Brennan and Lo (2011) have proposed a binary choice model that provides an evolutionary framework for generating a variety of behaviors that are considered "anomalous" from the perspective of traditional economic models, i.e., loss aversion, probability matching, and bounded rationality. In this framework, natural selection yields standard risk-neutral optimizing economic behavior when reproduc-tive risk is idiosyncratic, i.e., uncorrelated across individuals within a given gener-ation. But when reproductive risk is systematic, i.e., correlated among individuals within a given generation, some seemingly irrational behaviors such as probability matching and loss aversion become evolutionarily dominant.
focus on the origin of utility and risk aversion. We show that risk aversion emerges as a consequence of systematic risk and risk neutrality emerges as a consequence of idiosyncratic risk, regardless of the species and without the need for any biological production function, concave or otherwise. This result suggests that the degree and type of risk aversion are determined by the stochastic nature of reproductive risk, and we show how different environments lead to different stable utility functions over time. This approach provides an alternate and more fundamental explanation of risk aversion, and the fact that our results do not depend on any exogenously specified production function suggests that risk aversion is a much more primitive feature of all organisms. Moreover, the simplicity of our framework and the direct relation between reproductive success and risk aversion provides an equally simple explanation for the large amount of heterogeneity in risk aversion observed in empirical studies
(Holt and Laury 2002, Guiso and Paiella 2008, Chetty 2006, Szpiro 1986, Cohen and
Einav 2007): variation in the amount of systematic risk in reproductive success. When applied to economic contexts, our results imply a link between the expected returns of risky assets such as equities and systematic reproductive risk which, in turn, is correlated with aggregate financial risk. This relation is consistent with the well-known equilibrium risk/reward trade-off first proposed by Sharpe (1964). However, our theoretical derivation of this relation does not depend on preferences or general equilibrium, but is solely a consequence of natural selection under systematic reproductive risk.
Our model consists of an initial population of individuals, each assigned a purely arbitrary behavior with respect to a binary choice problem and where it is assumed that offspring behave in an identical manner to their parents. Therefore, those be-haviors leading to greater reproductive success will lead to higher growth rates and become more representative in the general population. Environments with different types of reproductive risks will lead to different optimal behaviors and in the limit, only certain types of behaviors-corresponding to specific types of preferences or "utility functions"-will survive in such environments.
to derive evolutionary implications that cut across species, physiology, and genetic origins. In the same way that different magnifications of a microscope reveal differ-ent details of a specimen, applying evolutionary principles to behavioral variations leads to different insights that may be more relevant for economics, psychology, and behavioral ecology. Our focus on behavior as the object of selection is a different lens through which the effects of evolution may be studied.
2.2
The Binary Choice Model
Consider a population of individuals that live for one period, produce a random number of offspring asexually, and then die. During its life (we use the pronoun "it" since the individual need not be human), individual i makes only one decision: choose one of two possible actions a and b, which results in one of two corresponding
random numbers of offspring, Xa,i and Xb,i. These two random variables summarize
the impact of the environment on the reproductive success of the individual, and they are assumed to be the weighted sum of two components:
Xa,i Aza + (1 A)ya,i (2.1)
Xb,i = Azb + (1 - A)Yb,i.
The first component of the weighted sum, (Za, zb), is assumed to be independently
and identically distributed (ID) over time and identical for all individuals in a given generation, hence we refer to it as "systematic" risk since one individual experiences the same reproductive outcome as others that choose the same action. The second component, (ya,i, ybi), is assumed to be IID both over time and across individuals i in a given generation, hence we refer to it as "idiosyncratic". Both components are described by some well-behaved probability distributions (Assumption 1), and A is a real number between 0 and 1.
Assumption 1. (Za, Zb), (ya,i, ybi), log(fza + (1 - f)zb), and log(fya,i + (1 - f)Yb,i)
Each individual chooses a with some probability
f
E [0, 1] and b with probability 1-f. We shall henceforth refer tof
as the individual's behavior since it completelyde-termines how the individual chooses between a and b. Note that
f
can be 0 or 1, hencewe are not requiring individuals to randomize-this will be derived as a consequence
of natural selection under certain conditions. Denote by
4f
the random number ofoffspring produced by individual i of type
f,
then x1 = Ifta_.+
(i -If)
Xb,, whereIf
is the Bernoulli random variable that equals 1 with probabilityf
and 0 otherwise.Furthermore, offspring behave in a manner identical to their parents, i.e., they
choose between a and b according to the same
f,
hence the population may be viewedas being segmented into groups of distinct types
f.
This assumption is tantamountto assuming perfect genetic transmission of traits from one generation to the next, which provides a clearer analysis of the interaction between natural selection and the stochastic properties of reproduction implicit in the environment. However, mutation can easily be incorporated into this framework at the expense of analytical simplicity (see Chapter 3). We also assume that the initial population contains an equal number of all types, and we normalize this common initial population to be 1 for each type without loss of generality.
We wish to emphasize the difference between reproductive success with systematic
risk (Za, Zb) and idiosyncratic risk (ya,i, Yb,i), which points to the central role that
systematic risk plays in shaping the evolution of behavior and preferences. In the case of systematic risk, the number of offspring is given by the same two random variables (za, zb), for all individuals. If two individuals choose the same action a, both will generate the same number of random offspring za, i.e., their reproductive success is perfectly correlated. In this sense, fecundity is systematic. On the other hand, for (ya,i, yb,i), the randomness in the number of offspring is strictly idiosyncratic in the sense that the correlation between the number of offspring for two individuals i and
j
is 0, even if both individuals choose the same course of action. Idiosyncratic fecundity implies that even if all individuals in a given population choose the same action, there will still be considerable cross-sectional variability in the number of offspring produced in any generation.Using (2.1) we can rewrite xf as a combination of systematic and idiosyncratic
risk:
Xf
=Azf + (1 - A)yfwhere
zf IfZa + (1-I)zo
yf = J!'ya,i + (1i -- I!) ybi.
The coefficient A
C
[0, 1] indicates the proportion of systematic risk in the environment.When A =1, all reproductive risk is systematic; when A =0, all reproductive risk is idiosyncratic; and when 0 < A < 1, both types of risk are present. In a particular
environment described by A, denote by nr the total number of offspring of type f in
generation T. It is easy to show that the average of the log-population T-1
log nT converges in probability to the log-geometric-average growth rate:
aA(f) = E, [log (Azf + (1 - A)Ey[yf])] (2.2)
where E2 denotes the expectation taken with respect to zf and EY denotes the expec-tation taken with respect to yf. Equation (2.2) can also be written as
aA(f) = Ez [1og (fWA + (1 - f)wA)] (2.3)
where
{W
:
Aza + (1 - A)EY[ya], AZb + (1 - A)E,[yb].Maximizing (2.3) yields the evolutionarily dominant or "growth-optimal" behavior in environment A (Brennan and Lo 2011):
1 if E2[w/wA] > 1 and Ez[wA/wA] < 1
f*= solution to (2.5) if E2[wA/wA] > 1 and E,[w/wA] > 1 (2.4)
where
f
* is defined implicitly in the second case of (2.4) by:0 = Ez a b(. (2.5)
lfa + (I - f)Wb?_
The three possible behaviors described in (2.4) reflect the relative reproductive success of the two choices. Choosing a deterministically will be optimal if choice a exhibits unambiguously higher expected relative fecundity; choosing b deterministi-cally will be optimal if the opposite is true; and randomizing between a and b will be optimal if neither choice has a clear-cut reproductive advantage. This last outcome is perhaps the most counter-intuitive because it is sub-optimal from an individual's perspective (Brennan and Lo 2011).
When A = 0 (pure idiosyncratic risk), the optimal behavior
f*
can only be 0 or 1, corresponding to purely deterministic choice. In this case, the individually optimal choice--to select the action that yields the highest expected number of offspring-coincides with the evolutionarily dominant strategy (see Section 2.6 for further discussion and examples). However, when A > 0 (a portion of reproductiverisk is systematic), the evolutionarily dominant behavior
f*
can be between 0 and 1, in which case individuals exhibit randomizing behavior. Although mixed strategies are well known in the evolutionary game theory literature (Maynard Smith 1982), those strategies emerge from sophisticated strategic interactions between rational op-timizing players-in our framework, randomization is "mindless" behavior produced solely through natural selection. Section 2.6 provides several examples for common distributions of relative fecundityw/w.
Now imagine a large population with individuals who are exposed to different reproductive risks-some individuals are only exposed to idiosyncratic risk (A = 0),
some individuals are only exposed to systematic risk (A = 1), and some individuals
are exposed to a mix of both. The same parameters apply to their offspring. These different groups of individuals have different behaviors in terms of (2.4), as well as different growth rates.
2.3
Individual Preferences
We assume there exists an objective function V(z, y) that describes an individual's
preference, where z represents systematic risk and y represents idiosyncratic risk, in the sense that (zi, y1) is favored over (z2, y2) if and only if VA (zi, y) > VA(z2, Y2). In
other words, the individual maximizes VA(z, y) to determine its choice over random outcomes.
The objective function Vx(z, y) can take any form. For example, VA(z, y) =
maxz+y E [U(z + y)] corresponds to expected utility that does not distinguish between systematic and idiosyncratic risk. However, some functions will give individuals an evolutionary advantage over others in the population; we derive the evolutionarily dominant function in environments with varying proportions of systematic risk.
When A =1, the individual faces only systematic risk. The evolutionarily dominant
behavior
f*
is given byf*
arg max1 E, [log(z/f)], hence the evolutionarily impliedindividual maximization criterion is:
VA=l(z, y) = Ez [log(z)1.
This is simply expected log-utility of the total number of offspring, which Bernoulli (1954) proposed in 1738 to resolve the St. Petersburg Paradox.
When A=0, the individual faces only idiosyncratic risk. The dominant behavior
f*
in this case is given byf*
= arg maxf log (E. [yf]). Therefore, the evolutionarilyimplied individual maximization criterion is
VA.o(z, y) =
EY [y].
This is expected linear utility of the total number of offspring. In other words, the optimal criterion for an individual is simply the expected value-individuals are risk neutral in this environment.
In the general case in which 0 < A <1, reproductive risk contains both systematic and idiosyncratic components. The implied individual maximization criterion from
the evolutionary perspective is therefore:
VA(z, y) = E, [log (Az + (1
-
A)Ey[y])]
.
(2.6)
This objective function does not conform to the traditional expected utility framework in which the individual's behavior can be represented as the outcome of a constrained optimization of the expected value of a concave function of the total number of off-spring, Az + (1- A)y. The idiosyncratic component gives rise to a linear expectation in y, and the systematic component gives rise to a logarithmic function of z and the expectation in y. Risk aversion emerges as a consequence of systematic risk and risk neutrality emerges as a consequence of idiosyncratic risk, regardless of the species. This is a novel implication of natural selection that has not appeared in prior studies of human or animal risk preferences. We explore this further in the next section.
2.4
Risk Aversion and Systematic Risk
From Equation (2.6) it is clear that the level of risk aversion is determined by natural selection as a function of the level of systematic risk in the environment. Suppose an individual is faced with a random number of offspring Az + (1 - A)y and (1- A)p =
Ey [(1 - A)y] is the expectation of the idiosyncratic component. As a function of z, (2.6) can be written as the expected utility function VA(z, y) = Ez[UA,,(z)] where
U,,,(z) = log (A z + (1 - A)y) . (2.7)
This expression defines a class of utility functions with utility measured as a function of the number of offspring arising from the systematic component. Different amounts of systematic risk in the environment correspond to different evolutionarily dominant utility functions. Figure 2-1 shows nine example utility functions with A = 0.1, 0.5,0.9
and I = 1, 2, 3 respectively. All nine utility functions are normalized by an affine
transformation that sets Ux,,(0) = 0 and UA,,(10) = 10.
9 8 7 6 4 - -A.= 0.1, µ = 1 - - - A. = 0.1, µ = 2 · · · A.= 0.1, µ = 3 - -A.= 0.5, µ = 1 - - - A. = 0.5, µ = 2 · A= 0.5, µ = 3 - - A.= 0.9, µ = 1 - - - A. = 0.9, µ = 2 ····A= 0.9, µ=3 o~~~~~~~~~-'-~~~~~~~ 0 2 4 6 8 z
Figure 2-1: Utility functions implied by environments with different portion of sys-tematic risk and different level of idiosyncratic risk. .A = 0.1 represents a low level of systematic risk; .A= 0.9 represents a high level of systematic risk. µ = 1 represents a low level of idiosyncratic risk; µ
=
3 represents a high level of idiosyncratic risk. All nine utility functions are normalized by setting U>.,µ(O) = 0 and U>.,µ(10) = 10.drives the concavity of utility functions, while variation in the level of idiosyncratic risk
(µ)
also plays a role in determining the level of risk aversion. More specifically,we consider the Arrow-Pratt measure of absolute risk aversion (ARA) of U >.,µ ( ·):
U"
>.,µ(
z
)
1~.;..___--~~~~~
u~,µ(z) z
+
G -
1)
µ'(2
.
8)
and the Arrow-Pratt-De Finetti measure of relative risk aversion (RRA) of U>.,µ(·):
1
R>.,µ(z) = zA>.,µ(z) =
1
+
G
·
_
l)1i
(2.9)
Moreover, both measures of risk aversion are increasing functions of the proportion
A of systematic risk:
AA1,,(z)
<
AA,(z if A,<
A2,RA,,(z) Rx,,(z) if A, < A2
and decreasing functions of the level of idiosyncratic risk p:
A,,, (z)
A,, 2(z) if Pi <_ A2,RA,p (z) RA,,12 (z) if Al < Ap2
In other words, risk aversion arises from natural selection in environments with sys-tematic risk. More generally, the degree of risk aversion is determined by the stochas-tic nature of environment: the more systemastochas-tic risk is in the environment, the more risk averse are the evolutionarily dominant utility functions.
2.5
Testable Implications
Although our theory of the evolutionary origin of risk aversion is a highly simplified mathematical caricature of reality, its implications should be empirically verifiable if the theory has captured the most relevant features of decision making under uncer-tainty, as we claim. While formal tests of these implications are beyond the scope of this study, in this section we describe several methods for conducting such tests so as to illustrate the potential practical relevance of the theory.
Biology and Behavioral Ecology. Because the individuals in our theory are not
as-sumed to be intelligent beings-they need not even possess central nervous systems-the systems-theory's implications should apply to systems-the full cross section of systems-the animal kingdom for which risk-sensitive foraging behavior has been observed (Harder and Real 1987, Pasteels et al. 1987, Kirman 1993, Smallwood 1996, Ben-Jacob 2008). Therefore, one direct test of our theory is to perform controlled experiments on non-human animal species in which the amount of systematic and idiosyncratic reproductive risk is
var-icd and the impact of these variations on behavior is documented and compared to the theory's predictions (2.4).
A particularly promising species with which to conduct such experiments is
bacte-ria, which engage in remarkably varied and sophisticated behaviors (Ben-Jacob et al.
1994, Shapiro and Dworkin 1997, Ben-Jacob et al. 2004, Ben-Jacob 2008, Ingham and
Ben-Jacob 2008, Dunny et al. 2008, Be'er et al. 2009, Sirota-Madi et al. 2010, Kenett et al. 2011). Although an individual bacterium is clearly "mindless", colonies of bac-teria such as Paenibacillus vortex have been observed to engage in seemingly intelli-gent behavior such as competition, collaborative foraging, and cell-to-cell chemotactic and physical communication (Ben-Jacob 2008). Moreover, this setting most closely matches two key assumptions of our theory: asexual reproduction (bacteria reproduce via binary fission and other forms of cellular division), and no environmental resource constraints (unless purposely imposed by the experimenter).
A direct test of our theory may be constructed by focusing on a simple behavior
such as chemotaxis-cell movement in response to gradients in the concentration of a specific chemical agent, usually a food source-and manipulating the environment to generate systematic or idiosyncratic risk. Given the speed with which bacteria repro-duce, the growth-optimal chemotactic behavior should be observable within a short time span. Although such behavior can ultimately be traced to genetic structures (Sirota-Madi et al. 2010), our complementary approach of linking behavior directly to reproductive outcomes may yield additional insights into the common evolutionary origins of risk preferences.
Financial Economics. A less direct test of our theory may be performed by ap-plying statistical inference to retrospective data on human behavior. Although the outcome is likely to be considerably noisier and more difficult to interpret because of the complexity of human cognitive abilities, the simplicity of our evolutionary frame-work suggests that risk aversion is an extremely primitive adaptation possessed by most animal species. Nevertheless, human evolutionary biology is at odds with sev-eral of our theory's assumptions, including asexual semelparous reproduction and no resource constraints. Moreover, current human lifespans make controlled experiments
with humans subjects impractical. However, our theory's growth-optimal behavior may be a reasonable approximation to human decision making over long timespans, in which case a statistical hypothesis test of the theory can be conducted using his-torical data involving financial risk and reward. The challenge is to identify scenarios in which human decision making is driven primarily by this adaptation and no other cognitive mechanisms such as strategic, cooperative, altruistic, or ethical behaviors, and to distinguish between systematic and idiosyncratic reproductive risk in these scenarios.
One possible context is the stock markets of developed economies, which reflect the decisions of many investors facing both systematic and idiosyncratic risk (though we are using these terms in a different sense than Sharpe (1964) who focused on systematic and idiosyncratic financial risk, but it is not hard to see how this type of risk might be related to reproductive risk over long timespans). The impact of economy-wide shocks such as natural disasters, technological hazards, and financial crises can proxy for systematic risk (World Bank 2013), and low-frequency high-impact events have been used in the financial economics literature to explain a variety of asset-pricing anomalies including high equity risk premia, low risk-free rates, and excess volatility in stock returns (Barro 2006, Barro 2009), all of which yield a high level of implied risk aversion in expected-utility rational expectations equilibrium models. On the other hand, an example of idiosyncratic reproductive risk is infant mortality due to accidental suffocation (Shapiro-Mendoza et al. 2009), preterm birth (Kramer et al. 2000, MacDorman and Mathews 2008), and congenital malformations (Rosano et al. 2000). While each of these risks may contain a systematic component, e.g., birth defects due to environmental pollutants in a given geographical region, this component should become less influential in country-level data.
An indirect hypothesis test of our theory can then be performed by comparing the estimated risk aversion of populations with varying exposures to systematic risk-those populations with greater systematic risk should be more risk averse. Measures of risk aversion can be obtained from several sources including human-subject exper-iments and surveys (Rabin and Thaler 2001, Holt and Laury 2002), portfolio choice
for financial investors (Guiso and Paiella 2008), labor-supply behavior (Chetty 2006), deductible choices in insurance contracts (Szpiro 1986, Cohen and Einav 2007), con-testant behavior on game shows (Post et al. 2008), option prices (Ait-Sahalia and Lo 2000), and auction behavior (Lu and Perrigne 2008).
By comparing aggregate risk aversion across countries with high and low amounts
of systematic reproductive risk, an indirect econometric test of the evolutionary origin of risk aversion may be constructed.
2.6
Additional Results and Examples
On top of the binary choice model, we assume further that:
Assumption 2. For all
f
E[0, 1],
E[fza+ (1 - f)zbl= E[fya,i + (1 - f)Yb,i]for
all i.With Assumption 2, one can compare growth rates of population in different envi-ronments. More specifically, the optimal log-geometric-average growth rate increases as the portion of idiosyncratic risk increases:
cz\(f*) ;> aA(f*2) if 0
< A,
A2 < 1.To prove this, for any given
f,
take the first derivative of a.(f) to A:9a,\(f) _
z - E[yf]
OA [Azf + (1 - A)E[yf].
Evaluate the first derivative at A 0, 1, and note that Assumption 2 says that
Ez[zf] =
EV[y]:
&aA(f)
Ez
K-
-0,
Ey[yf]
-0
OA
Z IEyyI
'OaAjf) =
[-
Ey][y] = 1 -Ey[yf]E
JJ
w A _ z
to
A:
t
2a(f) =
E
-
(zf - E[yf]) 2< 0.
A2
~(Azf + (1 - A)E[yf])
Therefore, for any given
f,
a(f) is a non-increasing concave function in the interval0 < A
<
1. Because aA(fA*) is the maximum of ax(f) over allf,
it follows thata A(fA*) ;> cA(f 2) whenever A, < A2, as desired.
Next, we provide several examples for common distributions of relative fecundity. Define R = 2/2f to be the relative fecundity of two actions. We can characterize the growth-optimal behavior
f*
for common distribution of R. Figure 2-2 plotsf*
for five distributions of R, as a function of distribution parameters.0.5
en 1
0.5
-2 0 2
ao
(a) Lognormal distribution
3.5 3 c. 2.5 2 1,5 2 3 4
(d) Beta prime distribution
5 2 (b) Gamma distribution 35 0,6 2.5 0-4 2 1 .5. 0 2 0 0.51 0.8 0.6 0.4, ,0.2 0 2 1 2 3 4 (c) Pareto distribution 0.8 0.6 0.4 0.2 0 2 3 4 k
(e) Weibuil distribution
Figure 2-2: Optimal behavior
f*
for several distributions of relative fecundity R = wJ/wj . In each subfigure, different color corresponds to deterministic (f* 0 or 1) orrandomizing (0 <
f*
< 1) behavior given particular parameters of the distribution.Loynormal distribution. Let R follow the lognormal distribution logN(Aa, A/32).
0.8 0.4 0.2 0 0.8 0.6 0 4 0,2 0
The expectation of y and l/y is:
E[y] = exp (Aa +
2 E[1/y] = exp (-Aa +
Therefore the optimal behavior
f*
is given by:if 2'
<
Aa if A2 > jAoa if Afl22 < -Aa.r1
between 0 and 10
Gamma distribution. Let R follow the gamma distribution Gamma(a, /3) where a > 0, 3 > 0. The expectation
is restricted to a > 1,
#3
> 0:of 1/y exists only for a > 1, so the parameter space
E[/y]
=-E[1/y]= .
Therefore the optimal behavior
f*
is given by:[1 between 0 and 1
0
if
/3
<a -1
if a -1 < < a if 3 > a.As special cases of gamma distribution, we automatically have the results for expo-nential, chi-squared, and Erlang distribution.
Pareto distribution. Let, R follow the Pareto distribution Parcto(xm,, a) where
restricted to x,, > 0, a > 1: E[y] = a - 1 a E[1/yJ (a + 1)Xm
Therefore the optimal behavior
f*
is given by:1 if > I - all
f = between 0 and I if 1 - < 1
0 if Xm < 1
-A-Beta Prime distribution. Let R follow the beta prime distribution -A-BetaPrime(a,
/)
where a > 0,
#
> 0. The expectation of y exists only for 3 > 1, and the expectationof 1/y exists only for a > 1, so the parameter space is restricted to a > 1,
/
> 1:E[y]=
/3-1
E[1/y] .
Therefore the optimal behavior
f*
is given by:1 between 0 and 1
0
if/
<
a -1 if a - 1 </
< a + 1 if/3 > a+1.Weibull distribution. Let R follow the Weibull distribution Weibull(k, A) where k > 0, A > 0. The expectation of 1/y exists only for k > 1, so the parameter space is
restricted to k > 1, A > 0:
E[y] = AIF 1 +
El/ 1 I 1
where F(.) is the gamma function. Therefore the optimal behavior
f*
is given by:if
A
>IF
(1- )f*
between0and1 if A A<F(0
ifA <.
r(1+k)
2.7
Discussion
Risk aversion is one of the most widely observed behaviors in the animal kingdom, hence it stands to reason that it must confer certain evolutionary advantages. This in-tuition is confirmed in our simple but general binary-choice model of behavior in which risk aversion emerges from mindless behavior as the evolutionarily dominant behavior in stochastic environments with correlated reproductive risk across the population. Our evolutionary framework shows how the stochastic properties of the environment shapes preferences, yielding specific utility functions that depend on the nature of reproductive risk. Logarithmic utility and linear utility arise as special cases for the two extremes of pure systematic and idiosyncratic risk, respectively. However, for environments containing a mixture of both types of risk, there is a continuum of evo-lutionarily dominant behaviors that does not conform to expected utility theory. The simplicity of our framework suggests that our results are likely to apply across species and that the degree of risk aversion in animal behavior is significantly influenced by the stochastic properties of the environment as it affects fecundity.
These results are closely related to, but distinct from, those in the extant lit-erature on evolution and economic behavior (Robson 1996a, Dekel and Scotchmer
![Figure 3-1: Optimal degree of mutation and optimal log-geometric-average growth rate as a function of regime lengths E[T 1 ] and E[T 2 ]](https://thumb-eu.123doks.com/thumbv2/123doknet/14755842.582457/63.918.126.760.272.812/figure-optimal-mutation-optimal-geometric-average-function-lengths.webp)