HAL Id: hal-00295377
https://hal.archives-ouvertes.fr/hal-00295377
Submitted on 15 Dec 2003
HAL is a multi-disciplinary open access
archive for the deposit and dissemination of
sci-entific research documents, whether they are
pub-lished or not. The documents may come from
teaching and research institutions in France or
abroad, or from public or private research centers.
L’archive ouverte pluridisciplinaire HAL, est
destinée au dépôt et à la diffusion de documents
scientifiques de niveau recherche, publiés ou non,
émanant des établissements d’enseignement et de
recherche français ou étrangers, des laboratoires
publics ou privés.
Ground-based FTIR measurements of CO from the
Jungfraujoch: characterisation and comparison with in
situ surface and MOPITT data
Brice Barret, M. de Mazière, E. Mahieu
To cite this version:
Brice Barret, M. de Mazière, E. Mahieu. Ground-based FTIR measurements of CO from the
Jungfrau-joch: characterisation and comparison with in situ surface and MOPITT data. Atmospheric Chemistry
and Physics, European Geosciences Union, 2003, 3 (6), pp.2217-2223. �hal-00295377�
www.atmos-chem-phys.org/acp/3/2217/
Chemistry
and Physics
Ground-based FTIR measurements of CO from the Jungfraujoch:
characterisation and comparison with in situ surface and MOPITT
data
B. Barret1, M. De Mazi`ere1, and E. Mahieu2
1Belgian Institute for Space Aeronomy, Brussels, Belgium 2Institut de G´eophysique et d’Astrophysique, Li`ege, Belgium
Received: 13 August 2003 – Published in Atmos. Chem. Phys. Discuss.: 25 September 2003 Revised: 4 December 2003 – Accepted: 5 December 2003 – Published: 15 December 2003
Abstract. CO vertical profiles have been retrieved from
so-lar absorption FTIR spectra recorded at the NDSC station of the Jungfraujoch (46.5◦N, 8◦E and 3580 m a.s.l.) for the pe-riod from January 1997 to May 2001. The characterisation of these profiles has been established by an information con-tent analysis and an estimation of the error budgets. A partial validation of the profiles has been performed through com-parisons with correlative measurements. The average vol-ume mixing ratios (vmr) in the 3 km layer above the station have been compared with coincident surface measurements. The agreement between monthly means from both measure-ment techniques is very good, with a correlation coefficient of 0.87, and no significant bias observed. The FTIR total columns have also been compared to CO partial columns above 3580 m a.s.l. derived from the MOPITT (Measure-ment Of Pollution In The Troposphere) instru(Measure-ment for the pe-riod March 2000 to May 2001. Relative to the FTIR columns, the MOPITT partial columns exhibit a positive bias of 8±8% for daytime and of 4±7% for nighttime measurements.
1 Introduction
As it is responsible for about 75% of the OH radical sink, carbon monoxide (CO) plays a major role in atmospheric chemistry (Thompson, 1992). It affects the radiative forcing of the atmosphere by its influence on the concentrations of greenhouse gases such as CH4and O3(Daniel and Solomon,
1998). Space-borne instruments providing quasi-continuous and global observations of CO are regarded as highly valu-able for inverse modeling to infer its natural and anthro-pogenic sources (Bergamaschi et al., 2000). Their validation by independent observations is therefore of great importance. Ground-based FTIR (Fourier Transform Infrared)
instru-Correspondence to: B. Barret
ments provide accurate measurements of total columns of many atmospheric trace gases. Profile retrieval algorithms improve the quality of the total column measurements while providing information on the vertical distributions. We present a characterisation and a partial validation of the re-trieved ground-based FTIR profiles of CO at the Network for the Detection of Stratospheric Changes (NDSC) Inter-national Scientific Station of the Jungfraujoch (ISSJ) in the Swiss Alps. The characterisation includes an information content analysis and a determination of the error budgets. The validation is performed through comparisons between the FTIR retrieved “surface” (3.58–6.5 km) vmr and correl-ative surface in situ measurements. We also present com-parisons between CO columns and profiles from the FTIR retrievals with MOPITT partial columns.
2 Characterisation of CO profiles retrieved from ground-based FTIR at ISSJ
2.1 Retrieval parameters
CO height resolved information has been retrieved from ground-based solar absorption FTIR spectra by e.g. Rinsland et al. (2000) at the ISSJ and Jones et al. (2001) at the NDSC station at Lauder, New Zealand. In the present study, we use the same CO absorption lines and algorithm (SFIT2) as in these two studies. The spectroscopic parameters for the CO absorption lines are taken from the HITRAN2000 database (Rothman et al., 2003). The CO a priori profile used for the retrieval is the same as in the MOPITT version 3 retrievals (Deeter et al., 2003). The CO concentrations are retrieved in 29 layers from the ground (3.58 km) up to 100 km. The first retrieval layer extends from 3.58 to 4.5 km and, from 4.5 to 20.5 km, the retrieval layers are 1 km thick.
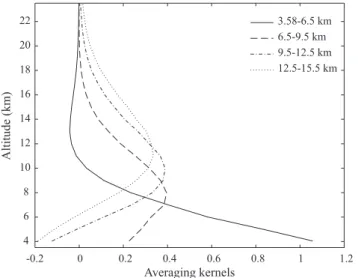
2218 B. Barret et al.: FTIR measurements of CO from the Jungfraujoch -0.2 0 0.2 0.4 0.6 0.8 1 1.2 4 6 8 10 12 14 16 18 20 22 3.58-6.5 km 6.5-9.5 km 9.5-12.5 km 12.5-15.5 km Averaging kernels Altitude (km)
Fig. 1. CO vmr averaging kernels for 3 km thick merged layers from the ground up to 15.5 km. They have been calculated for a SZA (Solar Zenithal Angle) of 61◦and an OPD (Optical Path Difference) of 175 cm.
In the algorithm SFIT2 (Rinsland et al., 1998), the re-trievals are based on a semi-empirical implementation of the Optimal Estimation Method (OEM) (Rodgers, 1976). The a priori and the measurement covariance matrices are ad hoc matrices chosen so that the best possible fit is obtained with-out undesired oscillations in the retrieved profiles. The ad hoc CO a priori covariance matrix (Sx) has diagonal val-ues corresponding to standard deviations of 40% and 30% in the two lowermost layers and of 25% above. In order to account for correlations between CO values at different al-titudes (z, in km), extra-diagonal terms are added to Sx as gaussian functions: Sxij=pSxiiSxjjexp(−
zi−zj
2 )
2. The ad
hoc measurement covariance matrix is diagonal with values corresponding to a signal to noise ratio of 150 as in Jones et al. (2001).
Daily pressure and temperature vertical profiles were taken from the National Center for Environment Prediction (NCEP) for the actual dates and location of the measure-ments.
2.2 Information content analysis
The OEM allows to characterise the retrieved profiles by the use of the so-called averaging kernels, as described by Rodgers (1990, 2000). The retrieved profile xr is related to
the true profile x and to the a priori profile xaby
xr=xa+A(x−xa) + (errors). (1)
in which A is the matrix whose rows are the averaging ker-nels. Eq. (1) shows that for each layer, the retrieved vmr is a weighted mean of the whole profile with weights given by the corresponding averaging kernel. In the ideal case, A is the unit matrix I, while in a real case the averaging kernels
Averaging kernels
eigenvectors
l
1= 1.0
l
2= 0.85
l
3= 0.25
5
10
15
20
-0.5
-0.25
0
0.25
0.5
Fig. 2. Leading eigenvectors of the CO vmr averaging kernels (SZA=61◦, OPD=175 cm). The corresponding eigenvalues (λ) are given in the legend.
are bell-shaped functions. The amplitudes of these functions give an indication of the sensitivity of the retrieval in each layer, and their widths of the vertical resolution for that layer. The averaging kernels of the retrievals are displayed in Fig. 1 for 3 km merged layers between 3.58 and 15.5 km. They show in particular that the retrievals are very sensitive to the lowermost part of the CO profile, with a vertical reso-lution of 3 km at the surface, degrading to 8 km above.
The decomposition of the averaging kernels matrix in eigenvectors and eigenvalues gives a more quantitative esti-mation of the inforesti-mation retrieved from the measurements. The eigenvectors corresponding to eigenvalues close to 1 are the components of the CO profile that are retrieved from the measurement, while the eigenvectors corresponding to eigen-values close to zero are the components of the CO profile that come from the a priori information. The eigenvalues give the ratio of information coming from the measurement for the corresponding components. The number of independent pieces of information retrieved from the measurements is the trace of the averaging kernel matrix (Rodgers, 1990, 2000).
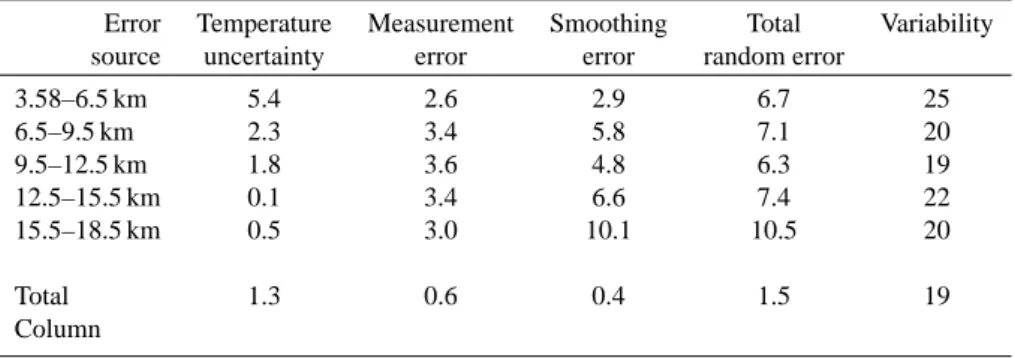
Table 1. Random error budget for the retrieval of CO vmr profiles and total columns (%) from the FTIR at ISSJ
Error Temperature Measurement Smoothing Total Variability source uncertainty error error random error
3.58–6.5 km 5.4 2.6 2.9 6.7 25 6.5–9.5 km 2.3 3.4 5.8 7.1 20 9.5–12.5 km 1.8 3.6 4.8 6.3 19 12.5–15.5 km 0.1 3.4 6.6 7.4 22 15.5–18.5 km 0.5 3.0 10.1 10.5 20 Total 1.3 0.6 0.4 1.5 19 Column
On average, our retrievals contain 2.1 independent pieces of information. The three leading eigenvectors of the averaging kernels matrix and the corresponding eigenvalues are displayed in Fig. 2. The first component is maximum at the ground and reaches its half maximum at 8.5 km, while the second component has two extrema, one at the ground and a broader one between 8 and 15.5 km. For these two compo-nents, most of the information (100% for the first component and 85% for the second one) is retrieved from the measure-ment. The information about the CO profiles contained in the measurements is therefore mostly comprised in the alti-tude range between the ground and 15.5 km. The two leading components do not represent independent layers. Neverthe-less, they allow to retrieve information about the variations of CO below ∼8 km and between ∼8 and ∼15.5 km almost independently. Only 25% of the information corresponding to the third component comes from the measurement. This last meaningfull component allows to improve the height res-olution.
2.3 Error analysis
Uncertainties associated with the CO mean vmr in the 3 km merged layers from 3.58 to 18.5 km and with the total col-umn of CO are listed in Table 1 for the random errors and in Table 2 for the systematic errors. The measurement and smoothing errors are estimated following the formalism de-scribed in Rodgers (1990). As in Barret et al. (2002), the a priori and the measurement covariance matrices used to com-pute the smoothing and the measurement errors are different from the ad hoc matrices used for the retrievals. They are chosen to represent more realistically the uncertainties on the a priori CO profile and on the measurements. The measure-ment errors have been computed assuming an effective signal to noise ratio of 200 for the spectra. This value corresponds to the mean quality of the fit between the simulated and the measured spectra. The smoothing errors have been computed with the a priori covariance matrix used for the MOPITT op-erational retrievals (Deeter et al., 2003), whose variabilities have been reduced by 10% in order to account for the lower
variability of CO above the site of the Jungfraujoch. The latter was estimated from the routine in situ surface mea-surements performed at the Jungfraujoch (Sect. 3) and from the time series of FTIR CO total columns (Sect. 4). The re-sulting relative variabilities are listed in the last column of Table 1. The smoothing error takes into account the a pri-ori profile contribution and the smoothing of the true profile by the averaging kernels. In agreement with the informa-tion content analysis, this error is therefore the smallest in the first layer (3.58–6.5 km) where the 2 leading independent retrieved components have high values, and it is the highest in the 15.5–18.5 km layer where these components have low values (Fig. 2, Sect. 2.2).
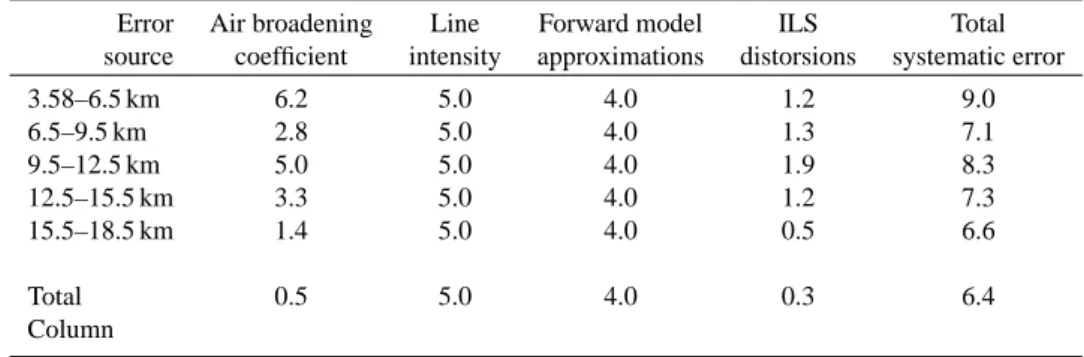
The other sources of error come from uncertainties on pa-rameters or ancillary data used in the retrieval. They are esti-mated by a perturbation method (Barret et al., 2002). A spec-trum synthesized using the actual ancillary data or retrieval parameter is retrieved with these same data or parameter to which their uncertainties are added. The error is estimated as the difference between the retrieved and the true profile. Following Rinsland et al. (1999) the temperature uncertainty is set to 2 K at all altitudes. For the CO absorption lines, the air broadening coefficient uncertainty is set to 2% and the line intensity uncertainty to 5% (Rothman et al., 2003). The effect of systematic distortions of the instrumental line shape (ILS) is estimated following Rinsland et al. (1999). The ILS is modeled by a straight-line apodization function which value at maximum path difference is called the effec-tive apodization parameter (EAP) (Park, 1983). The distor-sions of the ILS are represented by a 10% perturbation of the EAP. The systematic error due to the limitations and approx-imations of the forward model is taken from Rinsland et al. (2000).
The comparison between the a priori variabilities and the total random errors shows that the uncertainties on the CO vmr’s are 2 to 4 times lower after the measurement.
The total systematic errors are all comprised between 6 and 9%.
2220 B. Barret et al.: FTIR measurements of CO from the Jungfraujoch
Table 2. Systematic error budget for the retrieval of CO vmr profiles and total columns (%) from the FTIR at ISSJ
Error Air broadening Line Forward model ILS Total source coefficient intensity approximations distorsions systematic error 3.58–6.5 km 6.2 5.0 4.0 1.2 9.0 6.5–9.5 km 2.8 5.0 4.0 1.3 7.1 9.5–12.5 km 5.0 5.0 4.0 1.9 8.3 12.5–15.5 km 3.3 5.0 4.0 1.2 7.3 15.5–18.5 km 1.4 5.0 4.0 0.5 6.6 Total 0.5 5.0 4.0 0.3 6.4 Column
Jan Apr Jul Oct Jan Apr Jul Oct Jan Apr Jul Oct Jan Apr Jul Oct Jan 60 80 100 120 140 160 180 200 220 1997 1998 1999 2000 CO vmr (ppb) Month
Fig. 3. Comparison between FTIR and in situ monthly averaged vmr’s. Full line with full circles and shaded area: in situ surface vmr’s and associated monthly variability (1σ ). Dashed line with empty diamonds and associated error bars: FTIR 3.58–6.5 km aver-aged vmr and associated monthly variabilities.
3 Comparison of CO surface in situ and FTIR measure-ments
The Swiss Federal Laboratories for Materials Testing and Research (EMPA) performs continuous in situ surface mea-surements of CO vmr’s at the Jungfraujoch since 1996. The overall uncertainty is estimated to be 10% on hourly mean values (Forrer et al., 2000). These surface measurements pro-vide an opportunity to validate the retrieved FTIR vmr near the ground. We have compared the monthly averaged surface vmr with the 3.58–6.5 km layer vmr retrieved from the FTIR measurements. Only measurements for days with correla-tive FTIR observations are included in the monthly surface vmr averages. In order to eliminate high surface variability caused by boundary layer processes, days with surface CO vmr variability greater than 20 ppbv have been rejected in
the average. The results of the comparison are displayed in Fig. 3.
Both datasets show a very good agreement and are highly correlated (correlation coefficient of 0.87 for 41 months of comparison). The mean difference between the FTIR sur-face vmr’s and the in situ data is (0±13) ppbv. The highest discrepancies are found in the late summer months and are believed to result from thermally induced vertical transport that brings polluted air from the boundary layer to the station (Lugauer et al., 1998). The abnormaly high CO concentra-tions detected by both measurement techniques in the sum-mer of 1998 correspond to a 10-year CO sumsum-mertime max-imum observed in the Extra-Tropical Northern-Hemisphere and attributed to above average forest fires in America and in Russia (Wotawa et al., 2001).
4 Comparison of MOPITT and ground-based CO mea-surements
MOPITT is a nadir-sounding instrument onboard the Terra platform that has been launched on 18 December 1999. Its purpose is to measure CO and CH4 total columns as well
as CO vertical distributions with a horizontal resolution of 22 km. The instrument is described in Drummond et al. (1996), and the retrieval algorithm in Pan et al. (1998). The operational CO retrieval algorithm which produces the ver-sion 3 level 2 data used in this study is described in Deeter et al. (2003). The retrievals are based on 3 of the planned 6 instrument signal channels that exhibit a very low relative sensitivity to the boundary layer. For measurements over land, the higher thermal contrast between the surface and the atmosphere during the day makes daytime measurements more sensitive to the boundary layer than nighttime measure-ments. Rodgers and Connor (2003) describe how to compare MOPITT level 2 data to ground-based FTIR data by taking the different vertical sensitivities of the instruments into ac-count. From simulated comparisons between profiles and total columns from both instruments, they conclude that it is more meaningful to compare total columns. Because of
the high altitude of the ISSJ station, total columns cannot be compared. However, using the formalism of Rodgers and Connor (2003), we are able to take the altitude of the station into account in a more quantitative way than Pougatchev et al. (1998) in their comparison of CO columns from the Mea-surement of Air Pollution from Space (MAPS) on board the Space Shuttle with ground-based FTIR data.
We compare the daily average FTIR column with the MO-PITT column above the station, calculated as the average over all pixels satisfying the following criteria of coinci-dence. The pixels must lie within a circle of 300 km around the ISSJ, they must be cloud free, and their retrieval bottom pressure must be higher than 865 hPa. This last criterion used to eliminate pixels with less than 7 retrieval levels, causes a loss of less than 5% of the data. Daytime MOPITT mea-surements are compared with FTIR observations taken on the same day. Nighttime MOPITT measurements are compared with FTIR observations taken the day before or the day after. The assumption that the FTIR and the MOPITT CO columns probably exhibit little diurnal variations is supported by the following facts: (i) CO has a chemical lifetime of ∼2 months (Daniel and Solomon, 1998), (ii) no diurnal variations are de-tected from the FTIR columns time series meaning that they are not sensitive to diurnal variations induced by convection in spring and summertime in mountainous areas (Lugauer et al., 1998; Forrer et al., 2000).
In order to take into account the difference in height sensi-tivity between both instruments, we must compute the col-umn averaging kernels (Rodgers and Connor, 2003). The retrieved column cr is computed from the retrieved profile
xr, the a priori profile xa and the a priori column ca using
the column operator C, following : cr=ca+Ct(xr−xa)with
tindicating the transpose of the matrix. The column operator is a column vector formed of the partial air columns in each retrieval layer in molecules/cm2. When C is determined, the column averaging kernel, a, can be computed from the pro-file averaging kernel matrix A as:
at=CtA. (2)
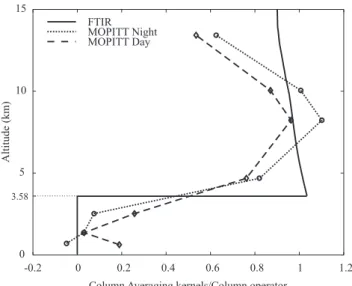
The MOPITT CO vmr’s have been interpolated on 7 pres-sure levels such that the prespres-sure at the altitude of the ISSJ corresponds to the upper boundary of the third layer. The column averaging kernels appropriate for the column above the altitude of the station, normalised by the total column op-erator C, are displayed for both instruments in Fig. 4. For the FTIR instrument, this averaging kernel is the total column averaging kernel, while for MOPITT it is a partial column averaging kernel, obtained by setting the first 3 elements of
C in Eq. (2) equal to zero. The FTIR total column averaging
kernel is very close to the total column operator and intro-duces almost no smoothing. The MOPITT partial column averaging kernel introduces two kinds of smoothing error. The kernels show less sensitivity to the first and fourth layers above the ISSJ altitude than to the two middle layers. The non-zero terms in the kernels for the 3 layers below the ISSJ
-0.2 0 0.2 0.4 0.6 0.8 1 1.2 0 5 3.58 10 15
Column Averaging kernels/Column operator
Altitude
(km)
FTIR MOPITT Night MOPITT Day
Fig. 4. Ratio of the CO total column (resp. partial column above 3.6 km) averaging kernels for the FTIR (resp. MOPITT) instrument to the total column operator. Full line: FTIR total column; dashed: MOPITT daytime; dotted: MOPITT nighttime.
Table 3. Retrieval errors for CO columns from MOPITT (in 1016molecules/cm2)
Day Night Total Column 7.4 15 Partial Column below ISSJ 21 35 Partial Column above ISSJ 3.4 3.5
altitude are responsible for bringing some information from the profile below this altitude into the partial column above it.
The retrieval errors computed according to Rodgers (2000) are summarized in Table 3. It shows that the MOPITT er-ror is reduced significantly when considering partial columns above the ISSJ instead of total columns.
In order to quantify the impact of the column averaging kernels smoothing effects, we have simulated the MOPITT columns above the ISSJ using the FTIR retrieved profiles, hereinafter indicated as cF M, as in Eq. (25) in Rodgers and
Connor (2003). Above the ISSJ altitude, the retrieved FTIR profiles have been interpolated on the 4 upper modified MO-PITT pressure levels. On the 3 lower levels, we used the CO vmr’s retrieved from MOPITT as a proxy for the missing FTIR values. This is shown explicitly in Eq. (3), in which the subscript F stands for FTIR and M for MOPITT, and the level numbering refers to the modified MOPITT pressure levels.
cF M =ca+atM(4:7)(xrF (4:7)−xa(4:7))+
2222 B. Barret et al.: FTIR measurements of CO from the Jungfraujoch
Table 4. Statistics of the comparison between FTIR and MOPITT CO columns (in 1016molecules/cm2). cF stands for FTIR total
col-umn, cMfor MOPITT partial column above ISSJ and cF Mfor FTIR
total columns smoothed by the MOPITT partial column averaging kernel; R(x, y) is the correlation coefficient between quantities x and y; 1cF Mas defined in Eq. (4) is taken into account in the
stan-dard deviations of cF M−cM Daytime Nighttime Number of days 41 42 cF−cM −8.4±5.8 −1.0±7.5 R(cF, cM) 0.92 0.87 cF M−cM −8.1±7.7 −3.8±7.4 R(cF M, cM) 0.89 0.87 1cF M ±3.4 ±0.4
The impact of using the MOPITT values on the 3 lower levels is quantified as:
1cF M=atM(1:3)σrM(1:3) (4)
where σrM is the MOPITT retrieval error profile (see
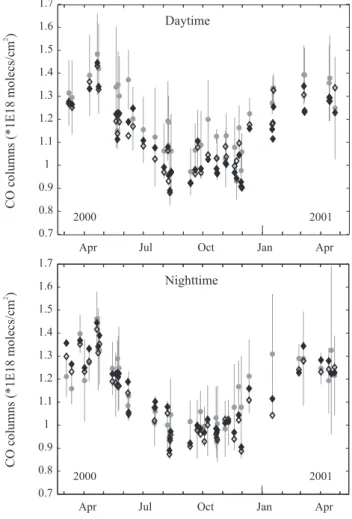
Table 4). Comparisons between MOPITT and FTIR data are more straightforward when the instrument is located at sea level because no approximation for the FTIR values is needed in this case. Figure 5 displays the comparisons be-tween FTIR and MOPITT columns; the correponding statis-tics are presented in Table 4. For both daytime and nighttime measurements, MOPITT overestimates the CO columns rel-ative to the FTIR. The nighttime/daytime MOPITT column differences relative to FTIR columns are reduced when the smoothing of Eq. (3) is applied to the FTIR profiles. The difference of sensitivity between night- and daytime MO-PITT measurements may therefore be partly responsible for the night/day discrepancy. A more significant effect is ex-pected for FTIR instruments located at sea level because the difference in night/day sensitivity is highest in the lowermost levels (Deeter et al., 2003).
The amplitude of the CO seasonal variations, quantified by fitting a single sinusoid with a period of one year through the time series of FTIR CO total columns from January 1999 to May 2001, is 16.5%. The standard deviations of the FTIR MOPITT differences are therefore at least 2 times lower than the seasonal variations, showing that both instruments repro-duce the CO variations correctly. This is confirmed by the correlation coefficients that are all close to 0.9 (Table 4).
5 Conclusions
The quality of the CO vertical profile information extracted from ground-based FTIR solar absorption observations at the Jungfraujoch has been demonstrated. The measurements contain ∼2 independent pieces of information that allow
CO columns (*1E18 molecs/cm ) 2 CO columns (*1E18 molecs/cm ) 2
Apr Jul Oct Jan Apr
Apr Jul Oct Jan Apr
0.7 0.8 0.9 1 1.1 1.2 1.3 1.4 1.5 1.6 1.7 0.7 0.8 0.9 1 1.1 1.2 1.3 1.4 1.5 1.6 1.7 2000 2000 2001 2001 Daytime Nighttime
Fig. 5. FTIR and MOPITT daily averaged columns. Upper plot for daytime, lower plot for nighttime MOPITT measurements. Full di-amonds: FTIR total columns; empty didi-amonds: FTIR total columns smoothed with MOPITT kernels (Eq. 2); full gray circles: MOPITT partial columns above the ISSJ altitude; gray error bars represent the MOPITT variability (1σ ) for all the pixels entering the daily aver-age (see text for details).
to retrieve the CO abundances in the lower to middle tro-posphere (3.58–8 km) and in the upper-trotro-posphere-lower- upper-troposphere-lower-stratosphere (8–15 km) almost independently. In 3 km thick layers from the ground (3.58 km) to 15.5 km, the CO vmr is retrieved with precisions and accuracies better than 10%. The monthly means of the average vmr in the 3 km layer above the altitude of the station follow closely the monthly means of the correlative in situ surface measurements at the station without significant bias.
Comparisons between the CO columns above the ISSJ de-rived from the FTIR and from the MOPITT space borne in-strument, taking into account the smoothing affecting MO-PITT columns, show that MOMO-PITT values are 8±8% (resp. 4±7%) higher than the corresponding FTIR values for day-time (resp. nightday-time) MOPITT measurements. While CO seasonal variations are estimated from the FTIR data to be of
the order of ±16%, this comparison proves that MOPITT is able to provide useful geophysical information about the free tropospheric CO at northern mid-latitudes.
Acknowledgements. The authors thank the OSTC Services of the
Belgian Prime Minister (contracts ESAC EV/35/3A and research project MO/35/007) for supporting this research. Thanks are due to the NASA Langley Atmospheric Sciences Data Center for provid-ing us with the MOPITT data. B. Buchmann, EMPA, Switzerland, is acknowledged for providing us with the CO surface measure-ments at ISSJ. We further thank all our colleagues of the Royal Ob-servatory of Belgium, the University of Li`ege and the Belgian Insti-tute for Space Aeronomy who contributed to the observations at the Jungfraujoch station. This work would have been impossible with-out the support from the Jungfraujoch Hochalpine Forschungssta-tion.
References
Barret, B., De Mazi`ere, M., and Demoulin, P.: Retrieval and characterization of ozone profiles from solar in-frared spectra at the Jungfraujoch, J. Geophys. Res., 107, doi:10.1029/2001JD001298, 2002.
Bergamaschi, P., Hein, R., Heimann, M., and Crutzen, P. J.: Inverse modeling of the global CO cycle 1. Inversion of CO mixing ra-tios, J. Geophys. Res., 105, 1909–1927, 2000.
Daniel, J. S. and Solomon, S.: On the climate forcing of carbon monoxide, J. Geophys. Res., 103, 13 249–13 260, 1998. Deeter, M. N., Emmons, L. K., Francis, G. L., Edwards, D. P., Gille,
J. C., Warner, J. X., Khattatov, B., Ziskin, D., Lamarque, J.-F., Ho, S.-P., Yudin, V., Attie, J.-L., Packman, D., Chen, J., Mao, D., and Drummond, J. R.: Operational carbon monoxide retrieval al-gorithm and selected results for the MOPITT instrument, J. Geo-phys. Res., 108, doi:10.1029/2002JD003186, 2003.
Drummond, J. R and Mand, G. S.: The Measurements of Pollution in the Troposphere (MOPITT) instrument: Overall Performance and Calibration Performance, J. Atm. and Ocean. Tech., 13, 314– 320, 1996.
Forrer, J., R¨uttimann, R., Schneiter, D., Fisher, A., Buchmann, B., and Hofer, P.: Variability of trace gases at the high-Alpine site Jungfraujoch caused by meteorological processes, J. Geophys. Res., 105, 12 241–12 251, 2000.
Jones, N. B., Rinsland, C. P., Ben Liley, J., and Rosen, J.: Cor-relation of aerosol and carbon monoxide at 45◦S: Evidence of biomass burning emissions, Geophys. Res. Lett., 28, 709–712, 2001.
Lugauer, M., Baltensperger, U., Furger, M., G¨aggeler, H. W., Jost, D. T., Scwikowski, M., and Wanner, H.: Aerosol transport to the high Alpine sites Jungfraujoch (3454 m a.s.l.) and Colle Gnifetti (4452 m a.s.l.), Tellus, 50B, 76–92, 1998.
Pan, L., Gille, J. C., Edwards, D. P., Bailey, P. L., and Rodgers, C. D.: Retrieval of tropospheric carbon monoxide for the MOPITT experiment, J. Geophys. Res., 103, 32 277–32 290, 1998. Park, J. H.: Analysis method for Fourier transform spectroscopy,
Appl. Opt., 22, 835–849, 1983.
Pougatchev, N. S., Jones, N. B., Connor, B. J., et al.: Ground-based infrared solar spectroscopic measurements of carbon monoxide during 1994 Measurement of Air Pollution from Space flights, J. Geophys. Res., 103, 19317–19325, 1998.
Rinsland, C. P., Jones, N. B., Connor, B. J., Logan, J. A., Pougatchev, N. S., Goldman, A., Murcray, F. J., Stephen, T. M., Pine, A. S., Zander, R., Mahieu, E., and Demoulin, P.: Northern and southern hemisphere ground-based infrared spectroscopic measurements of tropospheric carbon monoxide and ethane, J. Geophys. Res., 103, D21, 28 197–28 217, 1998.
Rinsland, C. P., Goldman, A., Murcray, F. J., et al.: Infrared solar spectroscopic measurement of free tropospheric CO, C2H6, and HCN above Mauna Loa, Hawaii: Seasonal variations and evi-dence for enhanced emissions from the Southeast Asian tropical fires of 1997–1998, J. Geophys. Res., 104, 18 667–18 680, 1999. Rinsland, C. P., Mahieu, E., Zander, R., Demoulin, P., Forrer, J., and Buchmann, B.: Free tropospheric CO, C2H6, and HCN above central Europe: Recent measurements from the Jungfraujoch in-cluding the detection of elevated columns during 1998, J. Geo-phys. Res., 105, 24 235–24 249, 2000.
Rodgers, C. D., Retrieval of atmospheric temperature and composi-tion from remote measurements of thermal radiacomposi-tion, Reviews of Geophysics and Space Physics, 14(4), 609-624, 1976.
Rodgers, C. D.: Characterisation and error analysis of profiles re-trieved from remote sounding measurements, J. Geophys. Res., 95, 5587–5595, 1990.
Rodgers, C. D.: Inverse methods for atmospheric sounding: The-ory and Practice, Series on Atmospheric, Oceanic and Planetary Physics – Vol. 2, World Scientific, 2000.
Rodgers, C. and Connor, B. J.: Intercomparison of remote sounding instruments, J. Geophys. Res., 108, doi:10.1029/2002JD002299, 2003.
Rothman, L. S., Barbe, A., Benner, D. C., et al.: The HITRAN Molecular Spectroscopic Database: Edition 2000 including Up-dates through 2001, J. Quant. Spectrosc. Radiat. Transfer, 82, 5–44, 2003.
Thompson, A. M.: The Oxidizing Capacity of the Earth’s Atmo-sphere: Probable Past and Future Changes, Science, 256, 1157– 1165, 1992.
Wotawa, G., Novelli, P. C., Trainer, M., and Granier, C.: Inter-annual variability of summertime CO concentrations in the Northern Hemisphere explained by boreal forest fires in North America and Russia, Geophys. Res. Lett., 28, 4575–4578, 2001.