Separation and Purification
Content
Dear Reader ... 1
David Leleu
ReDrop to Simulate the Settling of Liquid-Liquid Dispersion ... 2
Junior Ekorong
Single-Drop Sedimentation Velocity for Highly Viscous Systems ... 4
Zaheer Shariff
Modelling of Solid-Liquid Equilibrium and its Application for Optimization of the
PULSE Process ... 6
Khang Vu Dinh
Potential for Phosphorus Recovery in Southern Vietnam ... 8
Andreas Pfennig
Politics Misled by Unrealistic Population Scenarios ... 10
Andreas Pfennig
Systems View of Sustainable Economy ... 12
Khang Vu Dinh
My time in Liège, 2018 ... 14
Zaheer Shariff
Excursion to the BASF complex in Ludwigshafen ... 15
David Leleu
Group Outing: Surrounding the Lake of Eupen... 16
Andreas Pfennig
Schnaps on YouTube ... 17
Andreas Pfennig
Cookies and X-Mas Lecture ... 18
Andreas Pfennig
Teaching in Oman and Thailand ... 19
Publications and Presentations ... 20
title photo by:
David Leleu, showing a first result of an automatically evaluated experiment with the
iso-optical system in the settling cell
– 1 –
Dear Reader
Another year has passed too quickly. It has been a year full of change and challenges. At the beginning of the year Maria Chiara Quaresima left the group. For her south-Italian soul the weather was too bad in Belgium, keeping in mind that Liège lying close to Aa-chen of course has the same well-known abundant rainfall, and that the last months of 2017 were the darkest since decades as doc-umented in meteorological statistics. Her teaching-assistant duties were then taken over by Junior Franck Ekorong Akouan Anta, or Junior Ekorong for short. He continues the work on extraction with highly viscous phases. Then, again Mr. Khang Vu Dinh from the Uni-versity of Industry in Ho Chi Minh City in Vi-etnam visited for several months. His work is closely related to that of Zaheer Shariff, both working on phosphorous recovery from sew-age sludge. One goal was to more closely combine their work in order to unleash syner-gies. Also Mr. Khang managed the formalities to become Ph.D. student of the University of Liège.
Also this year teaching visits to Bangkok and Oman were organized. With all preparations and travelling times this contributed roughly 10% of the annual working time. Nevertheless, it is always rewarding, realizing that one suc-ceeded in passing on some of the own experi-ence.
Meanwhile some of the former regular events have been re-established, some already end of last year, namely the preparation of cookies for the Christmas lecture. Some of the cookies of course remain as desert for the official depart-ment Christmas lunch. Also we went on a group outing, surrounding a lake on a nice late summer day.
Finally, also personally big milestones have been reached, finishing a book on our suc-cessful future. Not an easy read (what else would you have expected?), so not explicitly recommended. It summarizes a philosophical perspective, which clarifies, why we are indi-vidually responsible. Then the question is an-swered, which responsibilities we actually have, if humanity shall reach sustainable well-being for everybody. The perspectives are actually rather horrifying, especially when real-izing towards the end of the year that major assumptions in the scenarios developed to guide politics can be shown to be clearly wrong. This topic has been worked out mean-while to a certain detail. It is e.g. shown in which context bio-economy can work in a sus-tainable environment, which has been pre-sented partly at the ProcessNet Jahrestagung in Aachen. Corresponding videos have then been prepared and supplied via YouTube. Concerning research, progress is visible but always too slow (citing one of my teachers, John Prausnitz). A major breakthrough has been achieved in describing coalescence by David Leleu, finally being able to put all known details of coalescence of drops properly to-gether to formulate a consistent model. Then Zaheer Shariff together with Laurent Fraikin from the group of Angélique Léonard estab-lished all process steps for phosphorous re-covery on lab scale and succeeded in model-ling with e.g. proper thermodynamics all rele-vant process steps. Junior Ekorong finally managed to acquaint himself with the topic of extraction and established essentially the state that was achieved when Maria Chiara Quaresima left. Thus, everything is well on its way, as you can again realize when browsing through this brochure.
So: Enjoy reading! Andreas Pfennig
– 2 –
ReDrop to Simulate the Settling of
Liquid-Liquid Dispersion
David Leleu
Continuous and batch settlers are used inpro-cesses in order to separate liquid-liquid disper-sion. Their design can be challenging, e.g. quantitatively predicting the remaining fraction of fine drops found at settler outlet as function of the operating conditions. For the batch-settler design, a numerical tool has been developed, which is based on the ReDrop concept (Ayes-terán et al. 2015). This tool, which applies a Monte-Carlo method to solve the drop popula-tion balances, allows to simulate the separapopula-tion of liquid-liquid dispersions and thus to optimize the design of continuous settlers. Sedimenta-tion and coalescence are evaluated for a suffi-ciently large ensemble of representative individ-ual drops at each time step. The time needed for the settling process is determined from the simulation. The information can be used to de-sign a settler. In these simulations, the coales-cence modeling is a major challenge due to the complex interactions of drops upon approach and during the coalescence process.
ReDrop concept
The ReDrop approach considers each individ-ual drop present in the system. Their individindivid-ual velocity is evaluated at each time step with a suitable sedimentation model in order to follow their individual vertical position in the settling cell. The coalescence probability is then evalu-ated for drop-drop coalescence in the
sedimen-tation and dense-packed zone and for drop-in-terface coalescence with the major indrop-in-terface. The horizontal position of the drops is not ac-counted for. Thus, only the probability that two drops meet can be evaluated in order to quan-tify correctly the probability of a coalescence event, which is then realized with a Monte-Carlo approach in the simulation.
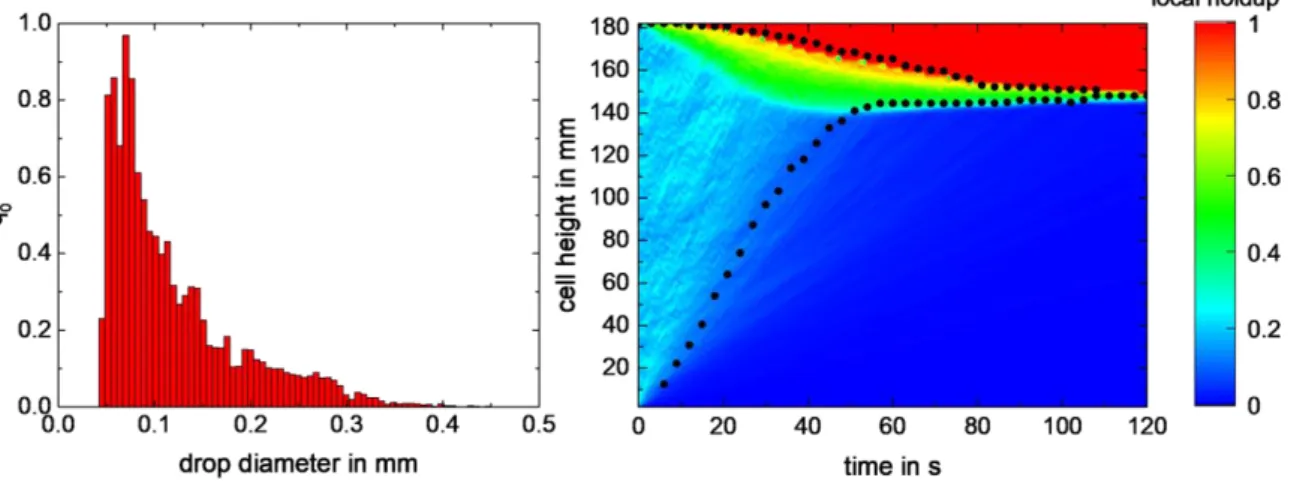
For the simulation, the settler height is subdi-vided into height elements which allows the evaluation of the local hold up. The latter influ-ences the sedimentation velocity and is taken into account in the modelling. The local hold-up calculation is used also to obtain a visual repre-sentation of the settling as presented in Fig. 1. The coalescence model
As shown in Fig. 2, the probability that two drops coalesce depends on three variables. The first is the frequency with which they meet, defined by the so-called collision rate. The second pa-rameter is the bouncing probability, which char-acterizes the probability that the drops stay in contact after the collision. If they do not, the col-lision leads to the direct bouncing without any chance to coalesce. The final variable influenc-ing the coalescence probability is the efficiency with which they coalesce once they met. The coalescence efficiency in turn depends on the time, during which the drops stay in contact and the time they would need to coalesce.
– 3 – Fig. 2: Coalescence model
It turns out that solely the fluid dynamics of the regarded equipment determines the frequency with which drops meet, the bouncing probability and the time they stay in contact. The differ-ences in equipment to which this model is ap-plied characterize the fluid dynamics, which thus has to be characterized only once for a given type of equipment. The time the drops need to coalesce on the other hand only de-pends on the specific material system used (Kopriwa, Pfennig, 2016).
Coalescence probability
The developed model expresses the coales-cence probability by:
pcoalescence=1- exp (- tcontact tcoalescence)
whereas the widely used model of Coulaloglou and Tavlarides is expressed by:
pcoalescence= exp (-tcoalescence tcontact )
The developed equation describing the coales-cence probability is thus fundamentally different from the model of Coulaloglou and Tavlarides, which is inconsistent at a basic level. Indeed, their model cannot expresses similar coales-cence probability if the time step is varied. Model validation
The coalescence time can be evaluated experi-mentally from any suitable settling experiment. Here the experiments are conducted in the standardized settling cell. The equipment was developed in the framework of the ERICAA pro-ject. The cell proposed by Henschke (Henschke et al., 2002) was optimized and validated. It con-sists of a glass vessel with a capacity of 800ml, with 2 shafts for stirring with 4 stirrers on each shaft. An endoscopic probe (SOPAT-VR-Sc) is used to measure the drop-size distribution in
situ. ATEX regulation has been also taken into account in order to work with volatile solvents. In order to validate the coalescence model and the numerical approach, a measurement of the local holdup at any height of the cell and at any time is necessary to be compared to the simu-lation. Here, iso-optical systems are used, be-cause the interface is invisible in such systems, in contrast to usual system with different refrac-tive indexes of the phases. In addition, a dye is added to one phase, so that color intensity then allows the direct determination of the local holdup as function of height and time (see title photo of this brochure).
First results are depicted in Figure 1. It shows on the right side a simulation performed with the ReDrop program. The model parameters were fitted in order to follow the experimental data shown by the black dots. The initial drop-size distribution used in the simulation was meas-ured with the SOPAT probe and is represented on the left side of the figure. This is a good start-ing point for the model validation and the use of iso-optical system will complete the validation. Acknowledgements
This work was supported by the FNRS and by the Federal Ministry for Economic Affairs and Energy of Germany through the ERICAA pro-ject.
References
Ayesterán, J., Kopriwa, N., Buchbender, F., Kalem, M., Pfennig, A., 2015: ReDrop – A Simulation Tool, for the Design of Extrac-tion Columns based on Single-Drop Experi-ments. Chem. Ing. Tech. 38, 1894-1900. Kopriwa, N., Pfennig, A., 2016:
Characteriza-tion of Coalescence in ExtracCharacteriza-tion Equip-ment Based on Lab-Scale.
Solvent extraction and Ion Exchange, 34, 622-642
Henschke, M., Schlieper, L.H., Pfennig, A., 2002: Determination of a coalescence para-meter from batch-settling experiments.
Chem. Eng. J., 85, 369-378
For further questions and comments, please contact:
David Leleu
phone: +32 (0) 4 366-3559
– 4 –
Single-Drop Sedimentation Velocity
for Highly Viscous Systems
Junior Ekorong
MotivationSolvent extraction is used e.g. in pharmaceuti-cal and biotechnologipharmaceuti-cal engineering. During the operation, a liquid extractant is added to a process stream to remove one or more compo-nents from that stream. In previous work, a de-sign method has been developed, which utilizes models describing the behaviour of individual drops of the dispersed phase in an extraction column (Altunok et al., 2006). It accounts for a limited number of elementary processes, namely mass transfer, sedimentation, coales-cence and splitting, including the so-called swarm effects. The effect of column internals is also take in account. The drop-models applied contain material-specific parameters that are fit-ted to results of experiments with individual drops in dedicated lab-scale experiments. Sedimentation, like the other elementary pro-cesses, has been intensively studied. For low-viscous systems, many models describing the sedimentation behaviour of drops are available. In the past some studies have been performed, which allow first ideas on how systems with in-creased viscosity may behave. Especially, Adinata (2011) performed an orienting study on viscous systems. One of the results is that the parameter 𝛼𝑠𝑤, which describes the sharpness
of the transition between rigid drops and drops with internal circulation in the Henschke model for drop sedimentation (Henschke, 2003), has to be adjusted. For low-viscous systems, Henschke kept it constant. Therefore, the vis-cosity influence on the sedimentation model needs to be investigated more systematically. The Method
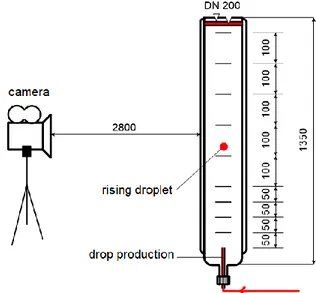
The sedimentation velocity of drops rising in a continuous phase will be investigated. As in the studies of Adinata (2011), in one of the systems proposed by the EFCE, the viscosity of the aqueous phase will be increased by adding PEG (polyethylene glycol), and paraffin oil will be added to the organic phase. The sedimenta-tion velocity is then determined in a single-drop cell shown in Fig. 1.
Fig. 1: Sedimentation cell for the measure-ment of single-drop terminal velocity The cell consists of a cylindrical vessel with tem-perature control. Inside this vessel, a drop of known volume is produced with the help of a computer driven syringe, which can inject a de-fined volume of dispersed phase at a dede-fined velocity via a glass nozzle. By finding the right amount of dispersed phase to inject and the right velocity to correctly produce one single drop, individual drops with identical drop diam-eter can be generated. Each drop detaches from the glass-nozzle tip and its path is then rec-orded with a high-resolution video camera. From the recorded videos, the time needed by the drop to rise in the continuous phase through a defined distance is determined, characterizing its sedimentation velocity. Then, the model pa-rameters are fitted to experimental data. Preliminary Results
As the drop diameter increases, the sedimenta-tion velocity will reach a maximum, and then de-creases again. A comparison between the mod-els used for describing low-viscous systems shows that only the models from Vignes, Henschke and Grace et al. in Fig. 2 allow to de-scribe this behaviour.
– 5 – Fig. 2: Models for sedimentation velocity as a
function of drop size (system: butyl ac-etate + water)
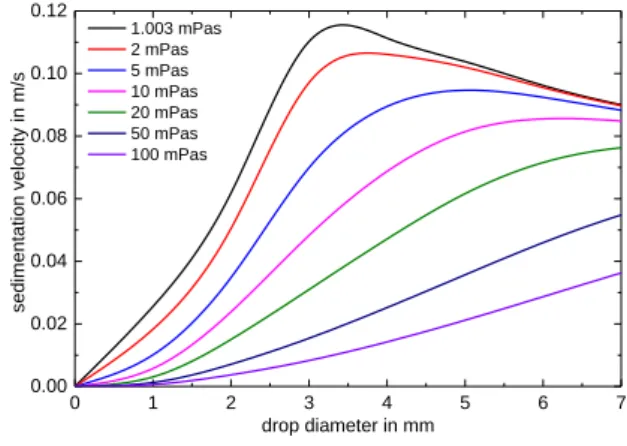
Among the models found in the literature, only the Henschke model takes into account viscos-ities of both phase. A sensitivity study, carried out by varying each phase viscosity, allow ob-serving two different behaviours, depending on the properties of the phases involved. As shown in Fig. 3, increasing the dispersed-phase cosity may lead to a reduction of the drop vis-cosity up to around 25 mPas, with no significant change by a further increase.
Fig. 3: Effect of dispersed-phase viscosity on sedimentation velocity (system: butyl acetate + water)
On the other hand, Fig. 4 shows an expected continuous decrease of the velocity as the con-tinuous phase viscosity increases. This de-crease remains large also at high viscosities. The decrease of sedimentation velocity pre-dicted by the model agrees with Adinata’s (2011) observations. This sensitivity study al-lowed the identification of drop diameters and
viscosities, at which the experiments are best performed to discriminate between the models. Based on these preliminary studies, a more sys-tematic approach towards varying phase cosities will be taken. Also the variation of vis-cosity of both phases simultaneously will be in-vestigated. The obtained results allow estab-lishing a clear relation between the variation of viscosity of one or both phases and drop sedi-mentation. Models do not take directly in ac-count the transfer component concentration, even if its presence has an effect of the physical properties of the phase that contains it. There-fore, in a following step experiments will be per-formed to depict the effect of the transfer-com-ponent concentration on the sedimentation ve-locity in highly viscous systems.
Fig. 4: Effect of the continuous-phase viscos-ity on the sedimentation velocviscos-ity (sys-tem: butyl acetate + water)
References
Adinata, D., 2011: Single drop modelling in high viscosity system, PhD Thesis, RWTH Aa-chen, Germany
Altunok, M., Grömping, T. and Pfennig, A., 2006: ReDrop - an Efficient Simulation Tool for Describing Solvent and Reactive Extrac-tion Columns, Comp. Aided Chem. Eng., 21, 665-670
Henschke, M., 2003: Auslegung pulsierter Sieb-boden-Extraktionskolonnen. Shaker Verlag,
Aachen.
For further questions and comments, please contact: Junior Ekorong phone: +32 (0) 4 366-3559 [email protected] 0 1 2 3 4 5 6 7 0.00 0.05 0.10 0.15 0.20 Stockes model Miseck model Oseen model Ishii & Zuber Vignes Grace et al. Hu and Kintner Henschke se di mentati on ve lo ci ty (m/s) drop diameter in mm rigid drop circulating drop oscillating drop deformed drop 0 1 2 3 4 5 6 7 0.00 0.02 0.04 0.06 0.08 0.10 0.12 sed imen tat ion veloc ity in m/s drop diameter in mm 0.73 mPas 1 mPas 2 mPas 5 mPas 10 mPas 20 mPas 50 mPas 100 mPas 0 1 2 3 4 5 6 7 0.00 0.02 0.04 0.06 0.08 0.10 0.12 sed imen tat ion veloc ity in m/s drop diameter in mm 1.003 mPas 2 mPas 5 mPas 10 mPas 20 mPas 50 mPas 100 mPas
– 6 –
Modelling of Solid-Liquid Equilibrium and its
Application for Optimization of the PULSE Process
Zaheer Shariff
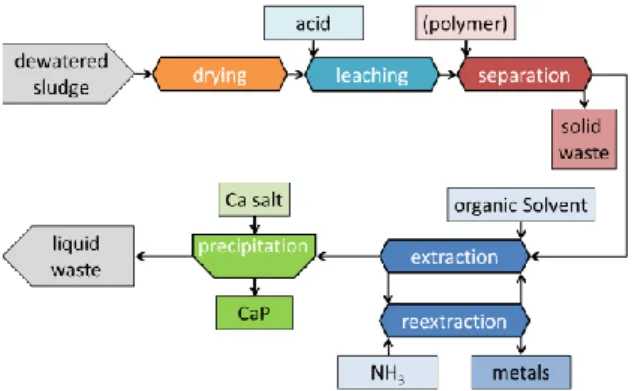
Phos4You project and PULSE processPhosphorous (P) is an essential element for life and has a limited availability in nature. Mineral P is mainly produced from phosphate rock. In the EU more than 90% of P used is imported to meet its requirements. As a result, significant research has been directed towards finding economical ways of recycling P from waste streams, which otherwise will be lost to landfills or the oceans. A new P-recovery technology called Phosphorus ULiège Sludge Extraction (PULSE) process as shown schematically in Fig. 1 is being developed at ULiège. It is aimed at recovering P from partially or fully dried sludge from wastewater treatment plants fol-lowed by extraction of heavy metals and/or P to obtain a high quality P-product that can be used for fertilizer production. This research is part of the PhosForYou (P4Y) project. In the first phase, experiments are being conducted at lab scale to optimize the individual unit operations. The method of cascaded option trees is used for designing and improving the process, which al-lows systematic bookkeeping of the various op-tions available and keeping track of the feasibil-ity test with respect to the critical criteria.
Fig. 1: Simplified process flowsheet of PULSE process
In the second phase, the process will be demon-strated with a pilot plant. The pilot plant is de-signed to have a capacity of treating 100kg of dewatered sludge per day and will be tested at four wastewater treatment plants in Belgium, Germany, Ireland, and Scotland.
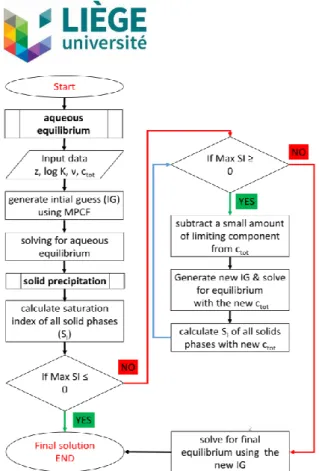
Solid-liquid equilibrium (SLE) modelling As the composition of wastewater and thus of sludge varies from one location to another and also from season to season, the operating con-ditions of the PULSE demonstrator will have to be optimized for individual situations. In the PULSE process, the most important operational parameter for the unit operations leaching, re-active extraction, and precipitation is the pH. The pH controls the types of ions or complexes that exist in a solution and the species that will precipitate at equilibrium, knowledge of which is critical to optimize the PULSE process opera-tion. Therefore, a model was developed in MATLAB in order to simulate the SLE based on the solution pH as shown in Fig. 2. The activities of aqueous ions or complexes in a solution are governed by the laws of mass action (LMA), the mass balances (MB) and the charge balance (CB). A non-ideal solution due the interaction between ions is assumed. The most common activity-coefficient model is the Debye-Hückel model and its variations which are mostly de-pendent on the ionic strength of the solution. In the current SLE model, two variations of DH model i.e. the Davies and Truesdell-Jones model are implemented. These models can be used to calculate ion activity in solutions with ionic strengths up to 1 mol/L.
The activities of ions or species in solution is de-termined by solving the non-linear system of equations of LMA, MB and CB. The MATLAB inbuilt function ‘fsolve’ is used to solve these equations. Like most of the second order nu-merical iterative methods, fsolve requires a good initial guess (IG). The IG in the model is generated by a first order iterative method called the ‘positive continuous fraction (PCF)’ (Carrayrou , Mosé , & Behra, 2002). A modifica-tion is made to this method, then referred to as MPCF. For calculation of the IG, ideal solution is assumed. After the IG has been obtained, the model proceeds to calculate the ionic strength and activity coefficients of the ions in the sys-tem. These are then used to iteratively find the equilibrium activities and hence concentrations of the aqueous ions.
– 7 – Fig. 2: Flowchart for the MATLAB aqueous
speciation model
Once the activities of the aqueous ions have been determined, the next step is to check, if any solids are precipitating. Precipitation of a species depends on super-saturation of the so-lution, which is governed by the saturations in-dex (𝑆𝐼).
𝑆𝐼 = 𝑙𝑜𝑔
𝐼𝐴𝑃 𝐾𝑠𝑝
Here, 𝐼𝐴𝑃is the free ion activity product and 𝐾𝑠𝑝
is the solubility product of the precipitating spe-cies. It is known that the thermodynamic driving force for a chemical process is the change of Gibbs free energy 𝛥𝐺 , which for precipitation becomes
𝛥𝐺 = −𝑅𝑇 𝑛 𝑙𝑛
𝐼𝐴𝑃 𝐾𝑠𝑝
Here 𝑅 is the ideal gas constant, 𝑇 is the abso-lute temperature, and n is the number of ions in the precipitated species. The 𝑆𝐼 then
character-izes the situation with respect to the solid-liquid equilibrium as indicated in Tab. 1.
In the next step, the code iteratively calculates the IG for the precipitated solid which has the highest SI. This is achieved by subtracting small
amounts of the limiting component, mimicking its removal by precipitation of that component, until the 𝑆𝐼= 0. The same procedure is repeated
until the 𝑆𝐼 of all the potential solids considered
are zero. Finally, the ultimate SLE is determined based on the generated IGs for the aqueous as well as the solid species.
𝑆𝐼= 0; 𝛥𝐺 = 0 solution is in equilibrium
𝑆𝐼 < 0; 𝛥𝐺 > 0 solution is homogeneous,
no precipitation possible 𝑆𝐼 > 0; 𝛥𝐺 < 0 solution is supersaturated,
precipitation occurs
Tab. 1: The solubility index characterizes the precipitation equilibrium
An example of the SLE simulation carried out using the developed MATLAB code for the sim-ple system of aluminum-iron-HCl is shown in Fig. 3. A total of 19 aqueous species and two solid precipitates were considered in this exam-ple, but only the major species are shown for clarity. The information from this simulation can be used for optimization of leaching, extraction, and precipitation steps. The current model will further be developed integrate the individual unit operations into a single process in Simulink.
Fig. 3: SLE of Al3+-Fe3+-HCl as a function of
pH, total c: Fe = .1 mol/L, Al = .1 mol/L, HCl = 1 mol/L to 10-06 mol/L
References
Carrayrou, J., Mosé, R., & Behra, P. (2002). New efficient algorithm for solving thermody-namic chemistry. AIChE, 894-904.
For further questions and comments, please contact: Zaheer Shariff phone: +32 (0) 4 366-3686 [email protected] 0 1 2 3 4 5 6 7 1E-6 1E-5 1E-4 1E-3 0.01 0.1 1 FeCl3 FeCl2+ Fe3+ Fe2OH24+ AlOH2+ AlOH2+ Al3+ Al(OH)3 Fe(OH)3 FeOH2+ FeOH2+ FeCl2+ con cen tra tion mo l/L pH H+
– 8 –
Potential for Phosphorus Recovery
in Southern Vietnam
Khang Vu Dinh
Introduction to potential sources of wastefor phosphorus recovery
Southern Vietnam consists of two main areas: Southeast and Mekong Delta. This is where both industrial and agricultural production de-velop with Ho Chi Minh City being the most populous city with a population of nearly 8.5 million people in 2017. Potential sources for the recovery of phosphorus include: aquacul-ture, livestock, poultry farming, rubber pro-cessing, and centralized domestic wastewater treatment plant.
According to the General Statistics Office of Viet Nam, the southern region has more than 6.75 million pigs (2017). According to Vu Dinh Ton (2010), the estimated feed consumed during a fattened pig's life was about 258kg during the roughly 105 days of breeding. The amount of manure produced was 127kg. Ac-cording to Sanchez and Gonzalez (2005), total phosphorus composition in pig slurry is 0.82 g/kg. Thus total phosphorus reserves in the pig manure was 700.000 kg in 2017.
Fig. 1: Getting sediment from catfish pond in Mekong Delta, Vietnam
After the preliminary research in Ho Chi Minh City, the total phosphorus content in sludge discharged from the Binh Hung domestic wastewater treatment plant, which has a ca-pacity of 140000m3/day, was 1.53% by weight.
The organic content of the sludge is quite high, at 19.9%. Phosphorus content in this plant can be recovered maximum 600kg/day.
Similarly, the potential for phosphorus reserves from other sources will be assessed in detail over time.
Criteria for building process solutions In order to be able to formulate a P recovery solution suitable to Vietnam conditions, the cascaded option tree has been established. There are similarities in the criteria that need to be met in the cascaded option trees for imple-menting P-recovery technology in Vietnam and internationally (see also Fig. 2):
the efficiency of P recovery the cost of investment. the cost of operation.
Fig. 2: Phosphorus recovery criteria which related to Vietnam conditions
Especially the low operating costs are an im-portant consideration in Vietnam. There are many options for phosphorus recovery solu-tions. However, reducing operating costs and realizing an environmentally friendly process are very necessary and meaningful goals. Shaping the phosphorus recovery process There are many solutions to phosphorus re-covery from solid or liquid raw materials. How-ever, the solution in line with the criteria and conditions of Vietnam shall be the focus here. The phosphorus recovery process is gradually
– 9 – being established and continued updating. This process is designed not only to achieve phos-phorus recovery but also to achieve the goal of using raw materials from nature. However, the assessment of recovery efficiency and in par-ticular the feasibility of operating costs need to be carefully studied.
Fig. 3: Proposed process for phosphorus recovery
The process studied has the main goal of phosphorus recovery. Moreover, an environ-mental friendly process is desired. This can be realized by anaerobically degrading the high content of organic matter residues prior to the recovery steps. The produced biogas can then be used to generate heat energy for the sludge drying before subsequent recovery steps. Also, raw materials with natural origin as auxiliary components for P recovery process are tested such as snail shells and limestone – which are abundant raw materials in Vietnam.
Work plan 2019
In 2019, a review of the potential for phospho-rus recovery in South Vietnam will be complet-ed, which is the basis for assessing the suita-bility of technology solutions related to actual conditions in Vietnam.
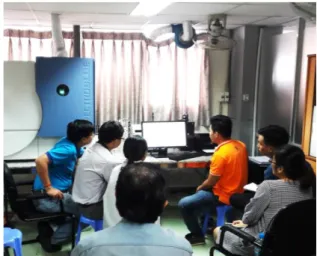
With the objective of objectivity and accuracy, MATLAB software and other simple computa-tional approaches are useful, especially for experiments involving chemical and biological reactions. The first step is to investigate the potential sources of raw materials used for the recovery of phosphorus. They include a survey of the raw materials rich in phosphorus and the source of the material that promotes the re-covery process. Moreover, research steps that
identify optimal conditions in anaerobic biodeg-radation and recovery will continue to be cau-tiously conducted in 2019. Sample analysis throughout the course of the experiment will be performed by a variety of methods. The use of ICP-OES chromatography analyzer provides great convenience and reliability as a basis for process optimization.
Fig. 4: Training course to ICP-OES operating by laboratory in Industrial University, Vietnam
Acknowledgements
This work was carried out both in Vietnam and Belgium. I am very grateful for the help and support of the laboratory of Chemical engineer-ing at ULiège and the industrial University in Vietnam. I am very happy to work in the same field with Zaheer.
References
Vu Dinh Ton, 2010: Studying on Pig manure treatment to minimize environmental pollu-tion and use bioenergy. Internapollu-tional Jour-nal of Environmental and Rural Develop-ment 1-2.
M. Sanchez, J.L. Gonzalez, 2004: The fertilizer value of pig slurry. I. Value depending on the type of operation, Bioresource Techno-logy 96, 1117-1123.
General Statistics Office of Vietnam, www.gso.gov.vn, 2017
For further questions and comments, please contact:
Khang Vu Dinh
– 10 –
Politics Misled by Unrealistic Population Scenarios
Andreas Pfennig
Since every single person has certainde-mands and requirements for food, materials, and energy, world population scales directly the total demands that need to be fulfilled on global scale. One major source for projection of world population, used by many studies, are the UN World Population Prospects (2018) (WPP). These data have also been used for own work on setting up and solving global balances more than 10 years ago. The current version of that projection is shown in Fig. 1 with its three variants. The medium variant is indicated as having the highest probability to occur, while the probabilities of the two other variants are essentially negligible, i.e. it is not to be expected that they might occur.
Fig. 1: The three variants of the UN World Population Prospects (2018)
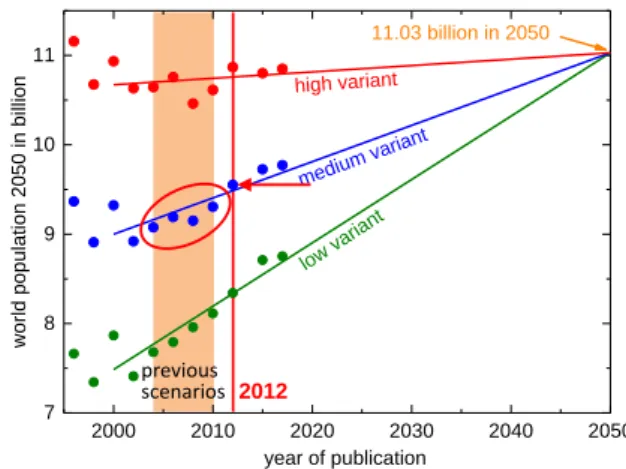
What was intriguing is the fact that apparently the behavior had changed during the last dec-ade. Since this is such a key parameter, its behavior was investigated a little more closely, as shown in Fig. 2, where the projections have been collected all referring to the year 2050, but published in different years, since the UN publishes updates roughly every two years. It is apparent that there is a clear trend in the data, especially of the low and medium variant, which – as an engineer – was approximated by a straight line. Since the world population of 2050 predicted in the year 2050 is not a projec-tion but at most an estimaprojec-tion of the real value, it can be assumed that the three lines have to meet in a single point at that year. The slopes
of the lines as well as that intersection point were fitted to the data since 2000. The result-ing intersection point is included in Fig. 1 as well, showing that – if the trend in the UN pro-jections persists – world population may even develop above the high variant.
Fig. 2: Variation of the WPP over time
Such behavior would of course significantly and continually increase the pressure on all resources, since that means that world popula-tion may continue to increase exponentially during any foreseeable time. Of course there are reasons, why the UN projections are con-tinually adjusted in upward direction:
in sub-Saharan Africa fertility did not de-crease as expected,
child survival rate increased worldwide, and the effect of HIV was less than
original-ly expected.
That these effects were not expected in previ-ous projections is of course not a fault but simply the result of the future being ‘open’. Future can very fundamentally not be predict-ed. Thus only possible futures can be de-scribed, as is usually realized via scenarios. Formally, this can be distinguished as
uncertainty, which characterizes known possible inaccuracies, the magnitude of which can typically at least be estimated, and ignorance, as technical term meaning
the unavoidable lack of knowledge, which fundamentally cannot be quantified.
1960 1980 2000 2020 2040 2060 2080 2100 0 2 4 6 8 10 12 14 my y ea r o f b irth world po pu latio n in billion year low variant medium variant high variant tod ay 11.03 billion in 2050 source: United Nations
World Population Prospect 2017 Revision 2012 previous scenarios 2000 2010 2020 2030 2040 2050 7 8 9 10 11 world popul ation 2050 i n bil lion year of publication high variant medium v ariant low v ariant 11.03 billion in 2050
– 11 – Thus, since it cannot be excluded that our increasing knowledge will proceed as in the past, the high variant of world-population pro-jections has to be regarded as a realistic op-tion, with all the detrimental consequences. In preparing a publication, literature was stud-ied on how the projections are used and dis-cussed. At that point, it became obvious that the variation over time had not been accounted for and even misinterpreted. This can best be understood, if the population projection of the IPCC (Intergovernmental Panel on Climate Change, Weltklimarat) from the fifth assess-ment report is regarded as shown in Fig. 3. Since the IPCC (2014) states that “the scenar-ios were generated by experts making in-formed judgements about how key forces might evolve in the future...”, one may reach the conclusion that experts draw a quite ho-mogeneous picture, since the 90%-range of the evaluated scenarios is rather narrow. Also, they agree that world population develops clearly below the medium variant.
Fig. 3: Population projections regarded by the IPCC (2014), the arrows and text to the right have been added to clarify How wrong this conclusion is, becomes obvi-ous, if Fig. 2 is regarded. The UN-scenarios shown in Fig. 3 are those of the year 2012. The scenarios evaluated to yield the 90%-range as indicated in Fig. 3 have been using the scenarios between 2004 and 2010, always in the medium variant. From Fig. 2 it becomes obvious that the 90%-range is so narrow, be-cause UN only slightly shifted the projections between publications. That this range lies be-low the medium variant is on the other hand solely result of using a later WPP for compari-son, which had shifted upward even further. The consequences can be seen, if the most recent IPCC report is regarded as shown in Fig. 4. Here the current so-called illustrative
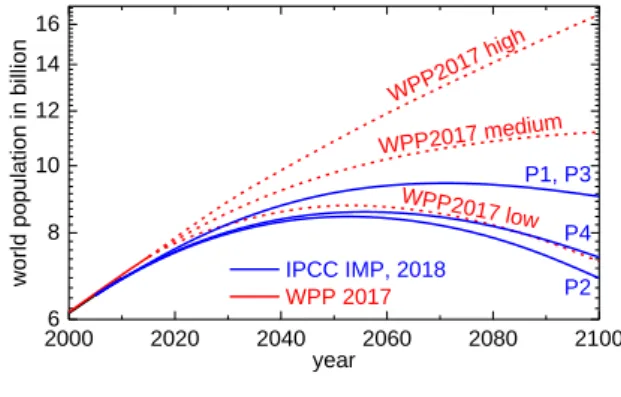
model pathways are shown in blue, which are used to derive the scenarios as basis e.g. for the climate conference in Katowice. Also in this most recent publication, basis of the IPCC special report on 1.5°C climate change pub-lished in October 2018, these P1 to P4 scenar-ios lie again below the medium variant. This is highly relevant even for the sustainable energy transition, because for most scenarios reach-ing the 1.5°C climate goal significant amounts of bio-energy are regularly included. If popula-tion develops only according to the medium variant, there will not be sufficient land area available even to feed all people, let alone, if the high variant should occur. Thus, the pro-posed energy scenarios cannot be reached and the corresponding basis for policy devel-opment unfortunately is simply wrong with all fatal resulting consequences.
Fig. 4: Comparison of blue illustrative model pathways (Huppmann, 2018) to WPP References
Huppmann, D., et al., 2018. IAMC 1.5°C Sce-nario Explorer and Data hosted by IIASA. Integrated Assessment Modeling Consorti-um & International Institute for Applied Sys-tems Analysis. https://data.ene.iiasa.ac.at/
iamc-1.5c-explorer, release 1.0
IPCC, 2014: Climate Change 2014: Mitigation of Climate Change. Contribution of Working Group III to the Fifth Assessment Report of the Intergovernmental Panel on Climate Change [Edenhofer, O., et al. (eds.)]. Cam-bridge University Press, CamCam-bridge, UK UN World Population Prospects, 2018,
https://population.un.org/wpp/.
For further questions and comments, please contact: Andreas Pfennig phone: +32 (0) 4 366-3521 [email protected] 90% of scenarios UN WPP 20006 2020 2040 2060 2080 2100 8 10 12 14 16 WPP2017 low WPP2017 medium WPP20 17 hig h P2 P4 P1, P3 world po pu lation in b illi on year IPCC IMP, 2018 WPP 2017
– 12 –
Systems View of Sustainable Economy
Andreas Pfennig
For processes in the Chemical Industry as wellas for liquid fuels, two sustainable feedstock options exist, which would be feasible in a de-carbonized economy:
bio-based feedstock
CO2 from point sources or/and the air
Today, bio-based processes are already avail-able on larger scale. Utilizing CO2 on the other
hand would have the advantage that no agri-cultural land area is required.
Agricultural land area is a scarce resource. The feedstock not only for bio-based materials but also bio-fuels and sufficient food for man-kind need to be produced. In some of the Illus-trative Model Pathways of the Intergovernmen-tal Panel on Climate Change (IPCC) (Hupp-mann, 2018) as well as in the scenarios used as basis to derive the European Sustainability Strategy, a significant increase in bio-energy is considered for fulfilling the increasing energy demand of growing world population. This induces significant additional pressure on fer-tile land area. Thus population growth, sus-tainable energy transition, bio-economy, and sufficient food supply are strongly interlinked challenges. The intensity of this interaction becomes clear, if it is recalled that compared to 1990, the reference year for many UN goals, we are today feeding 2.5 billion more people. Unfortunately world population has increased during that time by 2.3 billion, resulting in a reduction of undernourished people only by 200 million people. Thus today still more than 800 million people are undernourished.
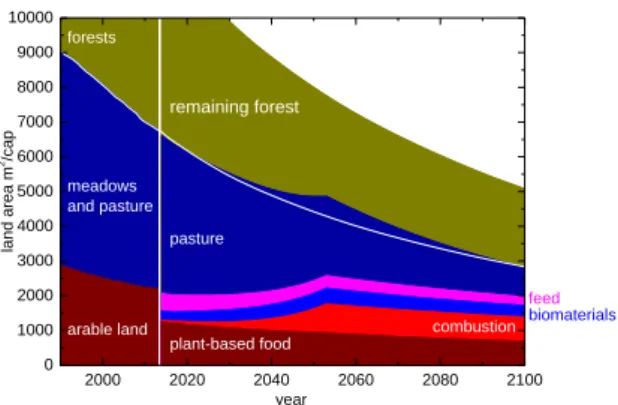
To visualize the interplay in this system of in-teractions, a variety of balances has been ap-plied and solved. A central balance is that shown in Fig. 1 for the high population variant (see previous contribution in this brochure). The land-area requirement has been charac-terized assuming a continual linear increase in land-area specific agricultural productivity and a continual intensification of animal-based food production. The white line characterizes, how agricultural land area changes only due to population growth. Overall it is obvious that the land area available per capita is quickly de-creasing, if world population is developing according to the high variant. As a
conse-quence, around 2050 we need to either further cut down forests to feed the people, or develop agricultural productivity significantly beyond the assumed maximum growth rate, which is likely to occur, or more people will remain un-dernourished. If population growth would follow the medium projection of the UN, until 2060 the land area will still be used at its limits, and only after that some area will become additionally available. Finally, if we would shift to solely plant-based nutrition, the land area for pasture and half that for feed would be freed instanta-neously for other purposes. The other half of the land for feed production would be required to produce the plant-based food replacing the fraction of animal-based nutrition.
Fig. 1: Land-area utilization for the high popu-lation variant
Thus, it becomes obvious that behavior about number of children and nutritional habits, i.e. ethics, is more important than technical as-pects, since not changing behavior will always force technology to develop at utmost rate. It is also foreseeably that in the future this may become difficult, especially, if climate change will negatively influence agriculture. Increase in bio-energy as assumed in many scenarios will increase world hunger directly as well.
It has then been evaluated, which option for a bio-based economy exist, as shown in Fig. 2. Here the land areas required to individually supply all feedstock for the Chemical Industry is described with typical land-area specific productivities. The entire range of land area shown is the agricultural land area in 2050 for
2000 2020 2040 2060 2080 2100 0 1000 2000 3000 4000 5000 6000 7000 8000 9000 10000 biomaterials combustion pasture plant-based food forests meadows and pasture lan d a re a m 2/ca p year arable land feed remaining forest
– 13 – the high population variant. It becomes clear that there exist a variety of options, where the green bars indicate those where the first steps are already today realized on technical scale. It also can be seen that solely third-generation biomass will not allow to supply sufficient feed-stock, so that competition with food production can only be minimized but not avoided.
Fig. 2: Options for a bio-based chemistry Another key graphics is shown in Fig. 3, which shows the effort to reach the climate goals, if we only start to foster sustainable energy tran-sition somewhat later. This is shown for two climate goals. The effort is characterized by the substitution rate, which specifies, which fraction of primary-energy consumption is sub-stituted by renewable energies in one respec-tive year. Obviously for reaching the 1.5°C climate goal we have already reached the steep part of the curve, meaning that every year we wait to finally significantly increase or effort starting out at a current substitution rate of roughly 0.5%/a, the required effort for reach-ing the climate goal will significantly increase. Comparing this globally required effort with the current status of how climate goals are tackled, it appears factually unrealistic that humanity is able to limit the climate change to +1.5 °C above pre-industrial level. Politicians have missed to realize that the system has shifted from the deceptive flat part of the curve into the steep section, where any further delay renders the goal increasingly unattainable. At the same time it is obvious, why reaching this conclusion is so difficult. It is apparently still possible to reach that climate goal, but the effort is quickly
increasing significantly according to the essen-tially hyperbolic function, where beyond a cer-tain point the required effort can in principle be reached but becomes practically unreachable. That economically reachable limit may lie somewhere around 3%/a substitution rate.
Fig. 3: Substitution rate that is required to reach climate goals, if we start to foster sustainable energy transition only later With such simple balances it is thus possible to clearly visualize the major interdependencies in this global system. Only, if all these aspects – and some more – are properly accounted for and managed, humanity will be able to survive in wellbeing for everybody. To describe these interdependencies, a video series has been recorded for YouTube, which can be accessed
via www.chemeng.uliege.be/successfulfuture,
and a book has been written (Pfennig, 2018), which, as already indicated on the first page of this brochure, is not an easy read, because it also works out some fundamental ideas on a corresponding ethical foundations.
References
Huppmann, D., et al., 2018. IAMC 1.5°C Sce-nario Explorer and Data hosted by IIASA. Integrated Assessment Modeling Consorti-um & International Institute for Applied Sys-tems Analysis. https://data.ene.iiasa.ac.at/
iamc-1.5c-explorer, release 1.0
Pfennig, A. 2018. So gelingt unsere Zukunft. Books on Demand, Norderstedt. ISBN:
978-3-7528-3187-0.
For further questions and comments, please contact:
Andreas Pfennig
phone: +32 (0) 4 366-3521
gen feedstock products
fi rs t g e n e ra ti o n sugar beet sugar or ethanol + CO2 ethanol ethylene
sugar cane sugar or ethanol + CO2 ethanol
corn sugar or ethanol + CO2 ethanol
wheat sugar or ethanol + CO2 ethanol
oil palm plant oil rape seed plant oil
second
miscanthus/reeds sugar or ethanol + CO2 ethanol
wood sugar or ethanol + CO2 ethanol th ir d corn straw sugar or ethanol + CO2 ethanol
wheat straw sugar or ethanol + CO2 ethanol
arable land 2050 sugar beet to sugar or EtOH + CO2
sugar beet to EtOH sugar beet to ethylene sugar cane to sugar or EtOH + CO2 sugar cane to EtOH corn to sugar or EtOH + CO2 corn to EtOH wheat to sugar or EtOH + CO 2 wheat to EtOH oil palm to plant oil rape seed to plant oil miscanthus/reeds to EtOH + CO2 miscanthus/reeds to EtOH wood to sugars or EtOH + CO2 wood to EtOH corn straw to EtOH + CO2 corn straw to EtOH wheat straw to sugar or EtOH + CO2 wheat straw to EtOH
0 500 1000 1500 area in m2/cap goal 2020 2030 2040 2050 2060 1 2 3 4 5 6 7 8 9 10 medium population variant +2.0°C minim um re qu ired sub stitut ion ra te in %/a
year of increased effort +1.5°C
high population variant
– 14 –
My time in Liège, 2018
Khang Vu Dinh
Autumn in Europe
This is the second time I have come to live in Liège for a longer time. This time, I came when the weather was going to fall. Liège had a qui-eter and more peaceful space than my hometown – Ho Chi Minh city, the busy city. Liège welcomed me with a light rain in the late afternoon. My homesickness immediately seemed to fill my mind.
Fortunately, it was just a moment. I realized that there are so many interesting things of this city I have to explore. The scenery, culture, and people of Europe are fascinating things to me when thinking of Liège. The rows of trees, leaves are turning color as saying that they are ready to receive a cold winter. Autumn in Eu-rope is beautiful, strong, and romantic.
ULiège and friendly people here
I was fortunate to study and do research at ULiège. Learning in the space covered by the forest gives me a feeling of freshness to each breath
2018 is very important year to me. I officially became a PhD student at ULiège. I see it as a landmark, an exciting start, and also a lot of challenges. In order to become a PhD student of ULiège, I first need to thank the Wallonie Bruxelles International, which has supported me financially. Thanks to Professor Celia Joaquim-Justo for helping me complete the procedure as well as helping me in my early days in Liège. I feel the warmth, dedication, and enthusiasm of most faculty and friends in the department. Professor Andreas has helped me a lot in approaching professional and effec-tive working style in scientific research. Fur-ther, I have received important comments from Professor Angelique Léonard.
Fig. 1: A meeting for discussing about Khang’s thesis proposal in October, 2018 with Profs. Angélique Léonard and Le Hung Anh
Zaheer is a good friend. He helped me during my stay in Belgium. We did not have more time to work together in the laboratory at ULiège. But the experience at the lab is wonderful. Nice to meet David and Junior. They became very sincere friends with me.
Fig. 2: Our group: let’s smile
For further questions and comments, please contact:
Khang Vu Dinh
– 15 –
Excursion to the BASF complex in Ludwigshafen
Zaheer Shariff
Every year the chemical engineeringdepart-ment at the University of Liège organizes an ex-cursion for the first year engineering students to a selected company, so that the students get a firsthand experience of the different engineering domains, which will assist them in choosing their field of specialization. This year I had the opportunity of participating in the excursion to the BASF site in Ludwigshafen, Germany, which is not only the headquarters of BASF but also the world’s largest integrated chemical complex spreading over an area of about ten square kilometers. A total of 28 students and 3 faculty members participated in the excursion. The journey from Liège to BASF took approxi-mately four hours. The group arrived at the BASF visitor center at 10:00 am. The excursion was divided into three parts starting with a tour of the visitor center, visit to the acrylic mono-mers production site and finally interaction with representatives from process development and human resource department about their entry into BASF and their work.
The BASF visitor center is an exhibition area of about 2000 m2, which gives an insight into
chemistry using examples of the products and process that we use in our daily life. It also showcases some of the latest technological de-velopments e.g. in the fields of 3D printing and mobility, demonstrating how chemistry contrib-utes to latest advancements. The group was given a guided tour of the visitor center explain-ing how BASF makes use of simple raw materi-als such naphtha, natural gas, oil, water and air to produce thousands of chemicals and chemi-cal products.
Fig. 1: ULiège group at BASF visitor center
Then, a brief introduction was given as to how BASF is adopting sustainable development and moving towards implementation of industry 4.0. The entire BASF chemical complex is synergis-tically planned such that the by-products of one process can be used as input to another pro-cess, thereby reducing wasting of resources, energy, and logistical costs. The chemical com-plex is a city in itself with several amenities for employees like dry cleaning, salon, and fitness center on site, also there are several bus lines to transport the employees within the complex. After the tour of the visitor center, the group was invited for a sumptuous lunch at the central can-teen on the chemical complex, the Red Ox. After lunch, the student group visited the acrylic production site, which is situated at the center of BASF. The visit started with a brief presenta-tion about the producpresenta-tion of acrylic acid and the monomers followed by a tour of the plant. It was an excellent experience for the group to see the life size reactors, evaporators, extraction col-umns and other equipment. The highest plat-form at about 32 meters near the extraction col-umn gave a splendid view of the entire area. The excursion concluded with presentations and interaction with the representatives of BASF. The representatives of BASF spoke about their journey as to how they came to work at BASF starting from their choice of studies and interviews to their current portfolios. Further a representative of the HR department explained the opportunities for student internships and dif-ferent ways of starting at BASF and also the var-ious levels of hierarchy at the company. Acknowledgements
We are thankful to Dr.-Ing. Florian Buchbender, a former member of the Pfennig group now working at BASF, for the organization and plan-ning of the excursion, and our dean’s office for the organization on ULiège side.
For further questions and comments, please contact:
Zaheer Shariff
phone: +32 (0) 4 366-3686
– 16 –
Group Outing: Surrounding the Lake of Eupen
David Leleu
On 11th of August, our group went to anexcur-sion around the water reservoir of Eupen for the annual group outing. The lake of Eupen is lo-cated 50 km from the University of Liège and is actually a water reserve of 25 million of cubic meter of drinking water. The lake is located at the border of the highest plateau of Belgium called the “Hautes Fagnes”. The soil of the re-gion has the particularity to be rich in Iron. It af-fects the taste of the treated drinking water and gives a reddish color to the water of the lake. The latter is surrounded by forests with a variety of trees and bushes. This makes the perfect place for a group outing. The goal of the day was to walk around the lake for a total of 14.5 km.
Zaheer with his family, Junior, and I, joined by Andreas and his wife, Claudia, drove until the barrage to begin our journey at the top of the dam.
Four hours of walking during a cloudy, half-sunny afternoon were necessary to complete the surrounding. We enjoyed the crossing of hardwood and pines forests with a nice view on the lake. We saw several flowering bushes and we also got experience on wild fruits, like ber-ries, and flowers picking. Unfortunately, we were not able to observe animals even if deer’s and boar are present in the woods surrounding the lake.
Around the lake, there are several rivers which feed the reservoir. One of them was the perfect place for a break with a short snack, as shown in the picture.
The group outing gave us the opportunity to meet in a relaxing environment and to learn to know each other better.
My wife joined us at the end of the day at An-dreas’ home. We enjoyed a vegan menu, cooked by Andreas and his wife. To the menu: zucchini soup, falafel with vegetables and choc-olate mousse. The night was complemented by relaxing chatting.
For further questions and comments, please contact:
David Leleu
phone: +32 (0) 4 366-3521
– 17 –
Schnaps on YouTube
Andreas Pfennig
Meanwhile the production of schnaps has beenrealized more than twenty times to apply Chemical Engineering knowledge to a useful example together with students. Also this year schnaps has again been produced, where the students decided to use apples as raw materi-al. This time, the duties of the students were slightly extended, since the documentation should not only be realized as website as in the last years, but also as video. The video production itself was supported by the commu-nications department, specifically Mr. Remy Hespel, who made several interviews with the students and participated in a variety of meet-ings as well as in the excursion to a local dis-tillery. He also produced the final video, which very nicely combines several layers of infor-mation:
it is a serious task to apply Chemical Engi-neering expertise designing and operating a specific process, even schnaps production, the objectives and applications of Chemical
Engineering in general,
and that it can be fun to realize a process practically.
This video even made it to the front page of the ULiège website in the news section! And here it is finally, the link to the video:
www.youtube.com/watch?v=Hff15tZTEv8.
The report on the schnaps project is of course again the website that was created by the stu-dents, including all relevant information:
www.chemeng.uliege.be/schnapps.
Finally of course the statement should not be missing that also this year the quality of the final product has been excellent, which of course influenced the grade for the course. The grade on the other hand includes also a certain fraction of mutual self-evaluation among the students, which allows to slightly reward students, who are getting highly in-volved and who work reliably as seen by their colleagues. The schnaps project, which is elec-tive in the Bachelor curriculum, will thus again be realized in the following semester. The number of students has been continually in-creasing and will be 22 for the new project starting in February.
For further questions and comments, please contact:
Andreas Pfennig
phone: +32 (0) 4 366-3521
– 18 –
Cookies and X-Mas Lecture
Andreas Pfennig
For the second year the regular events thatwere a tradition in my previous affiliations have now been re-established, namely the baking of Christmas cookies and the Christmas lecture. The Christmas cookies that were selected are Chocolate Brownies,
Vanillekipferl,
Kokosbusserl, coconut macaroon, and Florentiner.
This year we were supported also by Martine Lovato, one of the secretaries of the depart-ment. The difficulty to find appropriate transla-tions into English shows already that baking of cookies for Christmas is apparently a tradition with local boundaries. Already in Austria, the names differ, while the types of cookies are rather similar to German traditions. Thus a German ‘Kokosmakrone’ is ‘Kokosbusserl’ in Austrian, where ‘Busserl’ means little kiss. There are additional quite subtle differences between Germany and Austria in the cookies tradition. While in Germany the cookies – at least those the author knows – have a decent size, in Austria, the housewife (sorry, but I have not met other men, who exchanged their views on making Christmas cookies) seeks to make Christmas cookies as small and elegant as possible.
Our cookies are then part of the Christmas atmosphere, which we try to induce at least a little bit during the Christmas lecture, in which the group members present their research in general terms together with some aspects of the latest findings. This is one aspect to show a little that Chemical Engineering is not just the professor teaching the subject, but that there is on-going research behind it. Also this lecture is the opportunity to get into contact with the students and exchange e.g. about the Christ-mas traditions. In Belgium, ChristChrist-mas cookies are essentially unknown – at least in Wallonia. The students agreed that there is only one local traditional Christmas cake, namely Bûche de Noël. This is a biscuit roll with a chocolate cream filling, which is decorated to closely resemble the trunk of a tree. Of course there are also common traditions between countries, like Glühwein, which in French is simply and very unromantically called vin chaud, which is of course also offered at the Christmas lecture.
If there are cookies left over, these are then contributed to the department Christmas lunch, which until now still is called such, where I remember that in Germany more than ten years ago there were already heavy discus-sions on how to call this event in a multi-cultural globalized environment.
For further questions and comments, please contact:
Andreas Pfennig
phone: +32 (0) 4 366-3521
plates with our cookies at the department Christmas lunch
– 19 –
Teaching in Oman and Thailand
Andreas Pfennig
As already during many years meanwhile,lectures have been given in Oman and Bang-kok. At GUtech in Oman the lecture is the basic lecture on separation processes, at TGGS in Bangkok it has been the advanced lecture on process intensification and hybrid processes. Even though the time of the stays is always short, due to the intense interaction during the block course a rather intense inter-action with the students is regularly achieved, which is a good basis for a fruitful transfer of knowledge. Due to the different background in each country there are also challenges to be mastered, e.g., if the students don’t know the ternary diagram from thermodynamics, which is required to present the Hunter-Nash method for extraction. But meanwhile this does not come as a surprise any more, so that suitable chapters have been introduced and a corre-sponding YouTube video has been prepared. A very special event during these courses was the visit to ‘The Vegetarian Cottage’, where traditional Thai food is served, but everything is purely vegan. What a delight! The photos may tell more than 1000 words.
For further questions and comments, please contact:
Andreas Pfennig
phone: +32 (0) 4 366-3521
– 20 – An up to date list of publications is available at:
https://orbi.uliege.be/ph-search?uid=U222548
Publications
Pfennig, A. (2018). On the strong influence of molecular interactions over large distances.
European Physical Journal D. 72(March,
paper 45), 1-8.
Wallek, T., Mayer, C., & Pfennig, A. (2018). Discrete Modeling Approach as a Basis of Excess Gibbs-Energy Models for Chemical Engineering Applications. Industrial and Engineering Chemistry Research, 57(4),
1294-1306.
Pfennig, A. (2018). So gelingt unsere Zukunft. Norderstedt, Germany: Books on Demand. Leleu, D., & Pfennig, A. (in press). Drop-Based
Modelling of Extraction Equipment. In B. A., Moyer, Ion Exchange and Solvent Extrac-tion, Vol. 23: Changing the Landscape in
Solvent Extraction. Boca Raton, FL 33487:
CRC Press.
Mohammadi Sarab Badieh, M., Quaresima, M.C., Pfennig, A., Saien, J. (2017): Perfor-mance study of ionic liquid in extraction based on single-drop experiments. Solvent
Extraction and Ion Exchange, 35, 563-572.
Léonard, G., Pfennig, A., Dilan Celebi, A., Sharma, S., Maréchal, F. (2017): 14. Indus-trial Integration of Biotechnological Pro-cesses from Raw Material to Energy Inte-gration: Study by Modeling Approach. In: Darvishi Harzevili, F., Hiligsmann, S. (Eds.): Microbial Fuels: Technologies and Applica-tions. CRC Press, Taylor&Francis.
Leis, D., Lauß, B., Macher-Ambrosch, R., Pfennig, A., Nidetzky, B. & Kratzer, R. (2017) Integration of whole-cell reaction and product isolation: Highly hydrophobic solvents promote in situ substrate supply and simplify extractive product isolation.
Journal of Biotechnology, 257, 110-117.
Reiter, A., Schubert, N., Pfennig, A., Wallek, T. (2017): Surrogate Generation and Evalua-tion for Biodiesel and Its Mixtures with Fos-sil Diesel. Energy & Fuels, 31, 6173-6181. Bednarz, A., Spieß, A.C., Pfennig, A. (2017):
Reactive and physical extraction of bio-based diamines from fermentation media.
Journal of Chemical Technology &
Biotech-nology, 92, 1817-1824.
Bednarz, A., Scherübel, P., Spieß, A., Pfennig, A. (2017): Optimization of settling behavior for an efficient solvent-extraction process for bio-based components. Chemical Engi-neering and Technology 40(10),
1852-1860.
Kopriwa, N., & Pfennig, A. (2016). Characteri-zation of Coalescence in Extraction Equip-ment Based on Lab-Scale ExperiEquip-ments.
Solvent Extraction & Ion Exchange, 34(7),
622-642.
Erhardt, F., Haas, T., Roos, D., Poetter, M., Schubert, A., Pfeffer, J. C., Tacke, T., Hae-ger, H., Pfennig, A., & Przybylski-Freund, M.-D. (2016). Liquid Cation Exchanger. United States: US 9,315,443 B2, United States Patent and Trademark Office.
Wallek, T., Pfleger, M., & Pfennig, A. (2016). Discrete Modeling of Lattice Systems: The Concept of Shannon Entropy Applied to Strongly Interacting Systems. Industrial & Engineering Chemistry Research, 55(8),
2483-2492.
Pfleger, M., Wallek, T., & Pfennig, A. (2015). Discrete Modeling: Thermodynamics Based on Shannon Entropy and Discrete States of Molecules. Industrial and Engineering
Chemistry, 54, 4643-4654.
Ayesterán, J., Kopriwa, N., Buchbender, F., Kalem, M., & Pfennig, A. (2015). ReDrop – A Simulation Tool for the Design of Extrac-tion Columns Based on Single-Drop Exper-iments. Chemical Engineering and
Tech-nology, 38(10), 1894-1900.
Reiter, A. M., Wallek, T., Pfennig, A., & Zey-mer, M. (2015). Surrogate Generation and Evaluation for Diesel Fuel. Energy & Fuels,
29, 4181-4192.
Bednarz, A., Rüngeler, B., & Pfennig, A. (2014). Use of Cascaded Option Trees in Chemical-Engineering Process Develop-ment. Chemie Ingenieur Technik, 86(5), 611-620.
Frenzel, P., & Pfennig, A. (2014). Bewertung der steigenden Nachfrage nach Diesel-Kraftstoffen hinsichtlich ihrer
CO2-Emissionen. In U., Bachhiesl (Ed.), Innehal-ten und Ausblick: Effektivität und Effizienz für die Energiewende (pp. 1-9).
– 21 – Frenzel, P., Hillerbrand, R., & Pfennig, A.
(2014). Exergetical Evaluation of Biobased Synthesis Pathways. Polymers, 6(2), 327-345.
Frenzel, P., Hillerbrand, R., & Pfennig, A. (2014). Increase in energy and land use by a bio-based chemical industry. Chemical Engineering Research and Design, 92, 2006-2015.
Presentations
Pfennig, A. (2018). So gelingt unsere Zukunft.
Greenpeace Aachen, Aachen, Germany.
Leleu, D., & Pfennig, A. (2018). Drop-Based Modelling of Coalescence in Batch Settlers Including Polydispersity. 8th International Berlin Workshop (IBW 8) on Transport Phenomena with Moving Boundaries,
Ber-lin, Germany.
Pfennig, A. (2018). Bio-Ökonomie: Chancen, Risiken und Blick auf das Gesamtsystem.
ProcessNet-Jahrestagung und 33. DECHEMA-Jahrestagung der
Biotech-nologen, Aachen, Germany.
Charlafti, E., Leleu, D., Steinhoff, J., Reinecke, L., Bart, H.-J., Pfennig, A., & Kraume, M. (2018). Separation efficiency and design optimization of gravity settlers – CFD mod-eling and experimental investigation. Pro-cessNet-Jahrestagung und 33. DECHEMA-Jahrestagung der Biotechnologen, Aachen,
Germany.
Leleu, D., & Pfennig, A. (2018). Considering polydispersity and new coalescence models in the description of separators.
Jahrestreffen der ProcessNet Fachgruppen Extraktion und Rohstoffe, Frankfurt,
Ger-many.
Leleu, D., & Pfennig, A. (2018). Standardized Settling Cell to Characterize Liquid-Liquid Dispersion. Jahrestreffen der ProcessNet Fachgruppen Extraktion und Rohstoffe,
Frankfurt, Germany.
Mayer, C., Pfennig, A., & Wallek, T. (2018). A discrete modeling approach for excess Gibbs-energy models based on discrete Markov-chains. 23rd International Congress of Chemical and Process Engineering
CHI-SA 2018 Prague, Prague, Czech Republic.
Pfennig, A., & Shariff, Z. A. (2017). Phospho-rous from Sludge: Extraction Expertise at ULiège. Poster presented at European
Nu-trient Event, Basel, Switzerland.
Leleu, D., Pfennig, A. (2017): Standardized Settling Cell to Characterize Liquid-Liquid Dispersion. ISEC 2017, 5.-9.11.2017, Miya-zaki, Japan.
Leleu, D., Pfennig, A., Bruns, N. (2017): Coa-lescence in Highly Viscous System. ISEC 2017, 5.-9.11.2017, Miyazaki, Japan. Bednarz, A., Scherübel, P., Spieß, A., Pfennig,
A. (2017): Aerated Extraction Column for Reactive Extraction from Fermentation Broth. ISEC 2017, 5.-9.11.2017, Miyazaki, Japan.
Quaresima, M.C., Schmidt, M., Pfennig, A. (2017): Solvent Extraction Design for Highly Viscous Systems. ISEC 2017, 5.-9.11.2017, Miyazaki, Japan.
Ayesterán Jerez, J.M., Buchbender, F., Kalem, M., Kalvoda, E., Pfennig, A. (2017): Single-Drop Experiments for Challenging Condi-tions as Basis for Extraction-Column Simu-lations. ISEC 2017, 5.-9.11.2017, Miyazaki, Japan.
Pfennig, A. (2017): Tutorial Videos on Solvent Extraction. ISEC 2017, 5.-9.11.2017, Miya-zaki, Japan.
Pfennig, A. (2017): Systematic Downstream Process Development for Biobased Chemi-cals and Fuels. 16ème Congrès de la So-ciété Française de Génie des Procédés, 11.-13.07.2017, Nancy, France.
Leleu, D., Pfennig, A. (2017): Standardized Settling Cell Design. 16ème Congrès de la Société Française de Génie des Procédés, 11.-13.07.2017, Nancy, France.
Quaresima, M.C., Pfennig, A. (2017): Extrac-tion Column Design for Highly Viscous Sys-tems. 16ème Congrès de la Société Fran-çaise de Génie des Procédés, 11.-13.07.2017, Nancy, France.
Pfennig, A.: Biobased Processes: Systemati-cally Evaluating Chances and Challenges. 1st BioSC Symposium: Towards an In-tegrated Bioeconomy, 21.11.2016, Colog-ne, Germany.
Leleu, D., Pfennig, A. (2017): Standardized Settling Cell Design. Jahrestreffen der Pro-cessNet Fachgruppen Mechanische Flüs-sigkeitsabtrennung, Kristallisation, Phytoex-trakte, Adsorption, Extraktion, Fluidverfah-renstechnik und Membrantechnik, 06.-10.03.2017, Cologne, Germany.
– 22 –
A Last Word
an undisclosed student
Explain briefly how absorption works.