RESPONSE ORDER EFFECTS IN
DICHOTOMOUS VOTING INTENTION QUESTIONS Evidence from the 2008 US presidential election
Mémoire présenté
à la Faculté des études supérieures de l'Université Laval
dans le cadre du programme de maîtrise en analyse des politiques publiques pour l'obtention du grade de maître es arts (M.A.)
DEPARTEMENT DE SCIENCE POLITIQUE FACULTÉ DES SCIENCES SOCIALES
UNIVERSITÉ LAVAL QUÉBEC
2010
My Master's thesis verifies if respondents to dichotomous voting intention questions asked during telephone interviews are influenced by the ordering of candidates. The most appealing theory, satisficing theory, predicts that respondents are not affected by candidates' ordering. My thesis aims at testing this "no-effect" hypothesis. I elaborate the tug-of-war framework, an analogy that distinguishes six scenarios eventually hidden behind the measured effects. Two of them correspond to the no-effect hypothesis. The research design consists in eliminating rival scenarios until only these two scenarios remain. Data on candidate rotation during the 2008 presidential campaign are extracted from the Roper Center Databank. Experiment 1 presents a meta-analysis of response order effects in 53 voting intention questions. Three rival scenarios are eliminated. Experiment 2 confirms that most of the variance in measured effects is actually due to random imbalance of supporters in split-samples, eliminating the remaining rival scenario. This test fails to reject the no-effect hypothesis.
Résumé
Mon mémoire vérifie si les répondants aux questions d'intentions de vote dichotomiques posées par questionnaires téléphoniques sont influencés par l'ordre de présentation des candidats. La théorie du contentement prédit l'absence d'effet d'ordre. Mon mémoire teste cette hypothèse de «non-effet». J'élabore le cadre d'analyse du tir à la corde, distinguant six scénarios éventuellement cachés derrière les effets mesurés. Deux scénarios correspondent à mon hypothèse. Ma stratégie de recherche consiste à éliminer les scénarios rivaux jusqu'à ce qu'il ne reste que les deux scénarios de non-effet. Les intentions de vote de la campagne présidentielle américaine de 2008 sont extraites du Roper Center. L'expérience 1 effectue une méta-analyse des effets d'ordres dans 53 questions. Trois scénarios rivaux sont éliminés. L'expérience 2 confirme que les effets mesurés sont dus à des divisions légèrement asymétriques des échantillons lors de la rotation aléatoire des candidats, éliminant le dernier scénario rival. Ce test échoue à rejeter l'hypothèse de non-effet.
Remerciements
La rédaction de ce mémoire a été un travail de longue haleine. Au cours des deux dernières années, plusieurs personnes y ont contribué, et ce, de différentes façons et à différents moments. Je dois d'abord remercier mes parents et mon frère qui, du début à la fin, m'ont encouragé et soutenu. Savoir terminer ce que l'on entreprend, certes, mais ne pas terminer avant d'être bien fier du résultat : voilà ce que ma famille m'a appris.
Je remercie également mon directeur de maîtrise, Professeur François Pétry, ainsi que mon codirecteur, Professeur François Gélineau. Leurs conseils, leur patience, leur immense disponibilité ainsi que leur professionnalisme m'ont apporté de l'aide, de la motivation et de l'inspiration. C'est d'abord en m'embauchant comme auxiliaire de recherche que ces professeurs ont su me transmettre la passion pour la recherche et je leur en suis très reconnaissant. Je tiens également à souligner que plusieurs professeurs ont contribué à mes réflexions lors de divers échanges. Leur accueil et ouverture d'esprit est caractéristique du département de science politique de l'Université Laval.
Finalement, mes remerciements se tournent vers mes amis étudiants et collègues de travail. Faute de tous les nommer, je me dois certainement de remercier et saluer Martin Cossette, Jean-François Bélanger, Sébastien Marcoux, Pierre-Marc Daigneault, Jérôme Couture, Lisa Maureen-Birch et Benoît Collette. Partager avec vous ces années à l'Université Laval fut un grand plaisir. De belles amitiés sont maintenant scellées.
Contents
Summary I Résumé II Remerciements Ill Contents IV List of Tables V List of Figures V Introduction 1 Chapter 1. Theories and Hypotheses 71.1 The Lack of Crystallization Hypothesis 9
1.2 Satisficing Theory 10 1.3 Memory Limitation Hypothesis 14
1.4 Elaboration Likelihood Models 15
1.5 Conclusion 18 Chapter 2. Theoretical Framework 20
2.1 Measurement Issues 21 2.2 The Tug-of-War Framework 25
Chapter 3. Research Design 28
3.1 Step 1 29 3.2 Step 2 32 Chapter 4. Data Collection: A Systematic Review 37
4.1 Survey Inclusion Criteria 38
4.2 Findings 40 4.3 Questionnaire Context 42
Chapter 5. Experiment 1: The Meta-Analysis 45
5.1 Experimental Design 47
5.2 Results 49 5.3 Discussion 53 Chapter 6. Experiment 2: Response Order Effects and Chance Bias 55
6.1 Experimental Design 57
6.2 Results 61 6.3 Discussion 62 Discussion and Conclusion 64
Bibliography 69 Appendix 1 75 Appendix 2 76
Table 1. Two-by-two Rotation Table 22 Table 2. Table of Party Identification by the Rotation Variable 35
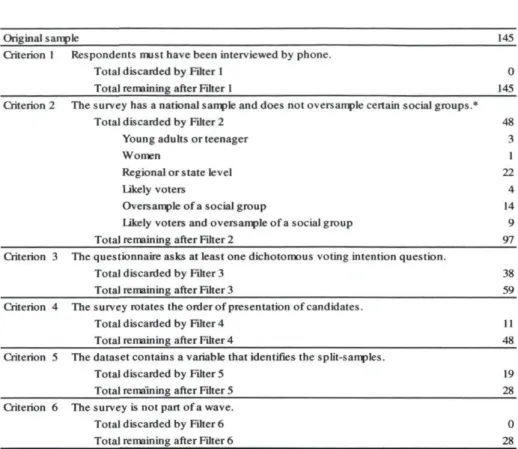
Table 3. Dataset Filtering Process 41 Table 4. Voting Intention Questions and Pairs of Candidates 41
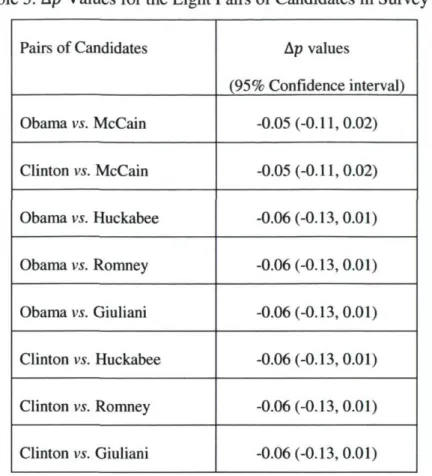
Table 5. Ap Values for the Height Pairs of Candidates in Survey 28 54
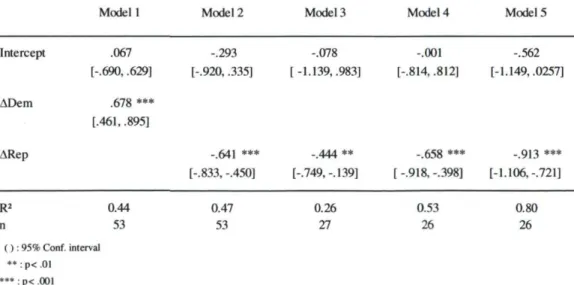
Table 6. Models Predicting Ap with ADem and ARep 61
List of Figures
Figure 1. The Tug-of-war Framework 26 Figure 2. Meta-analysis of Response Order Effects 50
Voting intentions published during American presidential elections are among the most publicized poll results in the world. The great majority of voting intention questions is sponsored by media firms to follow trends as part of their campaign coverage. Throughout the election year, commentators use survey results to compare how candidates from different parties are succeeding or failing at attracting the support of the electorate (CNN.com, 2008). The media also use survey results to speculate on which pair of candidates will provide the closest race. During the primaries, recording voting intentions is a way to assess which of the Democratic and Republican candidates are apparently more "electable", that is, more likely to defeat the candidate of the opposing party (Toner & Sussman, 2008). If it is well known that voting intentions are consulted by journalists and analysts, it is important not to forget that candidates' strategists follow public opinion at least as closely. Spin doctors may adapt a candidate's communication strategy according to trends. Changes in voting intentions are also a way to evaluate the success or failure of an ongoing strategy (Rollins & DeFrank, 1996).
So, media firms and spin doctors are the main consumers of voting intentions. To make a good coverage or to orient their candidates toward the best strategies, these professionals must pay great attention to the interpretation of survey results. Confidence intervals usually accompany pollsters' reports and allow statistical assessment of the degree of confidence one can have in the results, assuming the error of measurement is normally distributed. But voting intentions are not immune to larger and systematic errors which can bias results and therefore jeopardize professionals' work. For the spin doctor, the intrusion of biases in survey results may cause misinterpretations such as whether a candidate has a comfortable lead toward the opponent or if he is far behind. Such misinterpretations may bring about a wrong assessment of the risks and benefits associated with one strategy or another. For the journalist, biases in voting intention questions may lead to wrong interpretations of the trends in public opinion. Whether or not the divulgation of poll results by media influences voters' choices is the subject of different theories (Irwin & Van Holsteyn, 2000) and apparently depends on the specific context of an election (Durand & Goyder, 2008). But it could convincingly be argued that biased poll results could deceive
intentions becomes an issue that merits closer attention. The general research question of this thesis is:
Do voting intention questions accurately measure public opinion?
To answer this question, we must turn to elements of survey methodology.
The literature on survey errors classifies possible biases into two main categories. The first category concerns sampling bias. A sampling bias occurs when the sample of respondents who answer a survey is not representative of the targeted population. Consequently, results from a non representative sample provide a wrong interpretation of public opinion when they are generalized to the population. Adapted sampling strategies and data weightings have been developed to minimize sampling bias. If some authors suggest that these solutions are sufficient to reach a satisfying level of validity (Crespi, 1988; Warren, 2001), this view that sampling strategies are accurate is not unanimous (Erikson and Wlezien, 1999: p. 175). Although the issue of sampling bias has not been completely resolved, the ways by which this category of error may affect results from voting intention questions have received important coverage in the scientific literature. This thesis turns instead to another category of error, namely context effects, which have received less scholarly attention.
Context effects occur when elements from the context of a question (i.e. question wording, question ordering, question length, location in a questionnaire, response ordering, interviewer's attributes, etc.) have an influence on the respondent's cognitive processes and therefore systematically bias results (Tourangeau & Rasinski, 2000). In some instances, concerns were expressed about how context effects might bias responses to voting intention questions. During the 2008 presidential election in United States, scholars and pollsters were concerned by the so-called "Bradley effect". This interviewer effect captures a social pressure that pushes white respondents to report support for a black candidate solely to
overestimate the support for the black candidate (Keeter, Kiley, Christian & Dimock, 2009).
Another kind of context effect that has received a lot of attention in the literature is response order effect. A response order effect occurs "if the order in which alternatives are read influences choices" (Schuman & Presser, 1996: p.56). Two kinds of response order effects are possible. A primacy effect occurs if response items are more likely to be selected when presented first. Conversely, a recency effect is present when response items are systematically more likely to be selected when presented last.
The literature looks into response order effects on questions concerning moral judgments among children (Surber, 1982), links in websites and emails (Murphy, Hofacker & Mizerski, 2006; Ansari & Mela, 2003; Smyth, Dillman, Christian & Stern, 2006), the most important problems facing the country (Johnson, O'Rourke & Severns, 1998; Mitofski & Edelman, 1995), government responsibilities (McClendon, 1986), electoral ballots (Ho & Imai, 2008), qualities parents would like their children to have (Duffy, 2003; Krosnick & Alwin, 1987; Krosnick, 1991a), decision making by auditors in firms (Ahlawat, 1999), juror interpretation (Kassin, Reddy & Tulloch, 1990), preferences in wine tasting (Mantonakis Todero, Lesschaeve & Hastie, 2009) and so on (Moore, 2008: p. 156; Moore & Newport, 1996).
Surprisingly, the occurrence of response order effects on voting intention questions has received very little attention, and the few efforts at exploring them indicate conflicting conclusions. Some of the response order effects reported by Bishop and Smith (2001) were measured on voting intention questions. These effects were so small in size that they were not significantly different from zero, suggesting that respondents are not affected by response ordering.
of March and the end of May and merge results from dichotomous voting intention questions asked a survey firm which rotates candidates. The authors also merge results from surveys which asked Gore first and Bush second and then compare the aggregated percentages of support among surveys firms that rotate candidates with those that do not. McDermott and Frankovic find that "Gore does significantly better [two percentage points] when he is always asked first than when neither candidate is, in effect, asked first", thus revealing a primacy effect. The authors conclude that "rotating candidate names would be the most prudent method for pollsters, even in two-candidate races".
These articles are the only two sources of information I have found on the subject and, in fact, in both articles, the occurrence of response order effects in voting intention questions was a concern among others. To date, the issue of whether respondents to voting intention questions are influenced by candidates ordering remains open. This thesis attempts to fill this knowledge gap and tries to answer the following specific research question:
Are dichotomous voting intention questions asked during telephone interviews subject to response order effects?
Although it is now well known that response ordering may have an influence on respondent's cognitive processes, some survey firms continue to not rotate the candidates' order of presentation (McDermott and Frankovic, 2003). Concluding that voting intention questions are affected by response ordering would exert a strong pressure on the polling industry to bring their practices in line with the standard. Conversely, if results to voting intention questions are not affected by the ordering of candidates, it would be more difficult to criticize survey firms for not rotating response order.
This question also has a strong scientific relevance. The determinants of response order effects - and of context effects in general - are still a subject of debate after decades
span of possible determinants. More generally, knowing whether response order effects constitute an important kind of context effects in voting intention questions would contribute to distinguishing the proportion of survey error attributable to context effects in opposition to sampling bias. Our results will contribute to narrowing the possible determinants of voting intentions' difference between national surveys.
In this thesis, I will investigate response order effects in dichotomous voting intention questions during the 2008 American presidential election. In the 80's and 90's, the multiplication of warnings that response order effects may bias results encouraged private survey firms to implement response item rotation. Item rotation means that response items are presented in reverse order to two randomly selected split-samples. Since there is no technique to prevent response order effects from affecting data reliability, survey firms merge results from the two split-samples, thereby diluting any potential bias of response order effect on itself. The design of these item rotations is exactly the same as the design of a randomized controlled trial that would aim at measuring response order effects. When the split-samples are encoded in a rotation variable and when that variable is stored into the survey dataset, it is then possible to verify if one split-sample is more likely to choose the first or the last candidate than the other split-sample. This thesis exploits these data to verify if dichotomous voting intention questions are subject to response order effects.
Chapter 1 reviews the main theories that deal with response order effects and identifies the hypothesized causal relations associated with question attributes and respondent's attributes. From this review of literature, we conclude that the most appropriate theory concerning response order effects in dichotomous questions, namely satisficing theory, predicts that there should be no response order effects on dichotomous voting intention questions. The rest of the thesis consists in testing whether this "no-effect" hypothesis can be rejected or not. Chapter 2 highlights the possible pitfalls related to response order effects measurements. To do so, it elaborates the tug-of-war framework, an analogy that distinguishes six scenarios eventually hidden behind the simple measured
is divided into two steps, each of which will allow us to eliminate rival scenarios until the only remaining scenarios are the two that correspond to the no-effect hypothesis. Chapter 4 explains how the data on response order effects in voting intention questions were extracted from private firms' datasets.
Chapter 5 presents the first step of the proof. Experiment 1 is a meta-analysis of response order effects in voting intention questions during the 2008 presidential campaign. Results from the meta-analysis eliminate three rival scenarios. Chapter 6 presents the second step of the demonstration. Experiment 2 consists in verifying what proportion of the variance in response order effects is actually due to random imbalance in the split-samplings of the rotations. If a great proportion of this variance is simply due to the accidental overrepresentation of supporters of a party in one split-sample as compared to the other - a phenomenon called chance bias - then and only then could we conclude that respondents to dichotomous voting intention questions are not influenced by candidates' order of presentation.
to agree (Bishop and Smith, 2001; McDermott and Frankovic, 2003). Confronted with this ambiguity, it appears hazardous to posit any clear hypothesis on whether response order effects are expected or not. One way to cope with this problem consists in reviewing the literature to verify if theories on order effects provide further clues. This chapter aims at collecting such clues.
The literature on how response item ordering may influence respondents' cognitive processes is scattered. Response order effects have been scrutinized under different scientific lenses: impression formation (Anderson & Barrios, 1967), persuasion (Petty & Cacioppo, 1986), theories of choice (Tversky & Kahneman, 1981), survey methodology (Borgers, Hox & Sikkel, 2004; Cross, 2005; Schuman & Presser 1996) marketing strategies (Barker & Honea, 2004; Belson, 1966; Unnava, Burnkrant & Erevelles, 1994), and linguistics (Johnson, 1981; Tavassoli & Lee, 2004). The consequence of such a spread is the emergence of different theories or models that sometimes use concepts that overlap and tend to ignore developments in other disciplines. It is my opinion that a broad literature review integrating all existing evidences and theories would strongly contribute to the synthesizing of existing knowledge and the orientation of future research. However, the amount of time and resources required for such a project goes far beyond my ambitions. This chapter limits itself to reporting the most cited theories and hypotheses.
This chapter reviews the four most important propositions found in the literature: lack of crystallization hypothesis; satisficing theory; memory limitation hypothesis; and elaboration likelihood models. These are certainly the best developed and tested propositions concerning the determinants of response order effects. For each of them, we will highlight the proposed causal relationships linking question attributes and respondents' attributes to response order effects. By question attributes, we refer to elements of the questionnaire such as question wording or question location in the questionnaire. By respondents' attributes, we refer to characteristics of respondents, such as age or attitude strength.
Remember now that response order effects can point in two "directions". If items are systematically more likely to be selected when presented first, we speak of a response order effect in the primacy direction. If items are more likely to be chosen when presented last, we speak of a response order effect in the recency direction. The four propositions bear predictions that vary in their level of precision. When possible, we will specify how question attributes or respondent's attributes are expected to direct respondents toward choosing the first (primacy) or the last (recency) response item. For each of these propositions, we will also see if the experiments found in the literature tend to support or disconfirm the hypothesized relations. We will conclude each section by discussing whether or not the theory presented seems to apply to voting intention questions, and if so, we will state its predictions.
1.1 The Lack of Crystallization Hypothesis
The most intuitive explanation for response order effects is the so-called lack of crystallization hypothesis (Rugg & Cantril 1944, p.48-49; Payne 1951, p.179-180). To be considered "crystallized", an opinion must fulfil three conditions: 1) it is a strong opinion; 2) it existed before its measurement; and 3) it resists persuasion (Schuman & Presser 1996, p.251). It is proposed that those respondents whose opinion is crystallized simply report this opinion when being asked for it; they would not be influenced by the ordering of response items. On the other hand, respondents whose opinion is not crystallized would be more influenced by context elements, more likely to be influenced by response ordering.
As intuitive this proposition may seems one should note that the lack of crystallization hypothesis does not aim at explaining the mechanisms that underlie response order effects. Rather, it limits itself to proposing conditions where no effect is expected. In so doing, it provides no clear prediction about the direction - primacy or recency - a response order effect would take among respondents whose opinions remains "uncrystallized".
The two most cited tests of the lack of crystallization hypothesis were performed by Krosnick and Schuman (1988) and by Bishop (1990). These studies - the latter replicates the former - insist on the first condition of opinion crystallization: attitude strength. Both tests measured attitude strength by asking respondents to report how they assess their own attitude intensity, attitude importance and attitude certainty. They found no significant attitude strength effect on response order effects.
Krosnick and Schuman's (1988) or Bishop's (1990) tests do not bear on dichotomous voting intention questions. If we expand the lack of crystallization hypothesis to voting intentions question, it could be suggested that respondents' preferences are less well crystallized at the beginning of the campaign than at the end. Therefore, we could expect response order effect - both primacy and recency - to occur at the beginning of the campaign, effects that would fade as the campaign goes on. This being said, the evidence in support of the lack of crystallization hypothesis are so weak that we feel completely comfortable omitting to test this hypothesis and presuming that the lack of crystallization has no impact on response order effects.
1.2 Satisficing Theory
Following his demonstration that the lack of crystallization hypothesis fails to explain response order effects and other contextual effects, Jon A. Krosnick endeavoured to fill this theoretical gap and developed satisficing theory (Krosnick, 1991b). Satisficing theory classifies respondents into two categories: good respondents, and satisficers. Good respondents optimize their answer. They perform all the steps needed to report an answer that accurately reflects their opinion on an issue: "They must carefully interpret the meaning of each question, search their memories extensively for all relevant information, integrate that information carefully into summary judgements, and report those summary judgements in ways that convey their meaning as clearly and precisely as possible" (Krosnick, 1991b: 214). Satisficers, on the other hand, become disheartened at a certain point in the questionnaire or on specific questions, skip over one or more of these steps and therefore prefer misreporting their opinion to investing the efforts required to answer
accurately. A satisficer may use different strategies to report an attitude that is not his own. One of these strategies is the selection of the last item presented (a recency effect) when items are presented in audio mode.
The likelihood to satisfice is a function of three types of determinants: 1) task difficulty, 2) respondent's abilities to think, and 3) respondent's motivation to think. Task difficulty refers to question attributes relating to the complexity of the question: sophisticated wording, complex concepts, long questions, fast pace of the interviewer, etc. Facing a complex question, respondents should be more likely to content themselves with a "pseudo-opinion" (Bishop, 2005). The two other types of determinants concern respondent's attributes.
A respondent's ability to think may take three different forms. The first form is what Krosnick calls cognitive sophistication: "retrieving information and making judgements should be easier for respondents adept at performing complex mental operations" (Krosnick, 1991b). The second form is concerned with whether a respondent has ever even thought about the topic or if this is the first time he/she considers it. The third form distinguishes respondents who have a pre-existing opinion on a topic from those who decide on their opinion during the interview.
Finally, respondent's motivation refers to his need for cognition, that is, whether or not he enjoys pondering thoughtfully on a particular question. Motivation also depends on other elements such as respondent's perception of the importance of a topic or the importance of the survey itself (e.g. media poll vs. national census).
An easy task combined with a sample of respondents with a high degree of ability and motivation would foster an optimal response. At the other extreme, a respondent would be more likely to satisfice in a situation where a difficult task is combined with low ability and low motivation. Satisficing increases in proportion with task difficulty and decreases in proportion with ability and motivation. The next equation illustrates how Krosnick (1991b) initially conceived these interactions.
,c * « • v a,(Taskdifficulty) p (Satisficing) = -a2( Ability) X a,( Motivation )
Task difficulty has been studied in two major articles: one from Bishop and Smith (2005) and one from Holbrook, Krosnick, Moore and Tourangeau (2007). Concerning telephone interviews, both studies conclude that question complexity and longer response items are correlated with more significant recency effects. However, other papers express some scepticism regarding the relationship between recency and task difficulty (for a comparison of effects in different waves of a panel, see Flores-Macias & Lawson 2007; Cross, 2005). Respondent's motivation has received less attention in the literature. The number of preceding questions as a proxy of respondent's fatigue shows conflicting results (Holbrook et a l , 2007; Bishop & Smith, 2005), but respondent's attention level as subjectively measured by interviewers fails to predict recency effects (Flores-Macias & Lawson, 2007).
The last determinant of satisficing is respondent's ability. Krosnick (1991b) identifies three forms of ability: respondent's cognitive sophistication, respondent's previous thoughts about an issue, and respondent's pre-existing opinion. The literature on response order effects insists solely on cognitive sophistication. Krosnick and Alwin (1987) found that educational attainment and vocabulary tests are correlated and that they both predict response order effects on written questionnaires. Years later, Krosnick, Narayan & Smith (1996) found comparable results in an experiment involving undergraduate students. This time, vocabulary tests failed to accurately predict response order effects, but math tests succeeded. This inconsistency has not prevented educational attainment from being used as a proxy for cognitive sophistication in more recent studies (Holbrook et al, 2007; Narayan and Krosnick, 1996; Stern, Dillman and Smyth, 2007) even thought concerns were raised on measurement issues (Sudman, Bradburn & Schwarz, 1996: p. 149). This being said, the low level of education attainment has often succeeded in predicting recency effects.
To sum up, satisficing theory hypothesizes that response order effects - more precisely recency effects in the case of telephone interviews - are caused by a complex
interaction of task difficulty, respondent's ability and respondent's motivation. Each of these concepts has been operationalized in different ways. Some tests confirm the theory while others challenge it. The relationships between question attributes and response order effects have been widely investigated and most hypotheses have been confirmed. However, determinants concerning respondents' attributes have not been tested much, with the noticeable exception of respondent's ability. In fact, regarding respondent's ability, experts in the field have reached a point where they insist solely on cognitive sophistication, measured with educational attainment, and leave "previous thoughts" and "pre-existing opinion" behind. Now that satisficing theory has been explained, we must link it to the topic at interest and verify what predictions can be made.
This thesis aims at verifying whether dichotomous voting intention questions are subject to response order effects. One of the determinants of response order effects proposed by satificing theory is the level of task difficulty. In dichotomous voting intention questions, the number of response alternative is at its minimum for a closed-ended question. The candidate names presented as response items are well broadcasted by the media and candidates are labelled according to their partisanship. Moreover, the voting intention question is somewhat normalized from one survey firm to another and phrased with simple wording. All these elements converge to suggest that the task difficulty of answering a voting intention question is at its minimum. Recall that the equation above shows that the probability to satisfice is a function of an interaction between task difficulty, respondent's ability and respondent's motivation. Since all these terms are gathered in a single one-term equation, the expected probability of satisficing becomes zero as soon as anyone of these terms takes a null value. As just described, the level of task difficulty in dichotomous voting intention question is so small that we can assume that degree of task difficulty is null or approximates zero.
As far as the low task difficulty assumption is endorsed, satisficing theory predicts that respondents to voting intention questions are not likely to satisfice. Consequently, we expect that the likelihood of a candidate being selected will be the same no matter what is his/her position. In other words, satisficing theory predicts that voting intention questions
are not subject to response order effects. Thereafter, we refer to this hypothesis as the "no-effect" hypothesis.
1.3 Memory Limitation Hypothesis
Work on memory limitation has been published by Bàrbel Knàuper (1999). Analogous to a computer Random Access Memory (RAM), working memory refers to one's ability to recall information while at the same time processing an evaluation or task (Bishop and Smith, 2001). Memory limitations do not simply involve forgetting some response alternatives. Decreasing working memory also affects one's ability to critically evaluate conflicting arguments. The low amount of available information stored in mind retrains one's ability to engage in deep reflection. Knauper inserts low working memory in the satisficing theory as another element that could affect respondent's ability to process complex thought - or cognitive sophistication - thereby generating response order effects (1999: p.367). Since older respondents form a group that is especially likely to suffer from memory limitation, the memory limitation hypothesis predicts that respondents 65 years old and older would be more likely to show significant response order effects. However, unlike Krosnick in his satisficing theory, Knauper is careful not propose a direction to an expected response order effect, limiting herself to "the hypothesis that response order effects -whether primacy or recency effects - are more pronounced in older age" (1999: p.352)
In a meta-analysis of audio mode questions from Schuman and Presser's experiments (1996), Knàuper finds larger response order effects among older respondents, but also a significant recency summary effect. Moreover, results of logistic regressions including age and education show that their respective effects are attenuated when both variables control each other. This suggests that age and education may actually affect to the same underlying construct: cognitive sophistication, as hypothesized. A deep investigation of response order effects among older respondents is made in Smith's doctoral dissertation (1997). Smith investigates response order effects in surveys conducted by Gallup during the 1930's, 40's and 50's. He observes that effects among older respondents are indeed larger in size than they are among younger, but also finds that both primacy and recency occur
within similar frequency. He notices Knauper's hesitation to cast more precise predictions about the direction of the expected effect, a weakness that leads him to conclude that some factors other than memory could possibly be at work producing larger response order effects among older people. Similar concerns were raised by Elliott and Fowler (2000), who also find larger effects randomly distributed in primacy and recency directions. Later, Holbrook et al. (2007) find a significant recency averaged effect in both younger and older groups and conclude that age does not cause response order effects. However, a significant effect emerges from education, which is inconsistent with Knàuper's proposition that both variables refer to the same concept.
To summarize, Knàuper nauper suggested that respondents with memory limitation would be more likely to be affected by response ordering and showed results confirming her expectation. Since then, three trials have failed to replicate her conclusions. As was the case with the lack of crystallization hypothesis, the evidence supporting the memory limitation hypothesis is weak. Moreover, since candidates are named with their party in survey questions, someone with memory limitation could certainly use such clues and choose a candidate solely on the basis of his/her political party. Here again, we feel comfortable in assuming that the null hypothesis cannot be rejected and that memory limitations have no impact on response order effects.
1.4 Elaboration Likelihood Models
The literature on persuasion has contributed some innovative models concerning response order effects. Haugtvedt and Wegener (1994) base themselves on Petty and Cacioppo's (1986) Elaboration Likelihood Models (ELMs) to predict the occurrence of response order effects. According to Haugtvedt and Wegener, individuals vary in their motivation to scrutinize - a characteristic they call need for cognition - and also vary in their ability to think propositions. Depending on her ability and motivation, a person engages in one of two possible cognitive processes.
A person with high abilities and motivation who performs an active elaboration takes the "central route". The respondent makes an "on-line" evaluation of propositions and arguments as they are presented. This cognitive process makes the respondent more likely to elaborate on the first argument and to generate a strong attitude - favourable or unfavourable - about it even before a second argument is presented. At that time, the second argument is perceived as a counter-argument to the first argument, but also as an attack on the respondent's newly formed attitude. This newly formed attitude being strong, the respondent resists persuasion pressure of the second argument. Consequently a person with high abilities and motivation is more likely to prefer the first response item, and this generates a primacy effect.
Conversely, a person whose abilities and motivation to elaborate are low usually chooses the "peripheral route". This type of respondent tends to form soft attitudes and does so only at the moment when he/she is asked for an opinion, that is, once all arguments have been presented. Such persons are also more likely to look for clues in the question. Haugtvedt and Wegener propose that individuals with low ability and motivation are more likely to choose the last argument presented (recency effect). Moreover:
if recency effects occur when elaboration is low, one reason for this might be reliance on message content when formulating a response to the attitudinal inquiry. If so, memory for message content (especially memory for recently presented material, that is, arguments in the second message) should be positively related to attitudes for subjects low in elaboration likelihood. There should be little or no relation between memory for recently presented arguments and final attitude for subjects under high-elaboration conditions. (Haugtvedt and Wegener, 1994: p.208)
In their experiment, Haugtvedt and Wegener (1994) operationalize people's "need for cognition" - or motivation to think - by "manipulating the personal relevance of a message topic". About half of the undergraduate students they surveyed received questions that were framed in a way that made an issue seem irrelevant to them and the other half received questions that were framed so they would feel concerned. As expected, low relevance questions produced a recency effect, and high relevance questions showed primacy effects. These results were obtained with paper questionnaires. Haugtvedt and
Wegener make no predictions for the kind of effect they would expect if the same arguments were delivered in audio mode.
Apart from Haugtvedt and Wegener's initial experiment, ELMs predictions have received little empirical attention. In her Master's thesis, Kis (1994) tests the influence of need for cognition and level of attractiveness of response items (whether they elicit positive thoughts or not) on response order effects on questions with multiple response items. She finds that, individually, these determinants have no singular impact. However, a respondent whose need for cognition is low seems to be a little bit more likely to select the last response items from a list of unattractive items. Prior to Haugtvedt and Wegener's article on ELMs, Kassin, Reddy and Tulloch (1990) had found that jurors with a high need for cognition were more influenced by first arguments. Conversely, jurors low in need for cognition tended to accord greater importance to the last arguments in the determination of their verdict.
To summarize, ELMs predict a negative relationship in favour of primacy -between response order effects and both motivation and ability to elaborate. More precisely, ELMs predict that respondents with high motivation would build strong attitudes early, resist persuasion, and show primacy effects. In contrast, those with low motivation would not resist persuasion, would form soft attitudes and would show recency effects. ELMs also expect an interaction between respondents' ability and motivation to think. Moreover, each of these moderators would interact with memory limitations, which would increase the recency effect on individuals with low motivation and low abilities.
Even though the Elaboration Likelihood Models make attractive propositions, they do not seem to apply to voting intention questions. If ELMs predict order effects, they were designed to test if the order of persuasive arguments affects someone's choice between two opposing points of view. ELMs could certainly be tested on marketing strategies to verify if some "motivated" consumers are more likely to absorb early-presented selling arguments. However, voting intention questions aim at probing or collecting respondents' opinion and not at stimulating reflection. Candidates are not presented as arguments in favour of a
party; they are presented as choices.1 Here again, we dismiss the testing of ELMs hypotheses on the presumption that they do not apply to voting intention questions.
7.5 Conclusion
At the beginning of this chapter, we realized that existing evidence on response order effects in dichotomous voting intention questions were not consistent enough to cast a clear prediction. Then, we decided to engage in a literature review in order to bring out some clues on what our theoretical expectation would be. In doing so, we presented the four main theories and propositions that aim at predicting response order effects. Two of them were rejected on the basis of the lack of empirical support. As we saw, past experiments bearing on the lack of crystallization hypothesis and those on the memory limitation hypothesis converge in rejecting these hypotheses as consistent predictors of response order effects. Another proposition, Elaboration Likelihood Models (ELMs), was rejected because its reach does not extend to dichotomous voting intention questions. We saw that predictions made by the ELMs were designed to predict the effect of the order of presentation of arguments related to conflicting opinions. This context is not suitable for our object of research since candidates presented in dichotomous voting intention questions are not framed as arguments but rather as simple response items. Finally, the remaining theory, namely satisficing theory, predicts that the level of task difficulty associated with voting intention questions is not high enough to generate response order effects.
If our low task difficulty assumption and satisficing theory are both right, the context of voting intention questions is one that requires so little effort that respondents
1 Schwarz, Strack, Hippler and Bishop (1991, p.203) suggested a model that is directly inspired from ELMs.
They suggest that the level of plausibility of response items may also influence respondents' cognitive process, so that a plausible item presented at the end of a long list of answers would be more likely to be selected when the question is asked during a telephone interview. But, as the authors notice by themselves, survey questionnaires usually avoid implausible response items, they also avoid long list of items. This being said, since dichotomous voting intention questions fulfil none of these two conditions, we could here again expect no response order effect to emerge.
should be unlikely to satisfice, that is, unlikely to select one item more than the other simply on the basis of its position. This means that satisficing theory predicts no relation between the likelihood to choose a response item and its location - first or second. Therefore:
Ho: Respondents to dichotomous voting intention questions are not influenced by candidates' order of presentation.
Hi: Respondents to dichotomous voting intention questions are influenced by candidates' order of presentation.
The rest of the thesis takes aim at testing this no-effect hypothesis. If Ho cannot be rejected, we could then conclude that the data on response order effects in dichotomous voting intention question support the prediction casted by satisficing theory. On the other hand, if this research finds that the likelihood of selecting a candidate is affected by response ordering, the results will support whatever alternative hypothesis (Hi) and raise doubts concerning the accuracy of satisficing theory.
To comply with elementary principles of hypothesis testing, we first need to reframe the problem in order to perform a test that intends to reject to null of no-effect hypothesis (Ho). The following chapter develops this theoretical framework.
phenomenon of response order effects is usually measured and it insists on some measurement issues. At this point, I show how the high simplicity of the measurement method may completely fail to grasp how different subgroups may react in contrasting ways to response ordering. The second section continues in identifying the different pitfalls related to order effects measurements. It undertakes the task of developing the tug-of-war framework; a new analogy that identifies six different scenarios eventually hidden behind measured values of response order effects. Two of these scenarios correspond to the no-effect hypothesis.
2.1 Measurement Issues
The influence the ordering of response items might have on respondents' answer retrieval is a psychological phenomenon hard to capture. For now, the only way to measure if a specific question is subject to response order effects is to plan a survey experiment in the form of a randomized controlled trial. For dichotomous questions, this type of experiment consists in dividing at random the original sample into two split-samples and rotating response order of presentation without respondents' knowing it. The occurrence or non-occurrence of response order effect is assessed a posteriori in the following way.
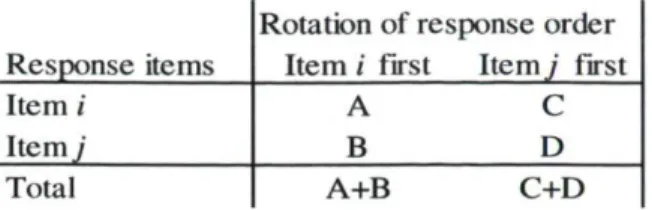
Suppose a dichotomous question, with response items i and j . Table 1 illustrates a customary two-by-two contingency table that crosses response items to a dichotomous question (in rows) and response order of presentation (in columns). The letters A and B correspond to the frequency of selection of items i and j when in the split-sample to which item i was presented first. Letters C and D are the frequencies of items i and j in the split-sample to which j was presented first. Notice that the non-response items (don't know, refuse, would not vote) are eliminated at that point and recoded as missing values.
Table 1. Two-by-two Rotation Table
Response items
Rotation of response order Item i first Item j first Item /' Item j A B C D Total A+B C+D
Response order effects are measured by calculating the difference in probability of an item being selected depending on its position. For item i, this difference is calculated with:
APi =
C + D A + B = Pt2 - Vil
A positive Apt indicates a recency effect: item i is more likely to be selected when it is presented second. A negative sign indicates a primacy effect: item i is more likely to be selected when it is presented first. For dichotomous response items and once non-response items are being recoded as missing values, the value of Ap is the same, no matter which item - i ov j - is chosen as the reference to measure the effect, so the script i can be deleted from the previous equation. The following identity shows how Apj = Apt = Ap :
B D C A A P ; ~ A + B ~ C + D ~ C + D " A + B " à P i " & P A + B C + D A + B C + D A B I C D — 1 A + B ' A + B C + D C + D B D C A C + D A + B ' A + B C + D C A C + D A + B ' Ap = pi 2 - pt l = pj 2 - pn = p 2- P i ■
The result of this equation informs us on whether there is a response order effect or not. We usually speak of a significant response order effect when the difference in likelihood of a response item (Ap) being selected is significantly different than zero. A positive and significant value of Ap indicates that the item is more likely to be selected
when presented last, thus revealing a recency effect. In contrast, a negative and significant value of Ap indicates that the item is more likely to be selected when presented first, thus revealing a primacy effect. We also speak of a non-significant response order effect when Ap is not significantly different than zero. Throughout this entire thesis, voting intention questions oppose a Democratic candidate to a Republican candidate. Response order effects will be measured with the probability of the Democratic candidate's being selected when presented last minus his/her probability of being selected when presented second.
Now that we know how response order effects are measured, I would like to insist on how the value of Ap can lead to wrong conclusions about the phenomenon of interest. To begin with, we must distinguish the theoretical phenomenon from the operational variable. The phenomenon we are interested in is the psychological process that occurs among some respondents in the sample. We want to know whether some respondents are influenced by the ordering of response items. To verify if this phenomenon occurs, we use the operational variable Ap to see if the likelihood of an item's being selected is significantly different from zero. It is assumed that Ap measures response order effects. In other words, if a response item is more likely to be selected when presented at a specific position, it is assumed that this difference in likelihood of being selected is caused by the
influence response ordering has on respondent's cognitive processes. My assertion is that a strong reliance on this assumption may lead to wrong interpretations concerning the occurrence or non occurrence of response order effects.
In this thesis, we want assess if respondents to a dichotomous survey question are affected by response ordering. As just explained, if we rely solely on the value of Ap, results can take three distinct forms. They can show: 1) a non-significant Ap; 2) a significant Ap pointing to a recency effect or; 3) a significant Ap pointing to a primacy
effect. In fact, any of these three conclusions could be misleading, chiefly because this effect is measured on the whole sample. As Knàuper warns us,
a nonsignificant effect in the full sample could simply be the result of a large subgroup of respondents not being susceptible to variations in response order, whereas another smaller subgroup might show the expected response order effects. Not being able to detect these effects would then simply be due to a lack of statistical power, As a consequence, one would incorrectly accept the [no-effect] hypothesis. [...] Furthermore, different subgroups might display response order effects in opposite directions (i.e., primacy vs. recency effects). These effects would balance each other out for the full sample, again resulting in nonsignificant overall effects (despite meaningful differences). (Knauper,
1999: p.353 ; for an example, see McClendon, 1986: p.209)
Knàuper's warnings concern Type 2 errors, also called false negatives, by which a researcher would fail to reject the no-effect hypothesis when it should actually be rejected. If one of these situations were to occur for a specific survey question, such failures to reject the no-effect hypothesis would leave the researcher with the wrong impression that this question is safe from or immune to response order effects.
A strong reliance on a Ap value as measured on the whole sample could trap the researcher into other misinterpretations. As in any statistical test, Type 1 errors, consisting in rejecting the no-effect hypothesis when it should actually not be rejected, are also possible. And suppose two subgroups, one being twice as big as the other, both affected by response ordering, but in opposite manners: one is more likely to select the first item presented; the other is more likely to select the last item presented. In that case, the Ap value may reveal a significant effect pointing in the direction of the bigger group, showing a value that would underestimate the total proportion of respondents affected by response ordering. The following section develops an analogy to be used as a framework. It exposes the six different scenarios possibly hidden behind the Ap values. This analogy will later be used to facilitate the interpretation of results.
2.2 The Tug-of-War Framework
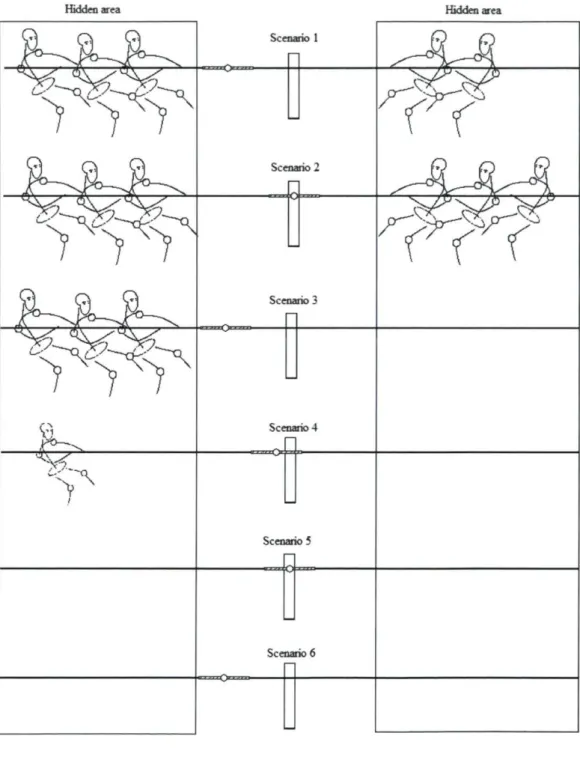
Response order effects as measured on the whole sample with Ap values can be compared to a tug-of-war game in which bed sheets conceal teams from us, the spectators. All we know is that on the left side, there is the primacy team and on the right side, the recency team. All we can observe is the aggregated balance or imbalance of teams' strength. A knot is located at the middle of the rope and a stick has been hammered into the ground, serving as a landmark to indicate the leading team. A ribbon or a tape is fixed on either side of the knot. When the taped area has completely crossed the stick on one side, victory is awarded to the team on that side.
Considering that all we know as spectators is the location of the knot and the side tape toward the stick, six scenarios are possible, each of which is presented in Figure 1. Scenario 1 : One team pulls harder than the other and the knot moves to their side of the gauge-stick. Scenario 2: Teams are equal in strength and the knot stays close to the stick. Scenario 3: There is only one team and they pull the knot to their side of the stick. Scenario 4: A single child tries to pull the knot to her side, but the rope is too heavy and the knot stays near the stick. Scenario 5: There are no teams at all and therefore no force is exerted on the rope. Once again, the knot stays in the middle. Finally, in Scenario 6, there are no teams at all, no forces is exerted on the rope, but the knot accidentally (by chance) stays far enough from the stick to leave the observer with the impression that one team has pulled this knot away from the stick.
Figure 1. The Tug-of-war Framework
Hidden area Hidden area
Scenario 1
V T V
Scenario 2Y ^
Scenario 3 y—-^v.
-y
Scenario 4 Scenario 5 f t -Scenario 6 o =In this analogy, the way teams are set up for real is the theoretical phenomenon of interest to us. Teams correspond to these subgroups of respondents' who are affected in one direction or the other (primacy or recency) by response ordering. The distance and position (left/right) of the knot relative to the gauge-stick corresponds the operational variable Ap. The tape refers to the confidence interval associated with a measurement. Scenarios 2 and 4 are Type 2 errors since they would lead the researcher to conclude that respondents are not affected by response ordering while some are. Scenario 6 is a Type 1 error in which the no-effect hypothesis is rejected when it should not be. Scenario 1 would be another type of error. The researcher would conclude that respondents are more likely to select a response item when presented first, for example. But the correct conclusion would be that some respondents are affected by response ordering in different ways, and that the group of respondents who are more likely to select the first item is more numerous than the group of respondents who are more likely to select the second response item. Only in Scenarios 3 and 5 does the position of the knot - value of Ap - accurately report the phenomenon of response order effects.
The point is now made that some measurements misreport the phenomenon. Still, the problem is that basing ourselves only on the knot position makes it impossible to distinguish good measurements from bad ones. In fact, it is impossible to differentiate Scenario 1 from Scenarios 3 and 6; all of them predict significant primacy or recency effects. It is also impossible to distinguish Scenarios 2, 4 and 5 since all of them predict a Ap not significantly different from zero.
In this thesis, our hypothesis is that respondents to voting intention questions are not affected by response order effects. One must not be deceived: among Scenarios 2, 4 and 5 which all show a null effect, only Scenario 5 happens to be a real absence of response order effect. Moreover, in some rare instances, it is possible that a Ap value shows a significant response order effect that is only an extreme value from a random error distribution centred on zero (Scenario 6). What we now need is a way to discern Scenarios 5 and 6 from the others. The following section develops the research design that will allow us to make this essential distinction.
The research design draws from what Rein Taagepera (2008) calls the Sherlock Holmes principle. Taagepera's main idea is that the confirmation of a hypothesis requires the researcher to specify clearly what the expected results are before starting any investigation of the data. Such predictions are based solely on logical constraints: What do we expect to observe if the hypothesis is to be confirmed? ; Which observations would make no sense and thus result in a failure to confirm the hypothesis? The purpose of these expectations is to orient the researcher in his/her demonstration. Following the Sherlock Holmes principle, our research design consists of several steps through which some scenarios are eliminated on the basis of previously defined logical boundaries, up until we reach a point of certainty at which we are comfortable accepting or rejecting the no-effect hypothesis. Our strategy is divided into two steps.
3.1 Step 1
If the no-effect hypothesis is to be confirmed, we expect that most measurements of response order effects will show a non-significant Ap value (Scenario 5). We expect that the distribution of the Ap gathered from different experiments will have a mean of zero and will apparently be scattered at random around the zero value. With certain rare exceptions, some Ap located at the extremity of this random distribution will be far enough from the "gauge-stick" to be significantly different from zero (Scenario 6).
The tug-of-war framework makes it clear that it would be impossible to distinguish Scenarios 2, 4, and 5 from each other on the basis of the Ap values. However, the measurement of several response order effects on different dichotomous voting intention questions generates a distribution of effects, a distribution from which we can extract important information. If the scenario hidden behind the Ap values is one of Scenarios 2, 4 or 5, we would expect that the distribution of response order effects has a mean of zero and is apparently distributed like random measurement error. This logical constraint allows us to distinguish this first group of scenarios (2, 4 and 5) from a second group, formed of Scenarios 1 and 3. If one of Scenario 1 and 3 was underlying response order effects on dichotomous voting intention questions, the distribution of effects would still be shaped
like the normal curve - that is, like random measurement error - but the mean value of Ap would be significantly different from zero.
This being said, it is also possible, although theoretically unexpected, that the determinants of response order effects vary from one survey to another. Referring to the satisficing theory, the assume that the task difficulty of answering to a dichotomous voting intention question in null. But another appealing assumption would be that the task difficulty decreases as the electoral campaign goes by. Suppose for example that respondents tend to satisfice at the beginning of the electoral year because voting intention questions refer to candidates whose names are not recognized by respondents, but that the task difficulty decreases as the candidates become more famous, as we come closer to election day. According to this second reading of satisficing theory, surveys at the beginning of a campaign would show significant response order effects and those at the end would show non-significant effects. In that case, the mean Ap value may not be different from zero, but the distribution of Ap in time would reveal this trend. We will therefore need to verify whether the occurrence or non occurrence of response order effects is apparently affected by time.
This distinction between the group gathering Scenarios 2, 4 and 5 from the group formed of Scenarios 1 and 3 is the objective of Experiment 1. Experiment 1 will consist in a meta-analysis of response order effects measured on voting intention questions. The meta-analysis will generate a summative value of all effects. This summative value is the equivalent to a mean of effects weighted by the number of cases in each experiment: Ap values from split-samples that implied a small number of respondents have a smaller influence on the summary effect than those Ap values from split-samples that rely on a
large number of respondents.2 The unfolding of a summative effect non-significantly different from zero would allow us to eliminate Scenarios 1 and 3. Indeed, using the methods of meta-analysis will even allow us to go further.
As we saw, Scenario 4 suggests that a small group of respondents is influenced by response ordering and pulls the rope in its direction. However, this group is so small that it is not strong enough to pull the knot away from the gauge-stick. Fortunately, if such a scenario underlies each of the Ap values, the accumulation of several split-sample experiments within a single meta-analysis will allow us to discern it since the summative effect will succeed in capturing this small effect, showing a significant effect. Therefore, a non-significant summary effect would also allow us to eliminate or retain Scenario 4.
To sum up, only if; 1) the value of the summary effect is not significantly different from zero; if 2) the distribution of response order effect is not different from what it would be if it was only made of random measurement error, and if; 3) the distribution is not explainable by the evolution in time, will we be able to conclude that none of Scenarios 1, 3 or 4 occurs. Data failing to fulfil these conditions would mean that this first test rejects the null hypothesis (see H0): we would thus conclude that voting intention questions are affected by response order effects. However, if the three conditions are fulfilled, the remaining question will be whether this situation is the result of equilibrium between two groups of similar size affected in opposite ways by response ordering (Scenario 2) or whether it is the result of random measurement error. Only the latter would confirm our no-effect hypothesis (Scenario 5 and 6).
2 This weighted mean presumes that the survey split-sample experiments were made in conditions that are
similar enough to allow researchers to cumulate data. In fact, this cumulativity postulate is the basis of meta-analysis itself.
3.2 Step 2
The second step of the research design consists in elucidating whether data underlies Scenario 2 or 5 and 6. At this point of the analysis, we will have a distribution of measured response order effects (Ap values) centred on a mean of zero. This distribution will have a very small variance similar to one of random measurement error. The second step of the research design investigates this variance and tries to explain it in a way only Scenarios 5 and 6 would succeed in doing.
In Section 2.1 of the preceding chapter, we explained that the measurement of response order effects was made possible by the experimental design inside each voting intention question. Such randomized controlled trials had planned a rotation of candidates order allowing us to measure response order effects. At that time, we explained how we would measure a theoretical phenomenon of response order effects with the difference in probability of an item being selected depending on its position, that is Ap = p2—px. We mentioned that if a response item is more likely to be selected when presented at a specific position, it is assumed that this difference in likelihood of being selected is caused by the influence response ordering has on respondent's cognitive process. Since then, we showed with the tug-of-war analogy that this assumption does not always hold.
The no-effect hypothesis we intend to test corresponds to Scenarios 5 and 6. In such scenarios, the distance separating the knot from the gauge-stick (Ap) is the embodiment of random error. In randomized controlled trials of that kind, one major source of random error comes from imbalance in baseline variables among split-samples. In a research note published in the British Medical Journal, Roberts and Torgerson (1999) explain:
In a controlled trial, randomisation ensures that allocation of patients to treatments is left purely to chance. The characteristics of patients that may influence outcome are distributed between treatment groups so that any difference in outcome can be assumed to be due to the intervention. However, imbalance between groups in baseline variables that may influence outcome [...] can bias statistical tests, a property sometimes referred to as chance bias. Observed differences in outcome between groups in a particular trial could by
chance be due to characteristics of the patients, not treatments. (Roberts and Torgerson, 1999: 185)
The authors speak of patients and treatment since they are publishing in a medical journal, but the same rationale applies to respondents and stimuli in surveys experiments. Notice that the issue of chance bias is usually a concern when a significant effect unfolds from a randomized control trial that implied a small number of observations. As typical survey sample size is around 1000 respondents, the occurrence of response order effects in voting intention questions is not a phenomenon that should be especially concerned by chance bias. However, at this point of the demonstration, we are wondering if small non-significant response order effects could be due to a too strong reliance on the randomization procedure. Voting intention questions ask respondents which of two candidates they would vote for. It seems quite possible that, by chance, one split-sample contains a few more supporters of the Republican (or Democratic) candidate than the other split-sample does.
One way to verify which of Scenario 2 or Scenario 5 underlies the data consists in verifying what the variance of the distribution of Ap values - a variance expected to be very small - is made of. If there is no response order effect underlying this variation, we expect that most of it is actually made of random error, whose main component would be chance bias as just explained by Roberts and Torgerson (1999). Such results would confirm the no-effect hypothesis and only then we could conclude with great certainty that there are no response order effects on voting intention questions. However, if chance bias fails at predicting most of the variance in Ap values, we will be forced to conclude that the small variance is due to something other than random error, probably some variations in the strengths of the teams displayed in Scenario 2.
Experiment 2 engages in this verification. The measurement of random imbalance requires the use of a "baseline variable" that is a strong determinant of with voting
intentions. The question that certainly fits the best for this criterion is the party identification question, where respondents self-identify as Republicans, Democrats or Independents (Leduc, 1981).
Remember that response order effects were measured by the difference in probability of candidates being selected depending on the order of presentation. The term probability was used because the phenomenon of interest suggests that such probabilities could be affected by response ordering. Now that we turn to the party identification questions, we will measure for each voting intention questions the difference in proportions of Republicans and Democrats identifiers in each split-sample. The equations measuring proportions and probabilities are identical. But here, the term proportion fits better with the idea that we measure a fact how the splitsampling might have misbalanced partisans -rather than a phenomenon.
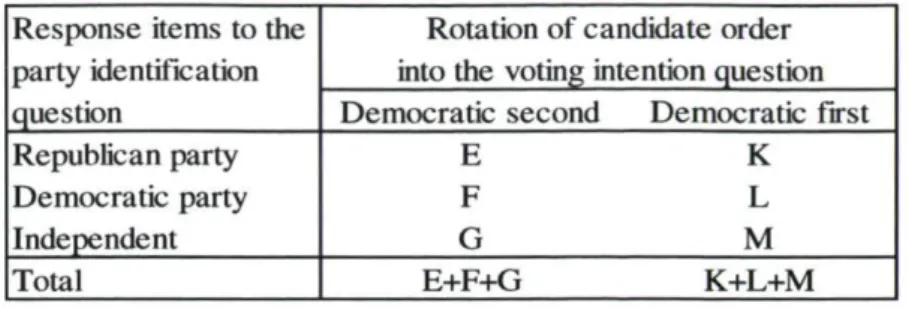
Table 2 reports a contingency table similar to Table 1. The main difference is that response items to voting intention questions in rows are replaced by response items to the party identification question. The columns still distinguish the split-samples for the survey experiment, that is, the order in which candidates in to the voting intention question were presented to respondents. However, the head of the columns, originally labelled "Item i first" and "Item j first" are replaced by "Democratic Candidate First" and "Democratic Candidate Second" to make the exercise more concrete. Letters still correspond to frequencies in cells.
Table 2. Table of Party Identification by the Rotation Variable
Response items to the party identification question
Rotation of candidate order into the voting intention question Response items to the
party identification
question Democratic second Democratic first
Republican party Democratic party Independent E K F L G M Total E+F+G K+L+M
The chance bias can be measured in two ways. First, we can measure difference in proportions of Republican supporters among the two split-samples. The following equation
captures this imbalance:
ARep = K
K + L + M E + F + G = Ao"PDem 2nd "^Dem 1st [Rep] - Ao[Rep]
The second way to measure the imbalance is to measure it among Democratic supporters:
ADem =
K + L + M E + F + G
. p e r n ] _ * Pern]
"fDem2nd "^Dem 1st
We will measure ARep and ADem for each voting intention questions so that we will end with a distribution of chance bias measurements, encoded in two variables also named ARep and ADem.
If the no-effect hypothesis is really hidden behind the non-significant response order effects measured with Ap and encoded as the dependent variable, we expect that ARep and ADem, will succeed at accounting for most of the very small variance in Ap. If data passes this test, then we could conclude with great certainty that there is no response order effect in voting intention questions, as in Scenarios 5 and 6. But if it fails, then we will have to reject the no-effect hypothesis and suppose that the variance in Ap is not made of random imbalance, but instead of some small variations in strength between two teams of similar
sizes, as suggested in Scenario 1. To make this verification, we will use bivariate OLS regression methods.
One last element must be underlined before going on. Experiment 2 is based on the fact that party identification is a strong determinant of voting intention questions. This might not always be the case: some pairs of candidates may show stronger correlations with party identification than others. Different moments in the campaign may also reveal different levels of correlations. On this basis, we can expect that the chance bias will be more reliably measured on party identification questions that correlate strongly with their corresponding voting intention question. Therefore, we predict that chance bias measured on these will succeed better at explaining the variance in response order effects than those party identification questions that correlate softly with their voting intention questions.
This chapter elaborated the research design for testing the no-effect hypothesis extracted from satisficing theory. Our design takes into consideration the possible pitfalls associated with response order effect measurement. It also utilizes the Sherlock Holmes principle that consists in eliminating, on the basis of predefined logical boundaries, rival scenarios until only the remaining confirm the no-effect hypothesis. The following chapter presents the data we extracted to conduct our experiments. It is followed by Chapter 5 and Chapter 6, which report results of Experiment 1 and Experiment 2.