HAL Id: hal-02328288
https://hal.archives-ouvertes.fr/hal-02328288
Submitted on 23 Oct 2019
HAL is a multi-disciplinary open access
archive for the deposit and dissemination of
sci-entific research documents, whether they are
pub-lished or not. The documents may come from
teaching and research institutions in France or
abroad, or from public or private research centers.
L’archive ouverte pluridisciplinaire HAL, est
destinée au dépôt et à la diffusion de documents
scientifiques de niveau recherche, publiés ou non,
émanant des établissements d’enseignement et de
recherche français ou étrangers, des laboratoires
publics ou privés.
Atmospheric input of trace metals to the western
Mediterranean: uncertainties in modelling dry
deposition from cascade impactor data
Francois Dulac, Patrick Buat-Menard, Ulah Ezat, Sam Melki, G. Bergametti
To cite this version:
Francois Dulac, Patrick Buat-Menard, Ulah Ezat, Sam Melki, G. Bergametti. Atmospheric input of
trace metals to the western Mediterranean: uncertainties in modelling dry deposition from cascade
impactor data. Tellus B - Chemical and Physical Meteorology, Taylor & Francis, 1989. �hal-02328288�
Tellus (1989), 418, 362-378
Atmospheric input
of trace metals to the western
Mediterranean: uncertainties in modelling dry deposition
from cascade impactor data
By FRANCOIS DULAC', PATRICK BUAT-MENARD', ULLAH EZATI, SAM1 MELK12 and
du CNRS. B.P. 1, F-91198 Gif-sur- Yvette Cedex, France; 2Facultk des Sciences, Universitk Libanaise, Hadath-Beyrouth, Lebanon ; 3Luboratoire de Physico-Chimie de I'AtmosphPre,
Universitk Paris 7 , 2 Place Jussieu, F-75251 Paris Cedex 05, France
GILLES BERGAMETT13, Centre des Faibles Radioactivitks, Luboratoire Mixte CNRS-CEA, Domaine
(Manuscript received 1 September 1987; in final form 27 November 1988)
ABSTRACT
The mass-particle size distributions (MSDs) of Na, Al, Cd, and Pb were determined from 17, 1-5 day, high-volume cascade impactor samples collected throughout the Western Mediterranean atmosphere between 1980 and 1983. As expected, the mass median diameter (MMD) was the largest for Na, representative of sea-salt aerosol, with a median value of 5.9 pm. The median value for the MMD for Al, representative of mineral aerosol, was 2.8 pm. The smallest values of the MMD were found for pollution-derived elements, Cd and Pb: 0.7 pm. In most cases, the MSDs, for each of the elements, were log-normal. Total dry deposition velocities were calculated from the two-layer deposition model of Slinn and Slinn (1980) using three approaches: (i) by characterizing the distribution as a MMD, (ii) by considering the size distribution as directly given by the cascade impactor, (iii) by fitting the assumed log-normal distribution and dividing it into 100 successive intervals. The first approach appeared to give underestimates. The two other approaches yielded similar results for Cd and Pb, of the order of 0.05 cm S K I , For these elements, however, more than 20% of the
total dry deposition flux was due to particles with diameters of 7.2 pm or greater (collected by impactor stage 1). For Na and Al, the third approach yielded values at least one order of magnitude higher than when using the two others. This clearly underlines the major role played by large particles in controlling the dry deposition of sea-salt and mineral aerosol particles. Direct measurements of Al dry deposition, made in 1985-1986 on the northwestern coast of Corsica, agree best with the values predicted by the third approach (mean calculated and measured values of 1.8 and 3.0 cm s-I respectively). Scanning electron microscopy examinations of samples confirm that mineral aerosol particles with diameters of 10 pm or
greater dominate the dry deposition flux. Preliminary data indicate that for mineral aerosol particles, this flux is, on a yearly basis, about half of the wet deposition flux. However cascade impactor data are not adequate to retrieve true mass-particle size distribution in the size range which controls dry deposition ( D > 7 pm), and this is shown to be the source for one order of magnitude uncertainties in dry deposition calculations.
1. Introduction Br, Mn, V, Pb, and Cd), and 3-dimensional air-
mass trajectories (Dulac et al., 1987). The determination of the biogeochemical fluxes of factors influencing the variability of atmospheric these elements to the marine environment concentrations in the Western Mediterranean, requires a quantitative estimate of the total using geochemical data on elemental tracers of atmospheric input, and the knowledge of its natural and anthropic aerosol sources (Al, Na, temporal variability. This requires an assessment
Tellus 41B (1989). 3
MODELLING DRY DEPOSITION FROM CASCADE IMPACTOR DATA 363
of factors influencing wet and dry deposition removal rates. Wet deposition is generally the major contributor to the total deposition fluxes of trace elements in oceanic regions (Arimoto et al.,
1985; Uematsu et al., 1985; Dedeurwaerder et al.,
1986). Over the Western Mediterranean Sea, the total deposition of mineral aerosol particles appears also quantitatively dominated by spor- adic red rains and dust storms (Loye-Pilot et al.,
1986; Bergametti et al., 1989). However, the almost continuous dry deposition flux must also be known in order to assess the impact of atmos- pheric inputs on the Mediterranean marine system. Indeed, the climate in this region is characterized by long periods without precipi- tation (GESAMP, 1985). Further, residence times of some reactive trace elements in surface sea water may be short enough (a few days or weeks; Coale and Bruland, 1985) so that dry deposition can affect their surface marine biogeochemical cycles. Moreover, the vicinity of African aerosol sources should induce higher dry deposition velocities than over remote oceanic regions, due to the presence of a significant coarse fraction in the mineral aerosol.
Elemental deposition fluxes are generally calculated from atmospheric concentrations because of the difficulties of a direct assessment
of atmospheric inputs over the sea (Hicks et al.,
1980). Although models of dry deposition of particles on natural water surfaces are already available, our knowledge of deposition processes is still not complete (Slinn, 1983). In this paper, we present some calculations and measurements of dry deposition velocities and dry deposition fluxes of trace elements to the Western Mediterranean, in order to focus on the sensi- tivity of the results to the mass-particle size distributions, and on related uncertainties. Al,
Cd, Na, and P b dry deposition fluxes have been calculated using the dry deposition velocity model of Slinn and Slinn (1980), which has been applied to our data on atmospheric concentrations as a function of particle size (Dulac et al., 1987).
Comparisons have been made with results from A1 dry deposition samples collected in Corsica.
2. Material and methods
2.1. Sampling and analytical procedures
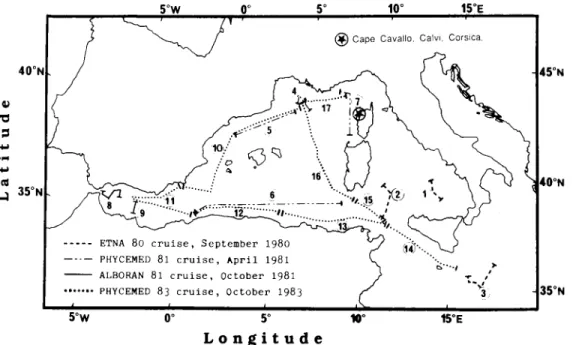
17, 1-5 day size-separated aerosol samples have been collected throughout the Western Mediterranean during 4 cruises between Septem- ber 1980 and October 1983. Sampling locations are given in Fig. 1. The samples were collected
40" Q)
a
1 Y Y .C( (d c;l 35"l 5"W 0" 5" 10" 15%@ Cape Cavallo. Calvi. Corsica
5"W 0" 5" 10"
L o n g i t u d e
5"N
O"N
5"N
Fig. 1. Sampling locations in the Western Mediterranean Sea.
364 F. DULAC, P. BUAT-MENARD,
u. EZAT.
s. MELKI AND G . BERGAMETTIfrom a bow tower, on acid washed Whatmana 41 filters, using a 5-stage high volume slotted cascade impactor, model Sierra@ 235. At the operational flow rate of 68 m3 h-’, the cutoff diameters are as follows from the stage 1 to 5 : 7.2, 3, 1.5, 0.95, and 0.49 p m (Willeke, 1975). Curves of collection efficiency of the different stages as a function of particle size are often taken into account to retrieve continuous mass- size distributions from impactor data (Puttock, 1981). Their accuracy is a critical point. As pointed out by Jaenicke and Blifford (1974), calibration artifacts, such as the use of non true monodisperse calibration aerosols, are likely to produce the non-ideal, S-shaped curves observed. Thus, the cut-off diameter was considered as the lower limit size for particle collection on a given stage. A back-up filter collects the smallest particles.
Sampled air volumes ranged between 1000 and
4000 m3, and average wind speeds between 0.1 and 9.9 m s-I. Total elemental concentrations from this sampling system were found to be statistically comparable to concentrations from bulk filter samples. 13 impactor samples were also collected between February 1985 and April 1986, from a 10 m high meteorological tower a t Cape Cavallo, on the Northwestern coast of Corsica (Fig. l), using a 5-stage low volume, circular monojet cascade impactor, model EGAI 80 (flow rate: 0.78 m3 h-I ; cutoff diameters: 8.9, 3.55, 2.1, 1.4, and 0.67 p m (Bergametti et al., 1982)). The sampling site has a n unimpeded view of the sea, is 700 m from the shore and a t a n altitude of about 300 m. 30, 9- to 21-day samples of total deposition were also collected there, using a CRAPAL sampler (Lambert, 1963; Lambert and Nezami, 1965). This is a hemispheric plexiglass collection device, 1 m2 in surface, with a 10 cm-high neck, covered by a 1 mm nylon mesh. Its base is connected to an acid cleaned polyethylene bucket, containing 0.5 1 of deionized Milli-Q@ water acidified to p H 1 with suprapure H N 0 3 . The buckets were kept in darkness dur- ing sampling, and changed about every 10 days. Before removal, the collector was carefully rinsed with 0.5 1 of the H N 0 3 solution. The collected solutions were filtered in a clean atmosphere, on
0.4 p m porosity Nuclepore@ filters, and the particulate and dissolved fractions were analysed for A1 concentrations. Five of these samples of
total deposition occurred during periods with n o precipitation (in July and September 1985, and March 1986).
Flame and flameless atomic absorption spec- troscopy (Na, Al, P b and Cd) and instrumental neutron activation analysis ( N a and Al) were performed on samples from the cruises. Analyti- cal procedures have been published in Dulac et al. (1987). X-ray fluorescence (Elichegaray et al., 1981 ; Losno et al., 1987) was used for A1 analyses of impactor collections from Corsica and of the undissolved fraction of deposition samples. Dis- solved Al was measured in the dry deposition samples by flameless atomic absorption spec- trometry. Analytical precision was typically about 10% for atomic absorption analyses, and
f 5 % for activation and fluorescence analyses. 2.2. Elemental mass-size distributions of aerosol
Total dry deposition rates were often calculated in the past using only the deposition velocity corresponding to the mass-median diameter (MMD) of particles carrying the element con- sidered. Now, it is recognized as essential to con- sider the whole mass-size distributions (MSDs) of the elements in order to calculate deposition fluxes as a sum of partial fluxes from several particle size classes (McDonald et al., 1982; Meszaros, 1982; Dedeurwaerder et al., 1986; Arimoto et al., 1985; Arimoto and Duce, 1986). As elemental MSDs cannot be assessed from direct measurements of dry deposition to surro- gate surfaces, they are generally obtained from cascade impactor sampling.
We have used three different approaches to take the MSDs into account in the dry deposition flux calculations, and to test their influence on the results. The simplest approach is to consider the discrete distribution as directly given by the cascade impactor (“6-step” method) (McDonald et al., 1982; Dedeurwaerder et al., 1986). The other two approaches depend on fitting of this discrete distribution to a continuous one by a regression technique. In a crude approach, the whole distribution was characterized only by its M M D (”1-step” method), while in a refined treatment the fitted distribution was divided into 100 discrete successive size intervals (“ 100-step’’ method), each one corresponding to 1 % of the total elemental mass, and being characterized by
part ides
MODELLING DRY DEPOSITION FROM CASCADE IMPACTOR DATA 365
the diameter of particles at its center D,.5./.,
. . .
DS5%; Arimoto et al., 1985). We assumedmonomodal lognormal MSDs for fitting. This has been approximately verified, using either impactor or other data, for sea-salt (Na, C1) (Woodcock, 1953), soil derived (Al) (Patterson and Gillette, 1977; Buat-Menard et al., 1983), sulfate (S) (Whitby, 1978) and Pb-210 (Arimoto and Duce, 1986) aerosol paticles.
In fact, it is now considered acceptable to approximate aerosols by the sum of three modes, each characterized by a lognormal size distri- bution (Jaenicke, 1985; Giorgi, 1988). These are the so called nucleation, accumulation, and coarse mode, with respective average MMD of about 0.03, 0.5, and 5 pm (Whitby, 1978). The backup filter of the impactor sampler has reasonable collection efficiencies for all particle diameters, and we verified by microscopic examinations that particles of a few tenths of microns in diameter are collected by impactor stage 1 (see Subsection 4.2). However, the limited number of stages and the range of the cut-off diameters unfortunately gives no mean to assess the MSDs in the nucleation size range (D < 0.1 pm) nor in the coarse size range over 10 pm. But we may suppose that the small particles carrying Pb or Cd in our samples come exclusively from the accumulation mode of anthropogenic aerosols, even though Pb and Cd emissions occur mainly in the nucleation mode. This is because, when they reach the sampled area, these pollutants have already been transported far from their continental sources. On the other side, the coarse mode of the atmospheric aerosol is mainly of natural origin, i.e., sea-salt and soil derived particles, and we may consider that Na and Al, tracers of these two types of aerosol particles, are only attached to coarse particles. Patterson and Gillette (1977) have shown the existence of another, coarser mode for soil-derived aerosol particles collected close to the source, during periods of high dust loadings. This mode, with its MMD ranging between 20 and 200 pm, would be characteristic of the parent soil size distribution. But no such extra coarse mode is likely to occur in our atmospheric samples. Indeed the atmos- pheric loadings of soil derived particles are gener- ally less than 15 pg m-3 (maximum observed A1 concentration: 905 ng m-3), and are thus much lower than the mg m-3 loadings for which
Patterson and Gillette reported the presence of an extra coarse mode in the aerosol size distri- bution. Indeed Schutz’ (1979) calculations on aerosol particle transport show that such a sep- arate coarse mode cannot exist far from the sources of particles.
Fitting was performed by least-square linear regression between t and lnD, t being the para- meter of the integrated normal distribution @(t), as given by tables (Van der Waerden, 1967) from the cumulative experimental MSDs, and In D the natural logarithm of the particle diameter. The parameters, MMD and geometric standard devi- ation u, of the fitted lognormal distribution are obtained from the regression equation
t = A I n D + B , (1)
as
A = l/u, (2)
B = -In(MMD)/u. (3)
2.3. Calculation of dry deposition Jluxes
The dry deposition flux (F) of an element can be calculated from the product of its airborne concentration (C) and a dry deposition velocity ( V ) :
F = C V . (4)
Some dry deposition velocities measurements have been obtained from wind-tunnel experi- ments (Moller and Schumann, 1970; Sehmel and Sutter, 1974; Little and Wiffen, 1977) but direct measurements over natural water surfaces are still controversial (Wesely and Williams, 1981 ;
Sievering et al., 1982). Therefore, these velocities are generally calculated using mathematical models (Slinn et al., 1978; Sehmel, 1980; Slinn and Slinn, 1980; Williams, 1982), although large uncertainties still exist, as discussed by Slinn (1983) and Sievering (1984), especially for the smallest aerosol particles, e.g., particles smaller than 1 pm in diameter (Arimoto and Duce, 1986). In this work, dry deposition velocities were calculated using the model of Slinn and Slinn (1980) for deposition of particles on natural waters. Briefly, this model is based on the assumption of two layers over the sea surface. In the upper layer (about 10 m high), the flux of particles is governed by gravitational settling and turbulent transfer. Deposition at the air-sea inter-
366 F. DULAC, P. BUAT-MENARD,
u.
EZAT, s. MELKI AND G . BERGAMETTIface takes place in a viscous sublayer where turbulent transfer is negligible. In this ,layer, hygroscopic particles can grow by humidity absorption. This model assumes a stationary state (constant flux and immediate growth to the equi- librium size for hygroscopic particles entering the lower layer), and spherical particles. It does not take into account the re-emission of particles by the sea surface (Fairall and Larsen, 1984). Cor- rections for particle scavenging by wave breaking and spray formation have already been proposed (Williams, 1982) and discussed (Slinn, 1983). They can be significant for submicrometer size particles (Arimoto and Duce, 1986). However, we have not introduced them here, since they d o not affect the dry deposition rate of large particles. Indeed, large particles will be shown to be a much more important factor controlling the total deposition rate of trace elements. The detailed equations that have been used are reported in the appendix.
The mean wind velocity was considered for each impactor sample, and we used a constant drag coefficient of 0.0013, which corresponds to a steady wind a t 10 m over open waters, near neutral stability of the atmosphere (Kraus, 1972). We assumed a null rate of water evaporation, a density of 2.5 for constant size hydrophobic mineral particles, and a relative humidity of 75 and 90% in the upper and lower deposition layer respectively. Under such conditions, NaCl par- ticle density is respectively 2.1 (dry state) and 1 . 1
(Eriksson, 1959). Their equilibrium radius (D,) is related to their dry radius D, by
D, = 2.3489 D:Oo6'*, ( 5 ) after Fitzgerald (1975; see appendix). Calcu- lations have been performed for Na, Al, P b and Cd, assuming A1 was present in mineral hydro- phobic particles, N a in hygroscopic NaCl par- ticles, and P b and Cd in particles having the same specific gravity and hygroscopic properties than NaCl particles. It might be more realistic to treat Pb- and Cd-rich particles as having properties of (NH,),SO, particles. However, results of dry deposition would not be very differ- ent (see Subsection 4.4).
Using the calculated dry deposition velocities
(&) and the measured elemental concentrations from samples collected at sea, dry deposition fluxes were calculated as follows :
( i ) I-step method: F, = C K(a) V,(MMD) where
K(a) = a?'" O . (7)
K ( o ) is 2 I , and the product K(a) V,(MMD) is the flux-mean deposition velocity for a log- normal size distribution (Slinn, 1983, eq. (160)).
(ii) 6-step method:
, = I 6
where D , = 1 0 pm, D , = 5 pm, D 3 = 2 . 5 pm,
D, = 1.25 pm, D s = 0.75 p m and D, = 0.25 p m
(for impactor stage 1 to 5 and final filter respectively).
(iii) 100-step method:
F , O O = ( C / I ~ O )
1
v d ( D ( , - 0 5 ) o o ) , (9), = I I W
where D,, - o 5,a, is the diameter a t the center of the
size interval i, which particles carry the ith% of cumulated mass of the log-normal MSD, and
C/lOO= C, by definition (see Subsection 2.2). A
consequence of this discrete representation of a lognormal distribution is that we end up dealing with a distribution of particles divided into a finite number of size classes, these sizes ranging between the diameters corresponding to 0.5 and
99.5% of the cumulated mass.
3. Results
Results of elemental mass-size distributions (MSDs) from the 17 impactor samples collected a t sea have been summarized for Al, Na, Cd and P b in Dulac et al. (1987). Mean atmospheric concentrations are given in Table 1 and mean Table 1. Mean atmospheric concentrations and dry deposition fluxes
Mean Mean dry
concentration deposition No. of
Element (ng m-') (pg m-* d-l) samples Na 1,400 30,000 8 Al 340 870 13 Pb 44 1.45 1 1 Cd 0.66 0.064 8 Tellus 41B (19891, 3
MODELLING DRY DEPOSITION FROM CASCADE IMPACTOR DATA 361 c
g
4 0 - E E 3 0 - --
C8
2 0 - 2 --ol -m - L..-
s o:=:c:-:
6 5 4 3 2 1 IMPACTOR STAGE -*- Na concentr. O- A l concentr. -1- Na dry flux -0- A l dry flux -*- Pb concentr. -O- Cd concentr.-I- Pb dry flux
-O- Cd dry flux
Fig. 2. Average influence of mass-particle size distributions on the atmospheric load and on the calculated dry
deposition flux (refer to Table I for respective mean values). Particle size classes from stage I to 6 are respectively: >7.2 pm; 3-7.2 pm; 1.5-3 p m; 0.95-1.5 pm; 0.49-0.95 pm; <0.49 pm,
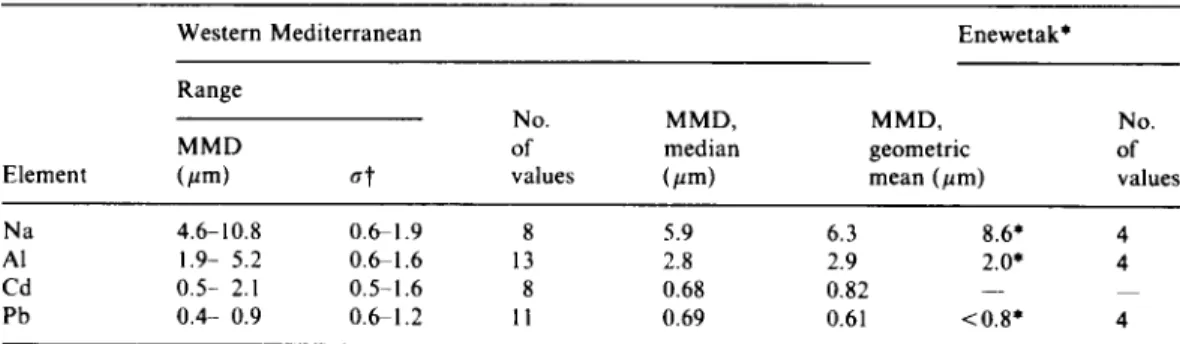
Table 2 . Elemental mass-median diameters ( M M D s ) in the Western Mediterranean and at Enewetak Atoll
Western Mediterranean Enewetak*
Range
No. MMD, MMD, No.
MMD of median geometric of
Element ( pm )
a t
values ( r m ) mean (pm) valuesNa 4.6-10.8 0.61 .9 8 5.9 6.3 8.6* 4
A1 1.9- 5.2 0.6-1.6 13 2.8 2.9 2.0* 4
Cd 0.5- 2.1 0.5-1.6 8 0.68 0.82 ~
Pb 0.4- 0.9 0.6 1.2 11 0.69 0.61 <0.8* 4
*
Tropical North Pacific Ocean; Arimoto et al. (1985).t
u is the geometric standard deviation of the fitted mass-particle size distributions.368 F. DULAC, P. BUAT-MENARD,
u.
EZAT, s. MELKI AND G . BERGAMETTIdistribution profiles in Fig. 2 . As elements are present on each impactor stage, and according to the curves of impaction efficiency (Willeke,
1975; Knuth, 1979), it can be said that elements are present on particles showing wide continuous granulometric distributions. According to the cor- relation coefficients of the least square linear regression, the monomodal lognormal fitting of elemental MSDs was satisfactory a t the 99% probability level for 40 size distributions (8 for
Na, 13 for Al, I 1 for Pb, and 8 for Cd) over the
47 available ones. This was also the case for the
13 spare A1 distributions obtained from the impactor samples collected on the coast of Corsica. A summary of results for the parameters
( M M D and a) of those fitted distributions is given in Table 2 . Table 3 gives a summary of
calculated dry deposition rates using the three methods described above, and results are plotted in Fig. 3.
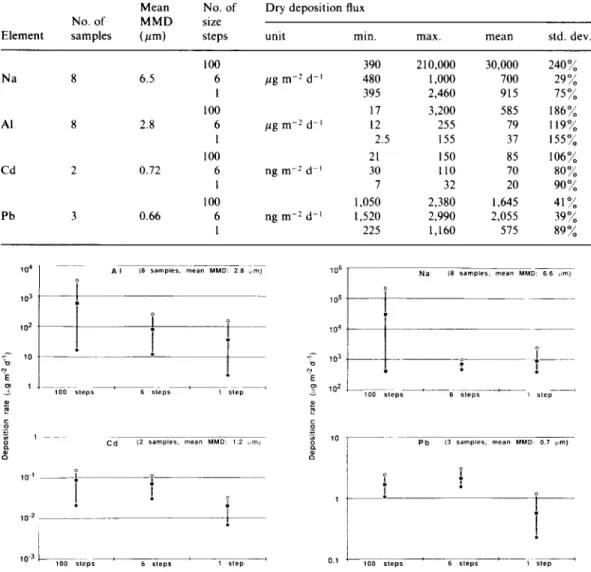
Table 3. Dry deposition fluxes calculated by the three dijjerent size step methods f o r mass-size distribution
characterization (see text)
Mean No. of Dry deposition flux No. of MMD size
Element samples (jim) steps unit min. max. mean std. dev.
100 390 210,000 30,000 240% Na
n
6.5 6 pg m-: d-' 480 1.000 700 29% 1 395 2,460 915 75% A ln
2.8 6 jig m-: d-' 12 255 79 119% 1 2.5 155 37 155% Cd 2 0.72 6 ng m-z d-' 30 I10 70 80% 1 7 32 20 90% 100 1,050 2,380 1.645 41% 100 17 3,200 585 1 8 6 % 100 21 I50 85 106% Pb 3 0.66 6 ng m-l d-I 1,520 2,990 2,055 39% 1 225 1,160 575 89% ~l o 6 N a (8 Sampler mean MMD 6 6 tam)
A I I8 sampler. mean MMO 2 8 , m )
103
1
1
a
I I
m
10'
I+--
~10-3
Lp-~
100 steps 6 r l e p l 1 . I & - 0.1 L X P 6 7steps 1<-Fig. 3. Comparative results of calculated dry deposition rates (0: maximum; W : mean; 0 : minimum; reter to Table 3 for detailed values). Two stages of several impactor samples have been analysed together for a detection limit purpose, so that the 6-step method of flux calculation could not be applied to these samples.
MODELLING DRY DEPOSITION FROM CASCADE IMPACTOR DATA 369 4. Discussion
4 . I . Muss-mediun diameter
The summary of results given in Table 2 shows
that we observed the lowest variability of the M M D for Na (factor 2.3) and the highest for Cd
(factor 4.2). The MMDs which were observed at
Enewetak Atoll by Arimoto et al. (1985) ap-
peared to be less variable, and this could be related to the fact that elemental concentrations are less variable over the remote tropical North Pacific (Buat-MCnard et al., 1983; Arimoto et al., 1985) than over the Western Mediterranean Sea
(Dulac et al., 1987).
It appears also from the comparison between MMDs found over the Western Mediterranean and at Enewetak Atoll (Table 2), that the M M D
of Na is greater in the Pacific. This may be explained by the higher mean wind speed ob- served in that area, 9-10 m s-I (Arimoto et al., 1985), compared to about 4 m s - I for the
Mediterranean samples.
On the other hand, the M M D of Al is 500,;
greater in the Mediterranean samples than in the Pacific samples. This can be ascribed to the proximity of continental sources, which have been shown to influence atmospheric elemental concentration levels over the Western Mediterranean (Dulac et al., 1987). Indeed it can
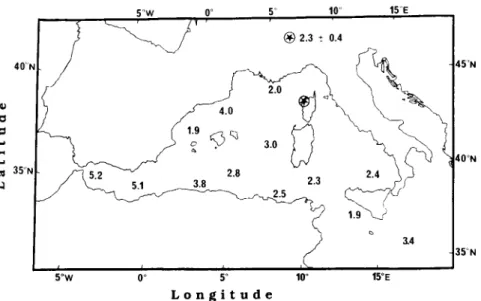
be seen in Fig. 4 that samples showing a M M D of
A1 greater than 3.5 p m were generally obtained close to the African coast. They also correspond to the highest Al atmospheric concentrations
( 2 5 0 0 ng m-3). Air mass trajectory analyses
(Dulac et al., 1987) have indicated that during all
these sampling periods, and only during these periods, did transport events from Africa occur. However, the MMDs of Al observed in Corsica during two similar dust events were respectively equal to 2.0 and 2.3 pm, and thus not different
from values usually oberved there (2.3 4 0.4 pm).
This observation suggests a decrease of the M M D during the transport of mineral aerosol from Africa over the Mediterranean Sea (Fig. 4),
probably due to gravitational settling (en route) of the coarse particle fraction. This argument is supported by the observation that the mean M M D for Al in Corsica (2.3 pm), about 1000 km away from African coasts, is hardly greater than the mean M M D observed at Enewetak Atoll (2.0
pm), about 5000 km away from the nearest
continental sources. Such experimental results are in agreement with calculations of Schiitz (1979),
which predicted that the coarse fraction of aerosol particles during wind-blown dust trans- port events over the tropical North Atlantic should settle during the first 1500 km of trans-
port, and that a further decrease of M M D should
Y W 0” 5” 1 0 15” E
L o n g i t u d e
Fig. 4 . Geographical distribution of observed mass-median diameters of Al.
370 F. DULAC, P. BUAT-MENARD,
u.
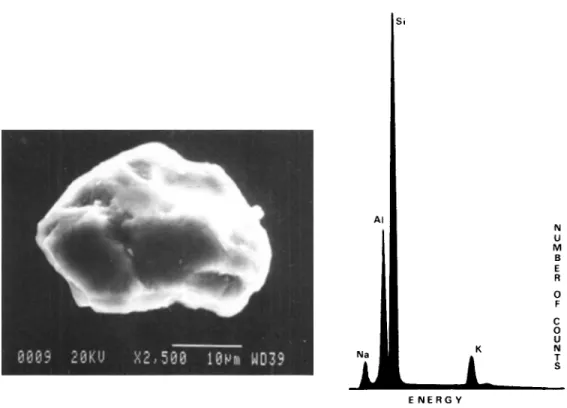
EZAT, s. MELKI AND G . BERGAME~TIbe rather limited. Nevertheless, scanning electron microscopic examinations of Corsican aerosol samples have confirmed the presence of large mineral particles which are a few tens of p m in diameter, and whose contribution to the dry deposition flux is likely to be predominant (Fig. 5).
Considering the proximity of continental sources, it may seem paradoxical that the M M D of P b is lower in the Mediterranean than at Enewetak (Table 2). However this can be ex- plained as follows: half of P b dry deposition fallout a t Enewetak is due to the recycling of P b from the sea surface microlayer by sea-salt par- ticles larger than 7.2 p m (Settle and Patterson, 1982; Arimoto et al., 1985). This recycled com- ponent was found to be negligible in the Western Mediterranean (Dulac et al., 1987), where the concentrations of submicrometer-sized Pb-rich particles are two orders of magnitude higher than over the tropical North Pacific.
4.2. Dry deposition j u x e s
The comparison between dry deposition fluxes calculated by the 3 different approaches shows that the 100-step method generally gives the highest value, and the I-step method the lowest one (Fig. 3). Moreover, the observed ranges and standard deviations (Table 3) indicate that the 100-step method gives more variable results than the other two methods, especially for N a and A1 which have the highest deposition fluxes. The results are much less variable for the pollutant elements, Pb and Cd, which are primarily associated with much smaller aerosol particles.
The highest values obtained using the 100-step method suggest the importance of the largest size fraction. Indeed, the last 1
%
of cumulated mass is generally composed of particles larger than 10 p m in diameter, and sometimes larger than 100 p m for A1 and Na (Table 4), which have very high dry deposition velocities due to gravitational settling. This is illustrated by our results for theAl
K N
Na
E N E R G Y
Fig. 5 . Picture (scale bar: 10 pm) and X-ray spectrum of a large aluminosilicate particle (scanning electron microscopy) from a filter collected on the coast of Corsica during an African dust transport event.
Tellus 41B (1989), 3 N U M 6 E R 0 F C 0 U
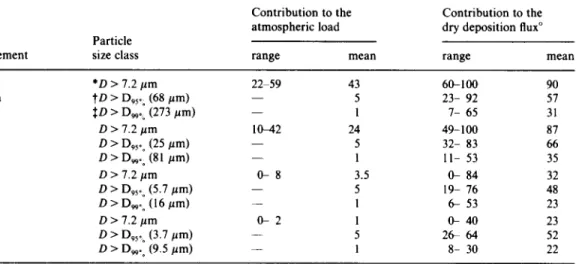
MODELLING DRY DEPOSITION FROM CASCADE IMPACTOR DATA 371 Table 4. Contributions (%) of the largest aerosolparticles to the total atmospheric mass and dry deposition flux of Na, Al, Cd and Pb
Particle
Element size class
Contribution to the Contribution to the
atmospheric load dry deposition flux"
range mean range mean
*D > 7.2 pm
to
> D9s00 (68 rm) $D > Dwso (273 pm) D > 7.2 pm D > D,50e (25 prn) D > Dwoo (81 pm) D > 7.2 pm D > D,,oo (5.7 pm) D > Dwoo (16 pm) D > 7.2 pm D > D,500 (3.7 pm) D > Dwoo (9 5 pm) Na Al Cd Pb 43 5 1 24 5 1 3.5 5 1 1 5 1 60-100 23- 92 7- 65 49- 100 32- 83 1 1 - 53 0- 84 19- 76 6 53 0- 40 26- 64 8- 30 ~ 90 57 31 87 66 35 32 48 23 23 52 22 Calculated using the 100-step granulometric approach (see text).Corresponds to particles collected by cascade impactor stage 1 .
t
Particles of the last 5% of cumulated mass (mean D,, ,-J.$ Particles of the last % of cumulated mass (mean Dw5%).
contributions from the largest particles to atmos- pheric concentrations and dry deposition fluxes (calculated using the 100-step method) presented in Table 4 and Fig. 2. For A1 and Na, particles larger than 7.2 pm represent respectively 10 to 40
and 20 to 60% of the total mass, and appear to account for about 90% of the dry deposition fluxes. Although less than 10% of Pb and Cd are present in this size range, these large particles may be responsible for an average of more than 20% of Pb and 30% of Cd dry deposition fluxes (Fig. 2). These results are in agreement with those found at Enewetak Atoll (Arimoto et al., 1985; Arimoto and Duce, 1986). Moreover, the largest particles accounting for the last 1
%
of the cumulated MSDs are responsible for 20 to 35% of the dry deposition fluxes whatever the element (Table 4). Clearly, this emphasizes the need for a precise knowledge of MSDs for any accurate flux prediction.For Na and Al, however, Arimoto et al. (1985) have verified that measured dry deposition fluxes over a plastic plate are within a factor 3 comparable to the fluxes calculated after the 100-
step method, even for MMDs of more than 10
pm. Such an agreement appears to validate the 100-step granulometric approach. For the present
work, the results of A1 dry deposition fluxes from dry deposition collections on the coast of Corsica also confirm the results from the 100-step granulometric approach (Table 5) and thus the influence of coarse particles on the dry deposition rate. The presence of particles larger than 10 pm in diameter during dust transport from Africa (Fig. 5) has already been observed in Barbados
Table 5 . Elemental dry deposition fluxes in the Western Mediterranean
No. of
Element Units Range Mean values
Na* mgm-* d-I 0.4- 208 30 8 Al* p g m-* d-l 17 4 5 5 0 870 13 Al" p g m - Z d-l 390 -2700 1090 5 Cd* ngm-* d-l 0.2- 175 64 8 Pb* ng m-* d-l 460 -2400 1450 1 1 0.4-
1st
4.6 7 tMeasured from sampling on the Northwestern coast of Corsica.
Calculated using the Slinn and Slinn (1980) deposition model, applied to 100 size intervals stepped lognormal mass-size distributions.
The high value of 208 mg m-* d-l discarded from above results.
372 F. DULAC, P. BUAT-MENARD,
u.
EZAT, s. MELKI AND G . BERGAMETTI(Prosper0 et al., 1970). Moreover, microscopic investigations of the collection surface of im- pactor stage 1 of two different samples (1 1 and 17 (see Fig. l), a case of pollution aerosol and a case of Saharan dust respectively) have also shown the presence of large aluminosilicate particles, with equivalent diameters up to 90 pm.
These considerations demonstrate that the use of the single dry deposition velocity for the MMD (I-step method) is definitely not accurate enough to calculate realistic dry deposition rates, and that the whole mass-size distribution has to be considered. For pollutant elements Pb and Cd, the deposition fluxes simply calculated using the 6-step method without fitting are roughly the same as the fluxes obtained using the 100-step method.
4.3. Dry deposition velocities
In Table 6 are summarized the results of mean elemental dry deposition velocities (&*) inte- grated over the entire MSDs, deduced from flux calculations using the 100-step method, by the reciprocal relationship
Vd* = F , , , / C . (10)
The mean dry deposition velocity of Na ranges from 1 to 9 cm s-I, except for a very high value of 190 cm s-l which corresponds to an unusual
MMD of 10.8 pm. Such a value is not unrealistic, but in this case the lognormal fitting, which involves atmospheric particles of more than
1 mm in diameter, is questionable, although the probability of the fit is more than 99.9%.
The mean dry deposition velocity of A1 is also generally about 1 cm s-*, and ranges from 0.2 to
10 cm s-I. In addition to these very large variations, there is a clear separation between low and high dust concentration periods, the averages being 0.87 and 3.9 cm s-l respectively.
Such variations are correlated with large changes in the MMD of Al: corresponding meansf standard deviations are 2.5 f 0.5 and 4.5 0.7 pm respectively. This variability suggests that the influence of African dust episodes on mean A1 atmospheric concentrations over the basin is even greater on mean A1 dry deposition rates. Moreover this shows again the necessity to have a good assessment of MSDs for both A1 and Na. Dry deposition velocities measured from the Corsican samples are also presented in Table 6. The observed values range from 1.3 to 6.9 cm s-l,
and thus calculated and measured values are consistent.
Despite the presence of a non-negligible com- ponent of Pb and Cd in the coarse fraction of the aerosol, the calculated dry deposition velocities of these elements are one order of magnitude lower than those of A1 and Na, generally lower than 0.1
cm s-I (Table 6). The size of the largest particles of the MSDs for Pb and Cd is much smaller than those of A1 and Na (Table 4). This probably explains the differences found between the calculated mean dry deposition velocities of these elements.
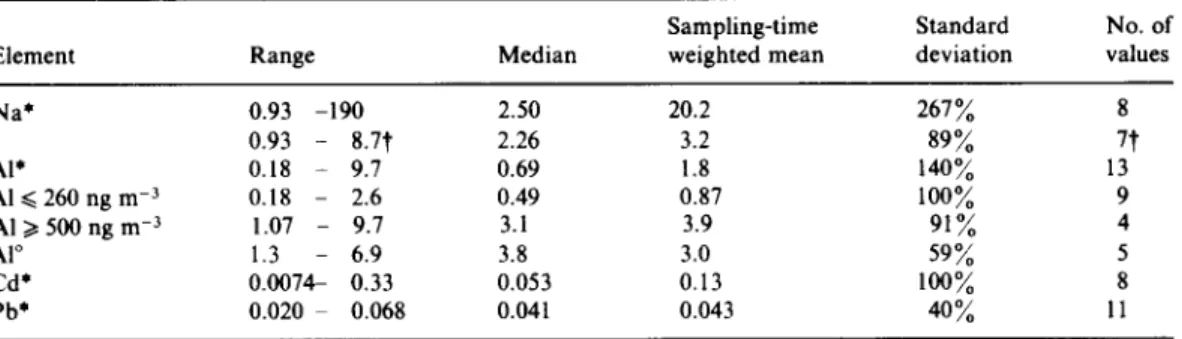
Table 6. Elemental dry deposition velocities (cm s-I) in the Western Mediterranean
Sampling-time Standard No. of
Element Range Median weighted mean deviation values
Na* 0.93 -190 2.50 20.2 267% 8 Al* 0.18 - 9.7 0.69 1.8 140% 13 0.93 - 8.7t 2.26 3.2 89 % 7t Al
<
260 ng m-3 0.18 - 2.6 0.49 0.87 100% 9 A 1 2 500 ng rn-) 1.07 - 9.7 3.1 3.9 91 % 4 Al" 1 . 3 - 6.9 3.8 3.0 59 % 5 Cd* 0.0074- 0.33 0.053 0.13 100% 8 Pb* 0.020 ~ 0.068 0.041 0.043 40 % 1 1Measured from sampling on the Northwestern coast of Corscia.
Calculated using the Slinn and Sinn (1980) deposition model, applied to 100 size intervals stepped lognormal
t
The high value of 190 cm S-I discarded from above results.mass-size distributions.
MODELLING DRY DEPOSITION FROM CASCADE IMPACTOR DATA 373
4.4. Uncertainties
Despite the apparent agreement between ob- servations and calculations using the 100-step method, in this work for A1 (Tables 5 and 6), and in Arimoto et al. (1985) for a few elements such as Al, Na, Mn, V, . . . it is crucial to assess the uncertainties of such a dry deposition modelling approach. First it is clear from (9) that the calculated total dry deposition flux
Floe
(or from (lo), the integrated dry deposition velocity V*) is just the mean of the 100 different values calculated respectively for the 100 different size steps. As noticed in 2.3, although normal distributions are mathematically infinite, the range of particle size contributing to the calculated dry deposition is in fact limited by DO5"$ and D B 5 ? ; , due to the stepping of the MSDs. But these limits are simply due to the choice of a 100 size interval stepping of the MSDs. Indeed the limits would beDie;
and D,, with a 50 size interval stepping, in which each size step would correspond to particles carrying no longer 1, but now 2% of the total mass of the element. These limits would be D o 2 5 , and D,7504 with a 200 size interval stepping, each size step corresponding to particles carrying 0.5% of the total mass. It could seem at first glance that D,s,
is not very different from D,, or D,.7570. However, significant differences are found which can influence the integrated calculated deposition rate. This is because such percentages of the cumulated mass correspond to the large size tail of the lognormal distribution, where the slope of the distribution as a function of particle size is very low. Moreover, the related changes in dry deposition velocities are proportional to the square of the changes in particle diameter, as we are in the size range for which gravitational settling controls dry deposition. So if the number of intervals for the stepping is changed, this will modify even more the largest deposition vel- ocities taken into account for individual size steps, and so their average will change. For instance let us consider a reference A1 case with the following mean conditions : concentration =340 ng m-3; MMD=3.1 pm; Q = 1.2; specific
gravity = 2.5; wind speed = 4 m s - l . The particle
diameters corresponding to particles at the ends
of the lognormal MSD are the following: Dos% =
0.141 pm; D,,=O.190 pm; D,,=50.57 pm; and D,,>% = 68.13 pm. If we apply a 50 size
interval stepping to this distribution for dry deposition calculation, i.e., if the size range of the distribution i s reduced from 0.14-68.1 pm to 0.19-50.6 pm, we average deposition velocities between 0.0055 and 19.4 cm s - l , instead of values
between 0.0067 and 35.2 cm s-I. Finally, the resulting total flux or apparent velocity for dry deposition is reduced by a factor of about 2.2. So
this is an important source of uncertainty, as we actually cannot decide where to put the cut-off on the large size tail of the lognormal MSDs of the elements, nor whether they are really lognormal over 10 pm in diameter.
Unfortunately, geochemists have no other practical means than using cascade impactor samplers to retrieve elemental MSDs, although it is recognized that these devices are far from being perfect samplers. For instance, sampling artifacts such as mineral particle bouncing on the impaction surfaces have been seriously con- sidered (Walsh et al., 1978; Knuth, 1979; Buat- Mtnard et al., 1983). This can produce a shift in the apparent particle sizes and in the spreading of size distributions, which would lead to an underestimation of MMDs and to an overesti- mation of standard deviations of the MSDs. Also the true collection efficiencies of the different impactor stages as a function of particle size are generally poorly known because of calibration artifacts (Jaenicke and Blifford, 1974), because they depend on the aerodynamic size and density of particles and because atmospheric particles are very inhomogeneous. Moreover the sampling is not isokinetic. This may have important conse- quences on the overall collection efficiency of the sampler, which can be variable as a function of particle size. Unfortunately, we are not able to assess the MSD uncertainties resulting from these experimental biases, in order to deduce uncer- tainties in dry deposition calculations. However, we have performed several tests in order to discuss these final uncertainties. We shall mainly focus on Al, since we can compare calculated dry deposition rates to those measured using a surro- gate surface.
Considering that the cascade impactor was inadequate for assessing A1 MSDs, due to bounce-off effects of mineral particles, we have assumed that the MSD of A1 was constant throughout the samples. Further, A1 was assumed to be attached to particles from the coarse mode
374 F. DULAC, P. BUAT-MENARD, u . EZAT, s. MELKI AND G. B E R G A M E ~ I of the atmospheric aerosol particles, character-
ized by MMD = 6.8 pm and a = 0.8, following Giorgi’s (1988) hypothesis. The calculated A1 dry deposition fluxes F,oo ranged from 55 to 935 pg m-* d-l, with a mean value of 350 pg m-* d-l. This is roughly comparable to values calculated from impactor data (Table 5). However, for each sample, the ratio between the flux calculated with a constant MSD and the flux calculated from impactor data ranges from 0.12 to 6.4.
Although individual results can be very different, it seems however that, on the average, the sup- posed spreading of the distributions (higher observed a) compensates the supposed shift towards a lower MMD.
Finally, this constant MSD hypothesis gives a very stable apparent A1 dry deposition velocity of
1.18-1.26 cm s-l. This suggests that wind speed and concentration have a minor influence on the model outputs compared to granulometric para- meters (MMD and a). To test the sensitivity of
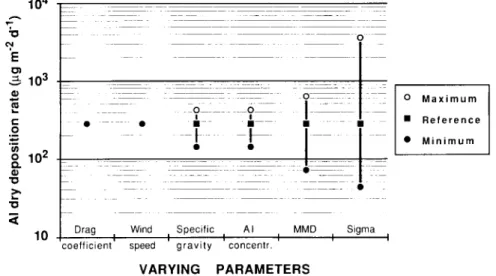
the results to the different parameters used in the model calculations (see Appendix), we considered the dry deposition flux for the above character- ized reference A1 case, and compared the calculated fluxes assuming a variation of f 50% for each of the 5 listed parameters (atmospheric concentration, MMD, a, specific gravity, and
wind speed) plus the drag coefficient. The respective induced changes in the calculated fluxes are plotted in Fig. 6. They show that variations in the drag coefficient and wind speed have a negligible influence on the result (changes <f3%). Variations in the calculated A1 flux have been found to be proportional to the changes in A1 concentration and in the specific gravity of aluminosilicate particles, and roughly proportional to the square of the changes in MMD. This is because gravitational settling is the dominant deposition process for Al. Never- theless, it is clear that the +SO% variation in a has by far the greatest effect on the calculated flux. Indeed, the ratio found between the maximum and minimum calculated flux is about 85, i.e., one order of magnitude higher than the ratio found for a variation of & 50% in MMD.
For Pb, uncertainties due to the *SO% vari- ation in drag coefficient and wind speed are more significant (< f 2079, but still negligible com- pared to the effect from variation in u. We have also investigated the influence of considering Pb to be attached to hygroscopic particles with properties of (NH,)*SO, particles (dry specific gravity = 1.8; wet specific gravity = 1.1; see Fitzgerald (1975) for the equilibrium size of par- ticles as a function of the relative humidity). Dry
0 M a x i m u m
R e f e r e n c e
M i n i m u m
Drag Wind Specific A l MMD Sigma
U
coefficient‘ speed ’ g r a v i t y concentr ’
VARYING P A R A M E T E R S
Fig. 6. Range of variation of the A1 dry deposition flux F,oo (see text) assuming 50% variations of the six main parameters of the model successively. Reference case: drag coefficient = 0.013; wind speed = 4 m s-l ; specific
gravity = 2 . 5 ; A1 concentration = 340 ng m-’; M M D = 3.1 pm; u = 1.2.
MODELLING DRY DEPOSITION FROM CASCADE IMPACTOR DATA 375
deposition fluxes of Pb were found to be lower by only 2 W O % than when properties of NaCl par- ticles were considered for Pb-rich particles.
This demonstrates that u is definitely the most sensitive parameter of this dry deposition model, whatever the element considered. This will be particularly critical for Na and Al, as there is only one impactor stage sampling particles larger than 7.2 pm in diameter, making it tricky to characterize the MSDs in the size range which controls dry deposition.
Given such an influence, it is worth discussing if a k 50% error in CT is realistic. We verified that analytical uncertainties in the elemental concen- trations from each impactor stage may induce changes of more than 10% in the u of the fitted distribution (with equivalent probability of fitting), while related changes in MMD are much smaller. Moreover the fitting itself has a statisti- cal uncertainty. According to York (1969), the standard error in the regression coefficient A
from (1) may be approximated by:
where n is the number of points to fit, and A and B the coefficients of the regression equation (1)
(see Subsection 2.2). After ( 2 ) , u and A have the same relative errors :
S(u)/a = S ( A ) / A . (12) Using (11) and (12), it appeared from our data that the average relative statistical errors in u, resulting only from the MSD fitting, are about
lOk5% for all of Na, Al, Pb and Cd. Thus,
cumulated with analytical uncertainties, the use of a perfect impactor sampler may still result in an error of +25% in the u of the recovered distributions. Further, it seems quite plausible that the non-ideal characteristics of the sampler may lead to an equivalent error, in particular for dust particles because of possible bouncing.
5. Conclusions
Three different methods to characterize ele- mental mass-particle size distributions (MSDs)
have been used for calculations of elemental dry deposition fluxes in the Western Mediterranean. The comparison between results has shown the major role played by large particles ( D > 7.2 pm) in controlling the dry deposition of atmospheric particles. Direct measurements of A1 dry depo- sition agree best with the values predicted by the third approach, in which the total deposition fluxes are calculated as the sum of the partial fluxes due to particles from 100 successive size intervals.
Despite large uncertainties due to the imper- fect knowledge of elemental mass-size distri- butions, and given the rather good agreement between direct measurements of deposition to a surrogate surface and model calculations, we used average dry deposition rates calculated using the 100-step method (Table 1) to estimate the elemental dry deposition fluxes to the Western Mediterranean Sea on a yearly time scale. On the basis of 360 days of dry deposition, yearly inputs per mz to the Western Mediterranean would be 320 mg of Al, 0.52 mg of Pb and 0.023 mg of Cd. The total amount of A1 collected during the year of total deposition sampling in Corsica was 970 mg m-2. By comparison, it appears that dry deposition would account for a third of the total A1 deposition in the Western Mediterranean Sea. This fraction is two times higher than the one found over the remote tropical North Pacific (Arimoto et al., 1985), and would confirm the influence of African sources on the dry deposition of A1 in the Western Mediterranean.
However, it appears that the model calcu- lations may have uncertainties of more than one order of magnitude, due to the high sensitivity of the dry deposition rate to the largest particles, and to the use of imperfect cascade impactor samplers. This work points out that geochemists do not have available samplers adequate to char- acterize atmospheric mass-particle size distri- butions of elements in order to assess precisely their dry deposition rates to the sea from atmos- pheric measurements. An ideal sampling device should allow the fitting of elemental size distri- butions in the nucleation, accumulation and coarse modes, i.e., over four orders of magnitudes in particle size. It should also allow the determination of low atmospheric concentra- tions, as are often found over remote marine areas, on sampling time scales of a day or less.
376 F. DULAC, P. BUAT-MENARD,
u. EZAT,
s. MELKI AND G . BERGAMETTI6.
Acknowledgements
We wish to thank the staffs of R/V Le Noroit, Le Suroit and Le Cornide de Savedra, and of the signal station of Cape Cavallo for their logistical support during the cruises and in Corsica. We also thank the French Marine Nationale for the free access to the signal station, and the French Direction de la MCteorologie Nationale, Ministere des transports, for the use of the meteorological tower at Cape Cavallo. We are grateful to G. Revel, R. Delmas, D. Nau, and
M.
Piedalu from the Laboratoire Pierre Sue d'Analyse par Activation at Saclay, for assistance and the use of facilities in activation analyses, to C. E. Lambert, H. Cachier, B. Chatenet, E. Remoudaki, M. Arnold, L. Comes, N. Risler, A. Seghaier and A. Vigot for their assistance in sampling and analysis. We are particularly grate- ful to W. F. Fitzgerald and D. Sutton for review- ing our manuscript. Constructive comments and criticisms by two anonymous reviewers are gratefully acknowledged. This work was sup- ported by the Centre National de la Recherche Scientifique, the Commissariat a 1'Energie Atomique, and IFREMER. This is C.F.R. con- tribution No. 925.7.
AppendixThe formulation used for our dry deposition velocity calculations, after the two layer model of dry deposition of particles on natural waters of Slinn and Slinn (1980) is given in this appendix. The CGS unit system is used throughout. In the basic equation, the overall resistance to dry deposition is considered as a combination in series of the resistance to deposition in each of the two layers of the model, minus a term due to gravitational settling:
where
V,, : dry deposition velocity of the particle;
l/Kc: resistance to deposition in the constant flux layer;
l/Kd: resistance to deposition in the deposition layer;
V , : Stefan velocity of the particle, due to the upward flux of evaporated water
(Waldmann and Schmitt, 1966; Vittori and Prodi, 1967);
gravitational settling velocity of the particle, calculated after the Stokes approximation ;
diameter of the dry particle.
V, :
D, :
(14) to (16) respectively:
The terms K , , K , , V , and V, are given by eqs.
K , = Cd U/(l - k)
+
V , ( D d ) - V,, (14) where the three terms account respectively for turbulence, gravity, and evaporation;Kd = C, U(SC-"'
+
10-3'S')/k+
V,(D,) - V,, (15)where the four terms account respectively for Brownian diffusion, impaction, gravity, and evaporation; V , = E/d, (16) (17) (174 V&DJ = 2 g D W , - d,)/(9 0 d,) z 1.21 1 lo6 Dx2 dx, with k = U : s c : St: E : da : g =
c,
: U = D , : d , : X:0.4: Von Karman constant; drag coefficient;
mean wind speed at the reference height
Schmidt number; Stokes number;
rate of water evaporation; air specific gravity;
981 cm s 2 : acceleration of gravity;
0.15 cm2 S K I : kinematic viscosity of air at
about 20°C and 1 atm;
diameter of the particle in the state x (see after);
specific gravity of the particle in the state x
(see after);
index of state of the particle; all particles are dry (x = d) in the upper layer; in the deposition layer, hygroscopic particles become wet (x = w), while hydrophobic particles remain dry.
(10 m);
The value of the Schmidt number is given by
Sc = u/Bd, (18)
where
B, : Brownian diffusivity of the particle in the deposition layer; it may be expressed as a
MODELLING DRY DEPOSITION FROM CASCADE IMPACTOR DATA 377
function of the particle diameter (p. 63 in Davies, 1966) :
Bd = {0.238/0,} { 1
+
163 103/D,+
548 lO*/[D, exp(6.66 lo6 D , ) ] } . (19)The Stokes number is calculated by
St = C, U 2 Vg(D,)/g I ) . (20)
Finally, the wet particle diameter in the deposition layer depends on the relative humidity
of the air. For soluble NaCl particles, the equilib-
REFER
Arimoto, R., Duce, R. A,, Ray, B. J. and Unni, C. K. 1985. Atmospheric trace elements at Enewetak Atoll, 2, Transport to the Ocean by wet and dry deposition. J. Geophys. Res. 90, 2391-2408.
Arimoto, R. and Duce, R. A. 1986. Dry deposition models and the air/sea exchange of trace elements. J. Geophys. Res. 91, 2787-2792.
Bergametti, G., ViC Le Sage, R., Grubis, B., Dulieu, B. and Elichegaray, C. 1982. Relation between par- ticulate concentration in the atmosphere and aerosol collection efficiency. Enuiron. Tech. Lett. 3,
Bergametti, G., Dutot, A., Buat-Menard, P., Losno, R.
and Remoudaki, E. 1989. Seasonal variability of the elemental composition of atmospheric aerosol par- ticles over the Northwestern Mediterranean. Tellus
Buat-Menard, P., Ezat, U. and Gaudichet, A. 1983. Size distribution and mineralogy of alumino- silicate dust particles in Tropical Pacific air and rain. In Precipitation scavenging, dry deposition,
and resuspension 2 (eds. H. R. Pruppacher, R. G.
Semonin and W. G. N. Slinn). New York: Elsevier,
Coale, K. H. and Bruland, K. W. 1985. Th-234:U-238 disequilibria within the California current. Limnol. Oceanogr. 30, 22-33.
Davies, C. N. 1966. Aerosol science. New York: Academic Press, 468 pp.
Dedeurwaerder, H. L., Dehairs, F., Qian, X. and Nemery, B. 1986. Heavy metal transfer from the atmosphere to the sea in the southern bight of the North Sea. In Proceedings of Progress in Belgian Oceanographical Research, Brussels, March 1985. University of Antwerp, 17&177.
Dulac, F., Buat-Mtnard, P., Arnold, M., Ezat, U. and Martin, D. 1987. Atmospheric input of trace elements to the Western Mediterranean Sea: 1. Factors controlling the variability of atmospheric concentrations. J. Geophys. Res. 92, 8437-8453. Elichegaray, C., Vie Le Sage, R., Grubis, B. and Colin.
J. L. 1981. Analysis of atmospheric particles by X-ray 297-304.
4 1 8 , 353-361.
1259-1269.
rium size D, is calculated as a function of the dry diameter of the particle D,, using the relation given by Fitzgerald (1975): D , = 1.62 a (Dd/2)* a = exp[66 R,/(1.058 - Rh)] (22) b = exp[77 R,/(1.009 - R,)]. (23) (21) where
Rh: relative humidity, ranging from 0.81 to 0.97.
ENCES
fluorescence: determination of correction factors (in French). Analusis 9, 492497.
Eriksson, E. 1959. The yearly circulation of chloride and sulfur in nature ; meteorological, geochemical and pedological implications. Part 1. Tellus 11, 375- 403.
Fairall, C. W. and Larsen, S. E. 1984. Dry deposition, surface production and dynamics of aerosols in the marine boundary layer. Atmos. Enuiron. 18, 69-77. Fitzgerald, J. W. 1975. Approximations formulas for
the equilibrium size of an aerosol particle as a function of its dry size and the ambient relative humidity. J. Appl. Meteor. 14, 10441049.
GESAMP (Joint Group of Experts on Scientific Aspects of Marine Pollution) 1985. Atmospheric trans-
port of contaminanis into ihe Mediterranean region. Reports and Studies GESAMP 26, World Meteoro- logical Organization 53 pp.
Giorgi, F. 1988. Dry deposition velocities of atmos- pheric aerosols as inferred by applying a particle dry deposition parametrization to a general circulation model. Tellus 4 0 8 , 2 3 4 1 ,
Hicks, B. B., Wesely, M. L. and Durham, J. L. 1980. Critique of methods to measure dry deposition. Work- shop summary EPA 1600/9-80-050, Environmental Protection Agency, Research Triangle Park, North Carolina, 70 pp.
Jaenicke, R. 1985. Aerosol physics and chemistry. In Numerical data and functional relationships in science and technology V , 46 (ed. G. Fischer). Berlin: Springer-Verlag, 391457.
Jaenicke, R. and Bliffordm I. H. 1974. The influence of aerosol characteristics on the calibration of impactors. Aerosol Sci. 5, 457464.
Knuth, R. H. 1979. Calibration of a modified SIERRA model 235 slotied cascade impactor. Report of the Environmental Measurement Laboratory, National Technical Information Service, U.S. Department of Commerce, Springfield, Va., 24 pp.
Kraus, E. B. 1972. Atmosphere-ocean interactions. Oxford: Clarendon Press, 275 pp.
Lambert, G . 1963. Siudy of man-made radioactive
378 F. DULAC, P. BUAT-MENARD, u . EZAT, s. MELKI AND G. BERGAMETTI aerosols: application to a rmospheric circulaiion prob-
lems (in French). Report CEA R-2347, Commissariat a I’Energie Atomique, Paris, 227 pp.
Lambert, G . and Nezami, M. 1965. Dry deposition in the lead-210 cycle (in French). Annal. Geophys. 21,
Little, P. and Wiffen, R. D. 1977. Emission and deposition of petrol engine exhaust P b - I . Depo- sition of exhaust Pb to plant and soil surfaces. Armos. Environ. I l , 4 3 7 4 4 7 .
Losno, R., Bergametti, G . and Mouvier, G . 1987.
Determination of optima conditions for atmospheric aerosol analyses by X-ray fluorescence. Environ. Tech.
h r r . 8, 77-87.
Loye-Pilot, M. D., Martin, J . M. and Morelli, J . 1986. Influence of Saharan dust on the rain acidity and atmospheric input to the Mediterranean. Nature 321,
4 2 7 4 2 8 .
McDonald, R. L., Unni, C. K. and Duce, R. A. 1982. Estimation of atmospheric sea salt dry deposition: wind speed and particle size dependence. J . Geophys. Res. 8 7 , 1246-1250.
Meszaros, E. 1982. On the atmospheric input of sulfur into the ocean. Tellus 34, 277-282.
Moller, U. and Schumann, G. 1970. Mechanisms of transport from the atmosphere to the earth’s surface. J. Geophys. Res. 75, 3013-3019.
Patterson, C. C. and Gillette, D. A. 1977. Common- alities in measured size distributions for aerosols having a soil-derived component. J. Geophys. Res. 82,
2074-2082.
Prospero, J. M. Bonatti, E., Schubert, C. and Carlson,
J. N. 1970. Dust in the Caribbean atmosphere traced to an African dust storm. Earth Planer. Sci. Leu. 9 ,
Puttock, J . S. 1981. Data inversion for cascade impactors: fitting sums of log-normal distributions. Atmos. Environ. 15, 1709-1716.
Schiitz, L. 1979. Saharan dust transport over the North Atlantic Ocean : model calculations and measure- ments. In Saharan dusr : mobilization, iransporr. deposition (ed. C. Morales). Scope Report 14. Chichester: Wiley, 233-242.
Sehmel, G. A. 1980. Particle and gas dry deposition: a review. Armos. Enoiron. 14, 983-101 I .
Sehmel, G . A. and Sutter, S. L. 1974. Particle deposition rates on a water surface as a function of particle diameter and air velocity. J. Rech. Armos. 8,
Settle, D. M. and Patterson C. C. 1982. Magnitudes and sources of precipitation and dry deposition fluxes of natural and industrial leads to the North Pacific at Enewetak. J. Geophys. Res. 87, 8857-8869.
245-251.
287-293.
91 1-920.
Sievering, H. 1984. Small-particles dry deposition on natural waters: modeling uncertainty. J. Geophys. Res. 89, 9679-9681.
Sievering, H., Eastman, J . and Schmidt, J. A. 1982. Air-sea particle exchange at a near-shore oceanic site. J. Geophys. Res. 87, 127-137.
Slinn, W. G . N. 1983. Air to sea transfer of particles. In Air-sea exchange of gases and parficles (eds. P. S . Liss and W. G . N. Slinn). N.A.T.O. AS1 Series. Dordrecht, Holland: Reidel, 299-396.
Slinn, S . A. and Slinn, W. G . N. 1980. Prediction for particle deposition on natural waters. Armos. Environ.
Slinn, W. G. N., Hasse, L., Hicks, B. B., Hogan, A. W., Lal, D., Munnich, K . E., Sehmel, G . A. and Vittori, 0. 1978. Some aspects of the transfer of atmospheric trace constituents past the air-sea inter- face. Aimos. Environ. 12, 2055-2087.
Uematsu, M., Duce, R. A. and Prospero, J. M. 1985. Deposition of atmospheric mineral particles in the
North Pacific Ocean. J . Armos. Chem. 3, 123-128. Van der Waerden, B. L. 1967. Mathematical sratistics
(in French). Paris: Dunod, 371 pp.
Vittori, 0. and Prodi, V. 1967. Scavenging of atmos- pheric particles by ice crystals. J. Armos. Sci. 24, 533-
538.
Waldmann, L. and Schmitt, K. H. 1966. Thermo- phoresis and diffusiophoresis of aerosols. In Aerosol Science (ed. C. N. Davies). New York: Academic Press, 137-162.
Walsh, P. R., Rahn, K. A. and Duce, R. A. 1978. Erroneous elemental mass-size functions from a high volume cascade impactor. Armos. Environ. 12, 1793-
1795.
Wesely, M. L. and Williams, R. M. 1981. Eddy corre- lation measurements of particle fluxes over Lake Michican. In Annual Reporf of ihe Argonne Narional Laboratory. Argonne National Laboratory, Radio- logical and Environmental Division, Argonne, Illinois, 3 6 3 8 .
Whitby, K. T. 1978. The physical characteristics of sulfur aerosols. Armos. Enoiron. 12, 135-159. Willeke, K . 1975. Performance of the slotted impactor.
Am. Ind. Hyg. Assoc. J . 36, 6 8 3 4 9 1 .
Williams, R. M. 1982. A model for the dry deposition of particles to natural water surfaces. Armos. Environ.
Woodcock, A. H. 1953. Salt nuclei in marine air as a function of altitude and wind force. J. Mefeorol. 10,
York, D. 1969. Least squares fitting of a straight line with correlated errors. Earfh Planer. Sci. Letters 5 ,
32C324.
14, 1013-1016.
16, 1933-1938.
362-371.