HAL Id: hal-02975814
https://hal.archives-ouvertes.fr/hal-02975814
Submitted on 14 Jun 2021
HAL is a multi-disciplinary open access
archive for the deposit and dissemination of
sci-entific research documents, whether they are
pub-lished or not. The documents may come from
teaching and research institutions in France or
abroad, or from public or private research centers.
L’archive ouverte pluridisciplinaire HAL, est
destinée au dépôt et à la diffusion de documents
scientifiques de niveau recherche, publiés ou non,
émanant des établissements d’enseignement et de
recherche français ou étrangers, des laboratoires
publics ou privés.
the Past 7,000 Years
Hongxi Pang, Shugui Hou, Wangbin Zhang, Shuangye Wu, Theo Jenk, Margit
Schwikowski, Jean Jouzel
To cite this version:
Hongxi Pang, Shugui Hou, Wangbin Zhang, Shuangye Wu, Theo Jenk, et al.. Temperature Trends
in the Northwestern Tibetan Plateau Constrained by Ice Core Water Isotopes Over the Past 7,000
Years. Journal of Geophysical Research: Atmospheres, American Geophysical Union, 2020, 125 (19),
�10.1029/2020JD032560�. �hal-02975814�
Over the Past 7,000 Years
Hongxi Pang1 , Shugui Hou1,2 , Wangbin Zhang1, Shuangye Wu3 , Theo M. Jenk4,5, Margit Schwikowski4,5 , and Jean Jouzel6
1Key Laboratory of Coast and Island Development of Ministry of Education, School of Geography and Ocean Science, Nanjing University, Nanjing, China,2School of Oceanography, Shanghai Jiao Tong University, Shanghai, China, 3Department of Geology, University of Dayton, Dayton, OH, USA,4Laboratory of Environmental Chemistry, Paul Scherrer Institute, Villigen, Switzerland,5Oeschger Centre for Climate Change Research, University of Bern, Bern, Switzerland,6Laboratoire des Sciences du Climat et de l'Environnement, UMR8212, CEA‐CNRS‐UVSQ/IPSL, Gif‐sur‐Yvette, France
Abstract
The reasons for the Holocene temperature conundrum, known as the inconsistency between the reconstructed cooling and the inferred warming simulations during the Holocene, remain unclear. Temperature reconstructions from the Tibetan Plateau (TP) provide important insights for understanding the Holocene temperature conundrum due to enhanced sensitivity to climate at high altitudes. Given the significant positive correlation between air temperature and δ18O in precipitation over the northern TP, the stable isotopic records of ice cores recovered from this area are widely used for paleotemperaturereconstruction. Here we present a new high‐resolution δ18O record from the Chongce ice cores to bedrock, dated back to 7 ka BP by the accelerator mass spectrometry (AMS)14C dating technique. Our reconstructed temperature record shows a long‐term warming trend until ~2 ka BP, followed by an abrupt change to a relatively cool period until the start of the industrial‐era warming. This record challenges the widely recognized Holocene reconstruction from the neighboring Guliya ice core. It is also different from many previous temperature reconstructions, most of which have summer biases and show a long‐term cooling trend over the past two millennia. In addition, our record shows that temperatures during the recent decades are almost the highest during the past 7 ka BP, highlighting the unusual warming forced by anthropogenic greenhouse gases.
1. Introduction
The Tibetan Plateau (TP) has experienced pronounced warming during recent decades (e.g., An et al., 2016; Guo & Wang, 2012; Kang et al., 2007; Liu & Chen, 2000; Tian et al., 2006). The warming rate is faster than in most other low‐elevation regions due to the elevation‐dependent warming, that is, amplified warming rate with elevation (Mountain Research Initiative EDW Working Group, 2015; Wang et al., 2014). This has led to extensive retreat and thinning of glaciers as well as permafrost thaw, with significant implications for the hydrological cycle, water resources, ecosystem, and geohazard risks in the TP and its surrounding areas (Yao et al., 2012, 2019).
Understanding climate response to external forcings and related feedbacks during the present interglacial (i.e., the Holocene) is essential for future climate projections, particularly when results are inconsistent from climate models and reconstructions from climate proxies. Climate models simulate a warming trend during the Holocene (Liu et al., 2014), while a generally global cooling was inferred for the same period in the proxy reconstructions, mostly from marine sediment cores (Marcott et al., 2013). This disparity is referred to as the “Holocene temperature conundrum” (Liu et al., 2014). The exact reasons for the Holocene temperature conundrum remain unclear, but possible causes including seasonal bias in the proxy reconstructions (e.g., underrepresentation of winter proxies) (Baker et al., 2017; Meyer et al., 2015) and uncertainties in current climate models (e.g., incomplete forcing and underestimated sensitivities) (Liu et al., 2014, 2018; Zhang, Renssen et al. 2018) have been proposed. Some studies show that the warming trends were limited to regions where the cooling forced by the remnant continental ice sheets (the Fennoscandia ice sheet and the Laurentide ice sheet) exceeded the warming forced by the high Northern Hemisphere summer
©2020. American Geophysical Union. All Rights Reserved.
Special Section:
The Land‐Air Coupling Over Tibetan Plateau and its Global Climate Effects
Key Points:
• A new high‐resolution ice core δ18O
record dated back to 7 ka BP from the northwestern Tibetan Plateau was presented
• The record shows a long‐term warming trend between 7 and 2 ka BP and followed by a cool period until the start of the industrial‐era warming
• Temperatures during the recent decades are almost the highest during the past 7 ka BP
Supporting Information:
• Supporting Information S1
Correspondence to:
H. Pang and S. Hou, shugui@nju.edu.cn; hxpang@nju.edu.cn
Citation:
Pang, H., Hou, S., Zhang, W., Wu, S., Jenk, T. M., Schwikowski, M., & Jouzel, J. (2020). Temperature trends in the northwestern Tibetan Plateau constrained by ice core water isotopes over the past 7,000 years. Journal of Geophysical Research: Atmospheres, 125, e2020JD032560. https://doi.org/ 10.1029/2020JD032560
Received 7 FEB 2020 Accepted 7 SEP 2020
insolation (NHSI) during the early to mid‐Holocene (Baker et al., 2017; Marsicek et al., 2018). Other studies suggest the disparity could be partly explained by spatial heterogeneity of temperature evolution. For instance, central Europe showed a long‐term Holocene cooling in mean annual temperature based on spe-leothemfluid inclusion water isotopes (Affolter et al., 2019), whereas mean annual temperature reconstruc-tions from the Altai Mountains in arid Central Asia showed a Holocene warming (Wu et al., 2020). The TP has shown high sensitivity to climate change due to the snow/ice albedo feedbacks (Mountain Research Initiative EDW Working Group, 2015; Pepin & Lundquist, 2008). However, no temperature records at high elevations (>4,000 m above sea level, a.s.l.) were included in the reconstructions of regional and global Holocene temperature (e.g., Marcott et al., 2013; Marsicek et al., 2018), largely due to the paucity of proxy data in these regions. Therefore, Holocene temperature reconstructions from the high TP can provide crucial information to understand the Holocene temperature conundrum.
Available temperature reconstructions show contrasting trends of the Holocene temperature evolution on the TP and its surroundings. Some records show distinct long‐term cooling trends during the Holocene, such as the synthesis temperature index reconstructed by a compilation of pollen records from the Altai Mountains and surrounding regions (Zhang & Feng, 2018), the Guliya ice coreδ18O record retrieved from the northwestern TP from the early Holocene to ~3 ka BP (Thompson et al., 1997), and the glycerol dialkyl glycerol tetraether (GDGT) reconstruction of mean annual temperature from Habahe peat core from Altai Mountains since ~7 ka BP (Tang, 2014; Zhang, Yang, et al., 2018). However, other records show warming trends, such as the reconstructed summer/winter/annual temperatures based on peatα‐cellulose δ13C/δ18C records and peat GDGTs from the Altai Mountains (Rao et al., 2019, 2020; Wu et al., 2020), the stalagmiteδ18O record from Kesang Cave in the western Tianshan Mountains (an indicator of temperature (Rao et al., 2019)) (Cheng et al., 2012), and the ice coreδ18O records from the Grigoriev ice cap in the western Tianshan Mountains (Takeuchi et al., 2014), the Dunde ice cap in the northeastern TP since ~6 ka BP (Thompson et al., 2005), and the Puruogangri ice cap in the central TP from ~6.5 to ~4.0 ka BP (Thompson et al., 2006). The reconciliation of these divergent trends of Holocene temperature in the TP and its surround-ings requires additional records from these regions with reliable chronology and unambiguous climatological significance.
The TP and its surroundings contain the largest volumes of glaciers outside the polar regions (Yao et al., 2012), and they contain a valuable archive for past climate and environment. For instance, the stable oxygen isotopic ratio (δ18
O) in ice cores from the northwestern TP is widely used as a proxy for tem-perature because of the significant positive correlation between air temperature and precipitation δ18O in the northwestern TP (An et al., 2016; Tian et al., 2003, 2006; Yao et al., 1996, 2013). Many Tibetan ice cores have been retrieved during the past three decades (e.g., An et al., 2016; Deji et al., 2017; Hou et al., 2004; Kang et al., 2007; Thompson et al., 1989, 1997, 2005, 2006; Tian et al., 2006; Wang et al., 2003; Yao et al., 2002). However, due to extremely limited14C samples in glacier ice (Thompson et al., 2005, 2006) and other dif ficul-ties in reliably dating the bottom sections of ice cores, continuous long‐term and high‐resolution Holocene temperature reconstructions from the Tibetan ice core isotopic records are still rare. In 2012 and 2013,five ice cores were retrieved from the Chongce ice cap in the westerlies‐dominated northwestern TP (Figure 1). The Chongce ice cores were of Holocene origin (Hou et al., 2018), based on a new method of14C dating of water‐insoluble organic carbon (WIOC) particles from carbonaceous aerosols trapped in glacier ice (Uglietti et al., 2016). The continuous and high‐resolution oxygen isotopic records (δ18O) of the Chongce ice cores covering the past 7,000 years has been presented by Hou et al. (2019). In this paper, we used the Chongce ice coreδ18O records to quantitatively reconstruct past temperature at this high‐altitude site and examine its variations and trend over the past 7,000 years. This work is important for our understanding of regional Holocene temperature dynamics on the TP and contributes to resolving the Holocene temperature conundrum.
2. Materials and Methods
2.1. Chongce Ice Cores
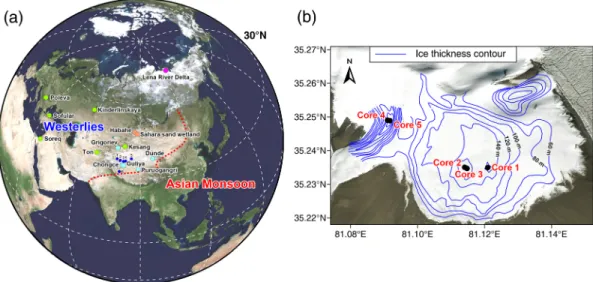
The Chongce ice cap is located in the western Kunlun Mountains, northwestern TP, within the westerlies regime (Figure 1a; Chen et al., 2008). In October 2012, a team of scientists retrieved two ice cores to bedrock with the lengths of 133.8 m (Core 1) and 135.8 m (Core 2), and a shallow core with length of 58.8 m (Core 3) at
an altitude of 6,010 m a.s.l. on the Chongce ice cap (35°14′N, 81°7′E; Figure 1b). The distance between Core 2 and Core 3 is ~2 m. In October 2013, two more ice cores to bedrock with the lengths of 216.6 m (Core 4) and 208.6 m (Core 5) were recovered at an altitude of 6,100 m a.s.l. on the same ice cap (35°15′N, 81°5′E; Figure 1b). The calculated mean annual accumulation rate is 140 mm w.e. year−1for Core 3 (1963–2012) and 297 mm w.e. year−1for Core 4 (1963–2013) (Hou et al., 2018). The difference is likely caused by local conditions. Core 4, located in a depression, could receive extra snow from snow drifting, whereas Core 3, located on the summit, could lose snow due to wind scouring (Hou et al., 2018). More details on thefive ice cores can be found in Hou et al. (2018, 2019).
2.2. Isotopic Measurements
Measurements of water stable isotopic ratios (δ18O andδD) were performed on Core 2 and Core 3. Core 2 was cut at ~10‐cm intervals from the depth of 13.2 m to the depth 134.3 m and at ~1 cm from 134.3 m to the bottom, yielding 1,301 samples in total. The bottom ~20 cm above the ice‐bedrock contact is not analyzed because it consists of a mixture of ice and sediment (Zhang, Hou, & Yi, 2018). Core 3 was cut into 1956 sam-ples with a resolution of ~3 cm. Isotopic measurements were performed at Nanjing University by a Wavelength Scanned Cavity Ring‐Down Spectrometer (WS‐CRDS, model: Picarro L2120‐i), with the analy-tical uncertainty of less than 0.1‰ for δ18O and 0.5‰ for δD (Tang et al., 2015). For both Core 2 and 3, δD values are closely correlated with theδ18O values, and theirδD‐δ18O slopes are slightly higher than 8 (Figure S1 in the supporting information). This suggests that the isotopic data of Chongce is reliable for paleoclimate studies.
2.3. Ice Core Dating
The chronology of the Chongce ice cores was established and described in details in Hou et al. (2018). For dating, we made use of a recently developed technology that enables the extraction of WIOC particles at microgram level (>10μg) from carbonaceous aerosol trapped in glacier ice for accelerator mass spectrometry (AMS)14C dating (Jenk et al., 2007, 2009; Sigl et al., 2009; Uglietti et al., 2016). Measurements of14C on WIOC particles were performed from 22 samples collected along Core 4 (Table S1) and nine samples along Core 2 (Table S2) by the Mini Carbon Dating System (MICADAS) at the University of Bern LARA laboratory (Hou et al., 2018). In order to avoid the potential influence of older carbonaceous particles (e.g., dust origi-nated from the weathering of old carbonate rocks), we used a relatively low combustion temperature (340°C) Figure 1. Location and schematic of Chongce ice cores. (a) Map showing the location of the Chongce site (ice blue), nearby meteorological stations (blue) (1: Pishan; 2: Hetian; 3: Yutian; 4: Minfeng; 5: Qiemo; 6: Shiquanhe), and other records discussed in the text including ice core records (ice blue), stalagmite caves (green), peat cores (orange), and the Lena River Delta ice wedge record site (magenta). The red dotted line marks the approximate limit of the modern Asian summer monsoon (Chen et al., 2008). The map is created by the Surfer software (Surfer 16.0; https://www. goldensoftware.com) and World Imagery Basemap (http://www.digitalglobe.com) is used as the background. (b) Map of the Chongce ice cap with the drilling sites for all cores. Blue lines are contour lines of ice thickness.
to separate organic carbon from elemental carbon. The resulting CO2was measured by the MICADAS (Hou et al., 2018; Uglietti et al., 2016). In addition, contributions from fossil fuels could also introduce an old bias in14C ages for samples younger than 200 years (since the industrial revolution). For instance, the top four14C ages of Core 4 were likely biased due to such anthropogenic contribution (Hou et al., 2018; Table S1). The overall 14C dating uncertainty is around 10–20% (variable depending on sample age) (Uglietti et al., 2016). More details on sample preparation procedures and analytical methods can be found in previous publications (Jenk et al., 2007, 2009; Sigl et al., 2009; Uglietti et al., 2016). In addition, theβ activ-ity was measured for 22 samples from the top to a depth of 10.3 m of Core 3 using an alpha‐beta multidetec-tor (Mini 20, Eurisys Mesures) at the National Key Laboramultidetec-tory of Cryospheric Sciences, China. Theβ activity peaks associated with the 1963 nuclear testing peak and the 1986 Chernobyl nuclear accident occurred at depths of 8.2–8.4 and 4.8–5.1 m respectively (An et al., 2016).
The depth‐age relationship for Core 2 (Figure S2) was established by applying a two‐parameter flow model (2p model) (Bolzan, 1985) constrained by the14C ages of Core 2, age at bedrock estimated from Core 4, and the twoβ activity peaks of Core 3, assuming a similar depth‐age relationship for the upper parts of Core 2 and Core 3. The modeled age at the depth of the oldest14C sample is 5.2±1:9
1:4ka BP, similar to the actual
14C age of 6.3 ± 0.2 ka BP, given the uncertainty range (Hou et al., 2018). More details on the dating of Core 2 and Core 4 can be found in Hou et al. (2018).
2.4. The Combined Chongceδ18O Record of Core 2 and Core 3
The sampling resolution of Core 3 (~3 cm) is higher than that of Core 2 (~10 cm). Theδ18O profile of Core 3 is similar to that of Core 2 at 13.2–58.8 m (Figure S3) as the two drilling sites are only ~2 m apart. When resampled at the common resolution of 10 cm,δ18O values of Core 2 and Core 3 are highly correlated at depths of 13.2–58.8 m (r = 0.36, p < 0.001, n = 457). Therefore, the δ18O profile from the depth of 58.8 m to the bottom of Core 2 is combined with theδ18O profile of the top 58.8 m of Core 3 to form a single δ18O profile. Using the established depth‐age relationship of Core 2, the combined δ18O record of Core 2 and Core 3 was dated back to ~7.0 ka BP (Hou et al., 2019).
2.5. The TraCE‐21 ka Simulation
TraCE‐21 ka temperature output data were used to analyze the long‐term temperature conditions in our study area. TraCE‐21 ka is a climate simulation of the last 21,000 years using a synchronously fully coupled atmosphere‐ocean‐sea ice‐land surface Community Climate System Model 3 (CCSM3) at the T31_gx3 resolution (Carlson et al., 2012; Liu et al., 2009). This full TraCE model is forced with transient forcing changes in greenhouse gases, orbital‐driven insolation variations, ice sheets, and meltwater fluxes, but the realistic forcing changes of volcanic aerosol and solar activity are not included. The CCSM3 data were spatially resampled into 2.0° × 2.0° resolution because the original resolution (about 3.75° × 3.75°) is too coarse. The TraCE‐21 ka output data are available at the National Center for Atmospheric Research (at https://www.earthsystemgrid.org).
3. Results
Theδ18O record of Core 3 has a significant positive correlation with observed mean annual temperatures from nearby meteorological stations (Table 1 and Figure S4), as well as the regional annual temperature extracted from the HadCRU4 (Brohan et al., 2006) from the Climatic Research Unit at the University of East Anglia (Figure S5). The correlations are significantly improved when 5‐year running averages are used (Table 1), likely due to the dating uncertainty (±1 year during the recent decades) (An et al., 2016). In addi-tion, the Chongceδ18O record is also positively correlated with cold (December–May, DJFMAM) and warm (June–November, JJASON) season temperatures at nearby meteorological stations (Table 1 and Figure S4). The results suggest that temperature in the northwestern TP could be reconstructed by the Chongceδ18O record. We calculated the isotope/temperature relationship (δ18O/T) based on the 5‐year running averages of the Chongceδ18O and the mean annual temperature of nearby meteorological stations, yielding an average slope of 1.61 ± 0.22‰/°C (Table 1). Using this value, we converted the Chongce δ18O record to temperature anomaly relative to the mean value over the past 7 millennia.
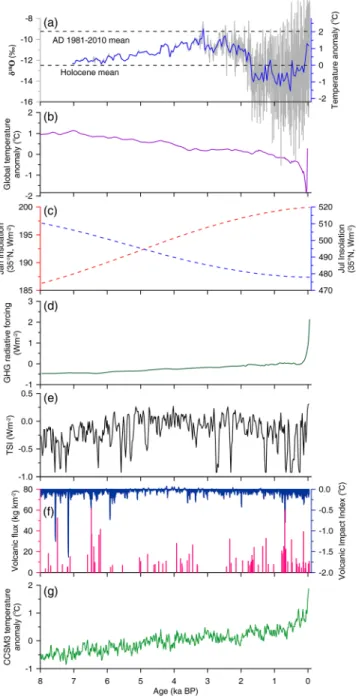
The Chongce ice coreδ18O record and its reconstructed temperature anomalies are presented in Figure 2a. It shows a warming trend during the middle to late Holocene (~7.0–2.0 ka BP). The reconstructed temperature increased steadily until ~3.0 ka BP. It then started tofluctuate at a relatively high level before it dropped sharply at ~1.8 ka BP. After the abrupt cooling, the temperature remained in a relatively cool condition until the significant warming since the start of the industrial revolution around the midnineteenth century. The temperature in recent decades (1981–2010 CE) was almost the highest during the past 7 ka (Figure 2a).
4. Discussion
4.1. The Possible Sources of Uncertainty for Temperature Reconstruction
Despite the close correlation between theδ18O record of Chongce and the instrumental temperature in recent decades, precipitationδ18O at Chongce could be affected by several factors other than temperature, leading to uncertainties for theδ18O/T slope over time. First, annual averageδ18O is affected by the seasonal distribution of precipitation, which could change over time (Buizert et al., 2014; Guillevic et al., 2013; Masson‐Delmotte et al., 2011). Second, precipitation δ18O might be impacted by shifts of moisture source resulting from changes in large‐scale atmospheric circulations, for example, the north‐south migration of the westerlies associated with the phase shift of the North Atlantic Oscillation (NAO) (Baker et al., 2017; Liu et al., 2015). Third, theδ18O in precipitation at Chongce is affected by the local recycling of moisture, which is an important source for precipitation on the northwestern TP (An et al., 2017). Finally, the δ18O‐temperature relationship could be dependent on elevation. The present δ18O/T slope was derived from temperatures of meteorological stations at much lower elevations (Table 1). This might be different with the actualδ18O/T slope at Chongce due to enhanced sensitivity to climate change at high elevations.
Despite these uncertainties, the calculatedδ18O/T slope (1.61 ± 0.22‰/°C) is largely comparable with those reported for other TP ice cores (An et al., 2016; Kang et al., 2007; Tian et al., 2006). It is, however, much higher than most δ18O/T slopes observed over middle‐ and high‐latitude regions (0.6–0.7‰/°C) (Dansgaard, 1964; Johnsen et al., 1989; Rozanski et al., 1992; Tian et al., 2003; Yao et al., 1996). This discre-pancy suggests that some of the factors discussed above might have important influence on the δ18
O/T rela-tionship. Unfortunately, we currently cannot quantify these effects due to a lack of observations. As the average middle‐ and high‐latitude δ18O/T slope (0.6–0.7‰/°C) would lead to unreasonably large variabilities in the reconstructed temperature series, we chose to use the calculatedδ18O/T slope (1.61 ± 0.22‰/°C) for the temperature reconstruction.
4.2. Middle to Late Holocene Warming
The reconstructed temperature record shows a long‐term warming trend during the middle to late Holocene (~7–2 ka BP) (Figure 2a). In order to explain this warming, we examined a variety of climate forcings against the Chongce record, including orbitally driven insolation, atmospheric greenhouse gases (GHGs), solar activity (total solar irradiance), and volcanic eruptions. It seems that the middle to late Holocene warming Table 1
Correlation Coefficients and Slopes Between Chongce δ18O and Mean Annual, Cold (DJFMAM), and Warm (JJASON) Season Temperatures at Meteorological Stations Surrounding Chongce
Station Latitude (°N) Longitude (E°) Altitude (m)
Correlation coefficient Slope (‰/°C)
Period (CE)
Annual DJFMAM JJASON Annual DJFMAM JJASON
Hetian 37.133 79.933 1375.0 0.265*(0.585**) 0.198 (0.520**) 0.307*(0.557**) 1.31 1.16 1.19 1954–2012 Minfeng 37.067 82.717 1409.5 0.371**(0.651**) 0.240 (0.598**) 0.378**(0.650**) 1.49 1.40 1.41 1957–2012 Shiquanhe 32.500 80.083 4278.6 0.427**(0.756**) 0.303*(0.673**) 0.502**(0.811**) 1.63 1.34 1.83 1961–2012 Yutian 36.850 81.650 1422.0 0.248 (0.422**) 0.163 (0.480**) 0.205 (0.226) 1.54 1.52 0.75 1956–2012 Pishan 37.617 78.283 1375.4 0.374**(0.663**) 0.180 (0.487**) 0.443**(0.718**) 1.93 1.35 1.93 1959–2012 Qiemo 38.150 85.550 1247.2 0.266*(0.618**) 0.163 (0.579**) 0.325*(0.598**) 1.78 1.63 1.60 1954–2012 Mean — — — — — — 1.61 ± 0.22 1.40 ± 0.16 1.45 ± 0.44 —
Note. Numbers in brackets are correlation coefficients for 5‐year running average. The slope between the Chongce δ18O and temperature at each station is cal-culated using the 5‐year running averages considering the Chongce ice core dating uncertainty (±1 year) during the recent decades (1953–2012) (An et al., 2016). *Correlation is significant at the 0.05 level (p < 0.05). **Correlation is significant at the 0.01 level (p < 0.01).
trend at Chongce (Figure 2a) cannot be explained by the NHSI, which shows a long‐term decreasing trend (Figure 2c), or solar activity (Steinhilber et al., 2012; Figure 2e) and volcanic eruptions (Castellano et al., 2005; Kobashi et al., 2017; Figure 2f), which do not show any significant trends. The warming, on the other hand, is consistent with the rising Northern Hemisphere winter insolation (NHWI) (Laskar et al., 2004; Figure 2c) and the increase of radiative forcing from GHGs (Joos & Spahni, 2008; Figure 2d). Incorporating these climate forcings (except the solar activity and volcanic eruptions), the transient climate model CCSM3 (Carlson et al., 2012; Liu et al., 2009) also simulated a warming trend in mean annual temperature at Chongce (Figure 2g). Therefore, the middle to late Holocene warming at Chongce was likely forced by increasing NHWI and GHGs. However, the extratropical (30–90°N) Northern Hemisphere (Chongce within this region) tempera-ture reconstruction shows an overall cooling trend during the middle to late Holocene (Marcott et al., 2013; Figure 2b). It is likely that these reconstructions have summer biases (e.g., the marine records from the northern Atlantic Ocean), and the resulting temperatures are more influ-enced by the NHSI (Figure 2c). This result seems to imply summer cooling caused by decreasing NHSI more than offset the warming effect of GHGs during the middle to late Holocene. Therefore, the middle to late Holocene warming at Chongce is likely driven primarily by the rising NHWI. This inference also suggests that the Chongce ice coreδ18O record could have a slight winter bias. This is supported by the significant positive correlations between the Chongce δ18O record and the winter half‐year (DJFMAM) temperatures at meteorological stations (Table 1 and Figure S4). Based on the monthly precipitation data of 2001–2013 extracted from the High Asia Refined Reanalysis (HAR) (Maussion et al., 2014), for the most part of northwestern TP, more than 60% of precipitation occurs in the winter half‐year (DJFMAM) (Figure 3a), with less than 40% of precipitation in the summer half‐year (JJASON) (Figure 3b). Monthly precipitation data at Chongce extracted from the HAR (Figure S6a) show 59% of precipitation falls in the winter half‐year and 41% in the summer half‐year. In addition, seasonal snow accumula-tion can be inferred from theδ18O cycles (low values in winter and high values in summer) recorded in Core 3 (Figure S6b). The result suggests 56% of snow falls in the winter half‐year and 44% in the summer half‐ year, assuming a constant snow density over a year. This winter precipitation regime in the northwestern TP results from the eastward propagating midlatitude cyclones from the Mediterranean region called the Western Disturbances (WDs), and the moisture carried by the WDs is intercepted by the high terrains and condensed over the northwestern TP (Liu et al., 2017; Pang et al., 2014; Syed et al., 2006). Therefore, the win-ter precipitation regime at Chongce supports the slight winwin-ter bias of the Chongce ice coreδ18O record.
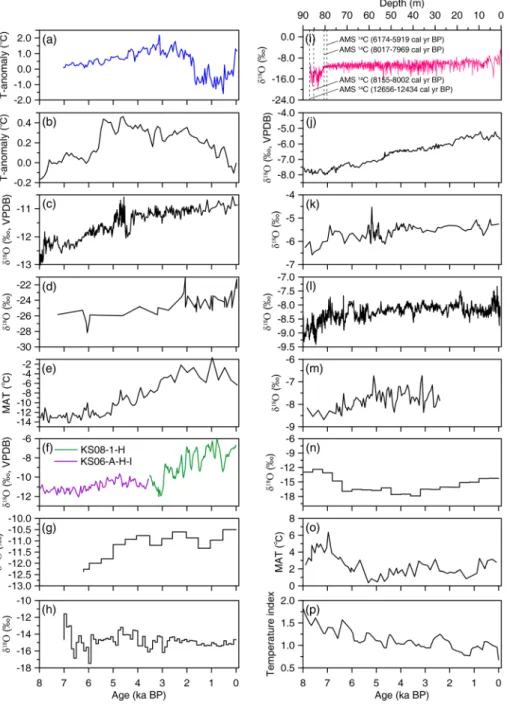
The warming trend during 7–2 ka BP recorded in the Chongce record (Figures 2a and 4a) is also observed in some of the Holocene temperature reconstructions, including the mean annual temperature record based on pollen data from North America and Europe (Marsicek et al., 2018; Figure 4b); the speleothemδ18O record of the Kinderlinskaya Cave in the southern Ural Mountains, which is biased toward winter temperature because the epikarst is recharged by winter precipitation (Baker et al., 2017; Figure 4c); the ice wedgeδ18O record from the Lena River Delta in the Figure 2. Temperature reconstructions, climate forcing, and temperature
simulation for the past eight millennia: The Chongceδ18O and its reconstructed temperature anomaly relative to the Holocene mean (thick blue line indicates 50‐year means, and the gray dashed lines represent the mean values over the whole period and the period of 1981–2010 CE respectively) (a); the extratropical Northern Hemisphere (30–90°N) reconstructed temperature anomaly relative to 1961–1990 CE mean (Marcott et al., 2013) (b); mean insolation at 35°N for January (red) and July (blue) (Laskar et al., 2004) (c); greenhouse gas radiative forcing (Joos & Spahni, 2008) (d); solar forcing (Steinhilber et al., 2012) (e); volcanic activity (derived from Greenland GISP2 record (blue) and Antarctic Dome C record (red)) (Castellano et al., 2005; Kobashi et al., 2017) (f); temperature anomaly (30‐year running means) at Chongce relative to the mean over the past eight millennia simulated by CCSM3 climate model (g).
Siberian Arctic, which is considered as a winter temperature proxy because the ice wedge is formed when thermal contraction cracks open in winter and spring snowmelt fills and refreezes the cracks (Meyer et al., 2015; Figure 4d); the peat brGDGTs‐based mean annual temperature reconstruction from an alpine Sahara sand wetland in the southern Altai Mountains (Wu et al., 2020; Figure 4e); and the Holocene stalagmite δ18O record from Kesang Cave in the western Tianshan Mountains (Cheng et al., 2012; Figure 4f), which is considered an indicator of temperature rather than moisture (Rao et al., 2019). A similar increasing trend is also observed for the middle to late Holocene in theδ18O records of Dunde ice core from the northeastern TP (Thompson et al., 2005; Figure 4g), Puruogangri ice core from the central TP from ~6.5 to ~4.0 ka BP (Thompson et al., 2006; Figure 4h), and the Grigoriev ice core from the western Tianshan Mountains (Takeuchi et al., 2014; Figure 4i). In addition, the Chongce δ18O record also resembles the speleothemδ18O records from caves at the upwind locations from the study area in the westerlies zone, including the Ton Cave (Cheng et al., 2016; Figure 4j), the Soreq Cave (Bar‐Matthews et al., 2003; Figure 4k), the Sofular Cave (Göktürk et al., 2011; Figure 4l), and the Poleva Cave (Constantin et al., 2007; Figure 4m). These speleothem δ18O records should also have a winter bias because the majority of precipitation occurs during the winter half‐year. Although these upwind speleothem δ18O records are not necessarily strict wintertime temperature proxies, their similarity to the Chongce δ18O record indicates that they are likely controlled by temperatures through the common atmospheric Figure 3. Seasonal precipitation regimes on the northwestern Tibetan Plateau. Percentage of annual precipitation for the winter half‐year (DJFMAM) (a) and summer half‐year (JJASON) (b), calculated from the High Asia Refined analysis dataset (2001–2013 CE) with spatial resolution 10 km (Maussion et al., 2014). The black dot indicates the Chongce ice core site.
circulation, that is, the westerlies. The results seem to indicate that the Holocene warming trend, likely mainly ascribed to winter warming, is regionally coherent over much of the westerlies‐dominated continental Eurasia.
Figure 4. Records showing warming during the middle to late Holocene: Temperature anomaly (50‐year means) reconstructed by the Chongceδ18O record relative to the Holocene mean (a); mean annual temperature
reconstruction for North America and Europe relative to the mean of 1,450–1950 CE (Marsicek et al., 2018) (b); spe-leothemδ18O from Kinderlinskaya Cave (Baker et al., 2017) (c); ice wedgeδ18O from Lena River Delta (Meyer et al., 2015) (d); peat brGDGTs mean annual temperature reconstruction from Sahara sand wetland (Wu et al., 2020) (e); speleothemδ18O from Kesang Cave (Cheng et al., 2012) (f); ice coreδ18O records from Dunde ice cap (Thompson et al., 2005) (g), Puruogangri ice cap (Thompson et al., 2006) (h), and Grigoriev ice cap (Takeuchi et al., 2014) (i); spe-leothemδ18O records from Ton Cave (Cheng et al., 2016) (j), Soreq Cave (Bar‐Matthews et al., 2003) (k), Sofular Cave (Göktürk et al., 2011) (l), and Poleva Cave (Constantin et al., 2007) (m); Guliya ice coreδ18O record (Thompson et al., 1997) (n); the GDGT reconstruction of mean annual temperature from Habahe peat core (Zhang, Yang, et al., 2018) (o); and a synthesis temperature index reconstructed by a compilation of pollen records from the Altai Mountains and surrounding regions (Zhang & Feng, 2018) (p).
In contrast to the significant middle to late Holocene warming trend at Chongce, several temperature recon-structions from the northwestern TP and its surroundings show a different trend over the same period. For example, the nearby Guliya ice coreδ18O record, ~30 km from Chongce, shows a cooling trend from the mid‐Holocene to ~3 ka BP (Thompson et al., 1997; Figure 4n). The GDGT reconstruction of mean annual temperature from Habahe peat core from Altai Mountains exhibits a long‐term cooling trend since ~7 ka BP (Tang, 2014; Zhang, Yang, et al., 2018; Figure 4o). The synthesis temperature reconstruction by pollen records from the Altai Mountains and surrounding regions shows a cooling trend since the mid‐Holocene (Zhang & Feng, 2018; Figures 4p). Apart from the Guliya ice core, other records are largely based on biolo-gical proxies. It has been shown that many biolobiolo-gical archives of palaeoclimate (e.g., tree ring, pollen, and alkenone) have summer biases because they are more sensitive toward growing season temperatures (Christiansen & Ljungqvist, 2017; PAGES 2k Consortium, 2017; Rehfeld et al., 2016). The cooling trend in these proxies is likely linked to decreasing NHSI (Liu et al., 2014; Figure 2c). With respect to the nearby Guliya ice core, Hou et al. (2019) recently suggest that the apparent discrepancy between the Holocene δ18
O records of the Guliya and the Chongce ice cores may be attributed to a possible misinterpretation of the Guliya ice core chronology, that is, an overestimation of age.
4.3. Abrupt Cooling at ~1.8 ka BP
The reconstructed temperature record shows an abrupt cooling at ~1.8 ka BP (Figure 2a). This rapid shift to colder conditions was unlikely driven by the gradually decreasing NHSI (Figure 2c). Instead, at ~1.8 ka BP, there seemed to be a slight decrease in the solar activity (Figure 2e) and an increase in the volcanic activity (Figure 2f; Castellano et al., 2004, 2005; Kurbatov et al., 2006). Therefore, the observed abrupt cooling at ~1.8 ka BP could be driven by these negative forcings.
The large drop in the Chongceδ18O record, however, may not be completely attributed to temperature change. Instead, it could be affected by other changes that might be triggered by the initial temperature decrease at ~1.8 ka BP driven by solar and volcanic activities. For example, the cooler conditions could have initiated a southward shift in the westerlies caused by the onset of the negative phase of the NAO, which could in turn have led to changes in moisture source for Chongce. Previous studies showed that moisture source changes associated with the NAO activity have a strong impact on precipitation δ18O in the westerlies‐dominated region (Baker et al., 2017; Liu et al., 2015). Moreover, the temperature drop at ~1.8 ka BP could lead to an increase in winter precipitation, resulting in the abrupt drop of theδ18O record at Chongce. Therefore, the possible shift of moisture source to northern locations and/or precipitation seasonality toward winter could partly account for the abrupt drop of theδ18O record at Chongce around 1.8 ka BP.
The abrupt cooling at ~1.8 ka BP in the Chongce record was not observed in other records presented in Figure 4. It is possible that this abrupt cooling was a regional phenomenon that only occurred in the high northwestern TP. The high elevation of Chongce ice core (>6,000 m a.s.l.) makes it more sensitive to climate forcings such as the increase of volcanic eruptions and the weak solar activity at ~1.8 ka BP because of the high‐elevation amplification (Mountain Research Initiative EDW Working Group, 2015; Wang et al., 2014). On the other hand, the response at lower elevations (most records in Figure 4 are located at lower than 4,000 m a.s.l.) was probably weaker to the same climate forcings. In addition, the weather systems respon-sible for precipitation in the high northwestern TP are mostly westerly upper‐tropospheric synoptic‐scale low‐pressure systems. Snowstorms generally occur only when the low‐pressure disturbances are locked by high terrains (Lang & Barros, 2004; Liu et al., 2017; Pang et al., 2014; Syed et al., 2006). Therefore, precipita-tion mechanism and seasonality at the high elevaprecipita-tion (e.g., Chongce) could be different from those at lower elevations. Such differences could be another reason why the abrupt cooling at ~1.8 ka BP was not observed in the records from the lower elevations.
Given the importance of understanding rapid climate change, we need to further corroborate the abrupt cooling at ~1.8 ka BP observed in the Chongce record and examine its potential causes. This requires addi-tional high‐resolution climate reconstructions on the high northwestern TP and its surroundings.
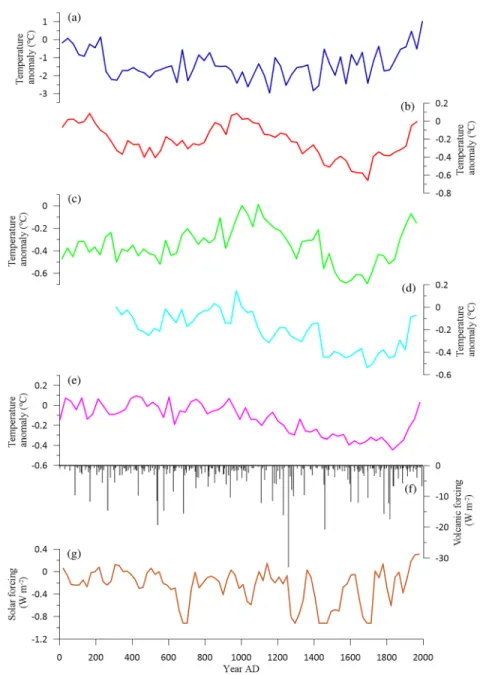
4.4. Cool Period Over the Past Two Millennia Before the Industrial‐Era Warming
The reconstructed temperature record shows an abrupt decrease at ~1.8 ka BP and remained in a relatively cool condition until the start of the industrial‐era warming around the midnineteenth century (Figures 2a,
4a, and 5a). Most previous hemisphere/global temperature reconstructions show a gradual cooling trend over the past two millennia (2k) until the nineteenth century when the industrial‐era warming started. Such examples include the temperature reconstruction for the extratropical Northern Hemisphere (Ljungqvist, 2010; Figure 5b), the Northern Hemisphere temperature reconstruction (Moberg et al., 2005; Mann et al., 2008; Figures 5c and 5d), and the global temperature reconstruction (PAGES 2k Consortium, 2013; Figure 5e). Such cool conditions in Chongce record as well as other reconstructions over the past 2k could be a response to the negative forcings of volcanic activity (Sigl et al., 2015; Figure 5f) and solar irradiance (Steinhilber et al., 2012; Figure 5g). However, in contrast to a gradual cooling trend in most other reconstructions, the Chongce temperature record remains relatively stable after the initial drop (Figure 5a). The difference could be attributed to the seasonal biases of Figure 5. Temperature reconstructions and climate forcings over the Common Era: temperature anomaly (30‐year means) reconstructed by the Chongceδ18O record (a); the extratropical Northern Hemisphere temperature anomaly (Ljungqvist, 2010) (b); the Northern Hemisphere temperature reconstructions of Moberg et al. (2005) (c) and Mann et al. (2008) (d); the global temperature reconstruction (PAGES 2k Consortium, 2013) (e); the volcanic forcing (Sigl et al., 2015) (f); and solar forcing (Steinhilber et al., 2012) (g). All temperature anomalies are relative to the mean of 1961–1990 CE.
past temperature reconstructions, as many proxy records with summer biases (e.g., tree ring, pollen, and alkenone) were used in the previous hemisphere/global temperature reconstructions (e.g., Ljungqvist, 2010; Mann et al., 2008; Moberg et al., 2005; PAGES 2k Consortium, 2013). Therefore, the decreasing summer insolation during the past 2k (Figure 2c) could partly account for the observed gradual cooling in these reconstructions. Since the Chongce record has a slight winter bias, the general cooling effects of volcanic and solar activities could be partly counteracted by the warming effect of increasing winter insolation (Figure 2c), leading to relatively stable temperatures at Chongce during the past 2k. Our study highlights the need for more proxy records with unambiguous climatological significance to further con-strain the long‐term trend of hemisphere/global temperature reconstructions during the past 2k.
The decoupling of Chongce temperature from winter insolation and GHGs over the past 2k suggests that temperature at high elevations could be highly sensitive to the negative forcings of volcanic activity and solar irradiance, probably due to the strong positive feedback from snow and ice (Singh et al., 2015; Winter et al., 2017). This decoupling is not observed or weak in other reconstructions at low elevations, such as the speleothem and ice wedgeδ18O records presented in Figure 4. This seems to suggest that the negative forcings of volcanic and solar activities were weak at low elevations and could be masked by the forcings of increasing winter insolation and GHGs during the past 2k (Figures 2c and 2d).
4.5. Industrial‐Era Warming in the Northwestern TP
The Chongce reconstruction shows that the present temperature (1981–2010 CE) is 1.45 ± 0.20°C warmer than the preindustrial period (1851–1880 CE), which is higher than the concurrent average global tempera-ture rise of ~0.85°C (Stocker et al., 2013). This is likely caused by the warming amplification with elevation (Liu & Chen, 2000; Mountain Research Initiative EDW Working Group, 2015; Pepin & Lundquist, 2008). The temperature in recent decades (1981–2010 CE) was almost the highest during the past 7 ka, with the exception at ~3.1 ka BP (Figure 2a). Over the past 2k, where the Chongce record has sufficient resolution for calculating decadal temperature (Figure S7), the 50s CE and 1450s CE are the only two decades with tem-peratures comparable to recent temtem-peratures. A few decades with anomalously highδ18O values before the preindustrial period could result from changes in moisture source at Chongce rather than local temperature. According to Baker et al. (2017), changes in moisture source has the strongest impact on precipitationδ18O in the midlatitudes, when the midlatitude westerlies are strengthened by enhanced meridional pressure gradient. They indicated that the enhanced westerlyflow over the North Atlantic region results in a more southerly moisture source and relatively high precipitationδ18O over the midlatitudes. Therefore, the anom-alously warming in recent decades, forced by anthropogenic GHGs, are very likely unprecedented over the past 7.0 ka BP in our reconstructed record.
5. Conclusions
In this study, we present a new high‐resolution δ18O‐based temperature records from the Chongce ice cores to bedrock recovered from the northwestern TP, which were dated back to 7 ka BP using a recently estab-lished AMS14C dating technique. We found the Chongce ice core isotopic record has a slight winter bias because of the winter precipitation regime in the northwestern TP caused by the westerlies. The recon-structed temperature record at Chongce shows a significant middle to late Holocene warming, which challenges the widely recognized Holocene reconstruction from the neighboring Guliya ice coreδ18O record. The Chongce temperature record shows an abrupt decrease at ~1.8 ka BP and remains relatively stable until the start of the industrial‐era warming. It is different from many previous temperature reconstructions, most of which have summer biases and show a long‐term cooling trend over the past two millennia. Finally, our record shows that temperature during the recent decades (1981–2010 CE) is almost the highest during the past 7 ka BP, highlighting the unusual warming forced by anthropogenic GHGs.
Data Availability Statement
High Asia Refined analysis data set is provided by the Chair of Climatology, TU Berlin. The isotopic data and temperature reconstructions at Chongce are available from National Tibetan Plateau Data Center (at http://data.tpdc.ac.cn/en/data/d658445d‐c0a0‐4624‐8a56‐291e5a58a61f/).
References
Affolter, S., Häuselmann, A., Fleitmann, D., Edwards, R. L., Cheng, H., & Leuenberger, M. (2019). Central Europe temperature constrained by speleothemfluid inclusion water isotopes over the past 14,000 years. Science Advances, 5, eaav3809. https://doi.org/10.1126/sciadv. aav3809
An, W., Hou, S., Zhang, Q., Zhang, W., Wu, S., Xu, H., et al. (2017). Enhanced recent local moisture recycling on the northwestern Tibetan Plateau deduced from ice core deuterium excess records. Journal of Geophysical Research: Atmospheres, 122, 12,541–12,556. https://doi. org/10.1002/2017JD027235
An, W., Hou, S., Zhang, W., Wu, S., Xu, H., Pang, H., et al. (2016). Possible recent warming hiatus on the northwestern Tibetan Plateau derived from ice core records. Scientific Reports, 6, 32813. https://doi.org/10.1038/srep32813
Baker, J. L., Lachniet, M. S., Chervyatsova, O., Asmerom, Y., & Polyak, V. J. (2017). Holocene warming in western continental Eurasia driven by glacial retreat and greenhouse forcing. Nature Geoscience, 10(6), 430–435. https://doi.org/10.1038/ngeo2953
Bar‐Matthews, M., Ayalon, A., Gilmour, M., Matthews, A., & Hawkesworth, C. J. (2003). Sea‐land oxygen isotopic relationships from planktonic foraminifera and speleothems in the eastern Mediterranean region and their implication for paleorainfall during interglacial intervals. Geochimca et Cosmochimica Acta, 67(17), 3181–3199. https://doi.org/10.1016/S0016‐7037(02)01031‐1
Bolzan, J. (1985). Iceflow at the Dome C ice divide based on a deep temperature profile. Journal of Geophysical Research, 90(D5), 8111–8124. https://doi.org/10.1029/JD090iD05p08111
Brohan, P., Kennedy, J. J., Harris, I., Tett, S. F., & Jones, P. D. (2006). Uncertainty estimates in regional and global observed temperature changes: A new data set from 1850. Journal of Geophysical Research, 111, D12106. https://doi.org/10.1029/2005JD006548
Buizert, C., Gkinis, V., Severinghaus, J. P., He, F., Lecavalier, B. S., Kindler, P., et al. (2014). Greenland temperature response to climate forcing during the last deglaciation. Science, 345(6201), 1177–1180. https://doi.org/10.1126/science.1254961
Carlson, A. E., Ullman, D. J., Anslow, F. S., He, F., Clark, P. U., Liu, Z., & Otto‐Bliesner, B. L. (2012). Modelling the surface mass‐balance response of the Laurentide Ice Sheet to Bolling warming and its contribution to Meltwater Pulse 1A. Earth and Planetary Science Letters, 315–316, 24–29. https://doi.org/10.1016/J.Epsl.2011.07.008
Castellano, E., Becagli, S., Hansson, M., Hutterli, M., Petit, J. R., Rampino, M. R., et al. (2005). Holocene volcanic history as recorded in the sulfate stratigraphy of the European Project for Ice Coring in Antarctica Dome C (EDC96) ice core. Journal of Geophysical Research, 110, D06114. https://doi.org/10.1029/2004JD005259
Castellano, E., Becagli, S., Jouzel, J., Migliori, A., Severi, M., Steffensen, J. P., et al. (2004). Volcanic eruption frequency over the last 45 ky as recorded in Epica‐Dome C ice core (East Antarctica) and its relationship with climatic changes. Global and Planetary Change, 42(1–4), 195–205. https://doi.org/10.1016/j.gloplacha.2003.11.007
Chen, F., Yu, Z., Yang, M., Ito, E., Wang, S., Madsen, D. B., et al. (2008). Holocene moisture evolution in arid central Asia and its out‐of‐ phase relationship with Asian monsoon history. Quaternary Science Reviews, 27(3–4), 351–364. https://doi.org/10.1016/j.
quascirev.2007.10.017
Cheng, H., Spötl, C., Breitenbach, S. F. M., Sinha, A., Wassenburg, J. A., Jochum, K. P., et al. (2016). Climate variations of central Asia on orbital to millennial timescales. Scientific Reports, 6, 36975. https://doi.org/10.1038/srep36975
Cheng, H., Zhang, P. Z., Spötl, C., Edwards, R. L., Cai, Y. J., Zhang, D. Z., et al. (2012). The climatic cyclicity in semiarid‐arid central Asia over the past 500,000 years. Geophysical Research Letters, 39, L01705. https://doi.org/10.1029/2011GL050202
Christiansen, B., & Ljungqvist, F. C. (2017). Challenges and perspectives for large‐scale temperature reconstructions of the past two mil-lennia. Reviews of Geophysics, 55(1), 40–96. https://doi.org/10.1002/2016RG000521
Constantin, S., Bojar, A.‐V., Lauritzen, S.‐E., & Lundberg, J. (2007). Holocene and Late Pleistocene climate in the sub‐Mediterranean continental environment: A speleothem record from Poleva Cave (Southern Carpathians, Romania). Palaeogeography,
Palaeoclimatology, Palaeoecology, 243(3–4), 322–338. https://doi.org/10.1016/j.palaeo.2006.08.001 Dansgaard, W. (1964). Stable isotopes in precipitation. Tellus, 16, 436–468.
Deji, Yao, T., Yang, X., Xu, B., Zhao, H., Li, J., Li, Z., et al. (2017). Warming and wetting climate during last century revealed by an ice core in northwest Tibetan Plateau. Palaeogeography, Palaeoclimatology, Palaeoecology, 487, 270–277. https://doi.org/10.1016/j.
palaeo.2017.09.009
Göktürk, O. M., Fleitmann, D., Badertscher, S., Cheng, H., Edwards, R. L., Leuenberger, M., et al. (2011). Climate on the southern Black Sea coast during the Holocene: Implications from the Sofular Cave record. Quaternary Science Reviews, 30(19–20), 2433–2445. https://doi. org/10.1016/j.quascirev.2011.05.007
Guillevic, M., Bazin, L., Landais, A., Kindler, P., Orsi, A., Masson‐Delmotte, V., et al. (2013). Spatial gradients of temperature, accumulation andδ18O‐ice in Greenland over a series of Dansgaard‐Oeschger events. Climate of the Past, 9(3), 1029–1051. https://doi.org/10.5194/cp‐ 9‐1029‐2013
Guo, D. L., & Wang, H. J. (2012). The significant climate warming in the northern Tibetan Plateau and its possible causes. International Journal of Climatology, 32(12), 1775–1781. https://doi.org/10.1002/joc.2388
Hou, S., Jenk, T. M., Zhang, W., Wang, C., Wu, S., Wang, Y., et al. (2018). Age ranges of the Tibetan ice cores with emphasis on the Chongce ice cores, western Kunlun Mountains. The Cryosphere, 12(7), 2341–2348. https://doi.org/10.5194/tc‐12‐2341‐2018
Hou, S., Qin, D., Jouzel, J., Masson‐Delmotte, V., von Grafenstein, U., Landais, A., et al. (2004). Age of Himalayan bottom ice cores. Journal of Glaciology, 50, 467–468. https://doi.org/10.3189/17275650478182998
Hou, S., Zhang, W., Pang, H., Wu, S., Jenk, T. M., Schwikowski, M., & Wang, Y. (2019). Apparent discrepancy of Tibetan ice core δ18
O records may be attributed to misinterpretation of chronology. The Cryosphere, 13(6), 1743–1752. https://doi.org/10.5194/tc‐13‐ 1743‐2019
Jenk, T., Szidat, S., Bolius, D., Sigl, M., Gäggeler, H., Wacker, L., et al. (2009). A novel radiocarbon dating technique applied to an ice core from the Alps indicating late Pleistocen ages. Journal of Geophysical Research, 114, D14305. https://doi.org/10.1029/2009JD011860 Jenk, T., Szidat, S., Schwikowski, M., Gäggeler, H., Wacher, L., Synal, H. A., & Saurer, M. (2007). Microgram level radiocarbon (14C)
determination on carbonaceous particles in ice. Nuclear Instruments Methods B, 259(1), 518–525. https://doi.org/10.1016/j. nimb.2007.01.196
Johnsen, S. J., Dansgaard, W., & White, J. W. (1989). The origin of Arctic precipitation under present and glacial condition. Tellus, 41(4), 452–468. https://doi.org/10.3402/tellusb.v41i4.15100
Joos, F., & Spahni, R. (2008). Rates of change in natural and anthropogenic radiative forcing over the past 20,000 years. Proceedings of The National Academy of Science of the United States of America, 105(5), 1425–1430. https://doi.org/10.1073/pnas.0707386105
Kang, S., Zhang, Y., Qin, D., Ren, J., Zhang, Q., Grigholm, B., & Mayewski, P. A. (2007). Recent temperature increase recorded in an ice core in the source region of Yangtze River. Chinese Science Bulletin, 52(6), 825–831. https://doi.org/10.1007/s11434‐007‐0140‐1
Acknowledgments
We are grateful to many scientists, technicians, graduate students, and porters involved infield and lab work, especially to Yongliang Zhang, Hao Xu, and Yaping Liu, for their great efforts in the high elevations, to Chaomin Wang and Chiara Uglietti for help in measuring the14C samples, and to
Guocai Zhu for providing the ground‐penetrating radar results of the Chongce ice cap. TraCE‐21 ka was made possible by the DOE INCITE computing program, and supported by NCAR, the National Science Foundation P2C2 program, and the DOE Abrupt Change and EaSM programs. This work was supported by the National Natural Science Foundation of China (91837102 and 41830644), the Ten‐thousand Talents Program, and the Priority Academic Program Development of Jiangsu Higher Education Institutions (PAPD).
Kobashi, T., Menviel, L., Jeltsch‐Thömmes, A., Vinther, B. M., Box, J. E., Muscheler, R., et al. (2017). Volcanic influence on centennial to millennial Holocene Greenland temperature change. Scientific Reports, 7, 1441. https://doi.org/10.1038/s41598‐017‐ 01451‐7
Kurbatov, A. V., Zielinski, G. A., Dunbar, N. W., Mayewski, P. A., Meyerson, E. A., Sneed, S. B., & Taylor, K. C. (2006). A 12,000 year record of explosive volcanism in the Siple Dome Ice Core, West Antarctica. Journal of Geophysical Research, 111, D12307. https://doi.org/ 10.1029/2005JD006072
Lang, T. J., & Barros, A. P. (2004). Winter storms in the central Himalayas. Journal of the Meteorological Society of Japan, 82, 829–844. https://doi.org/10.2151/jmsj.2004.829
Laskar, J., Robutel, P., Joutel, F., Gastineau, M., Correia, A. C. M., & Levrard, B. (2004). A long‐term numerical solution for the insolation quantities of the Earth. Astronomy & Astrophysics, 428, 261–285. https://doi.org/10.1051/0004‐6361:20041335
Liu, H., Liu, X., & Dong, B. (2017). Intraseasonal variability of winter precipitation over central Asia and the western Tibetan Plateau from 1979 to 2013 and its relationship with the North Atlantic Oscillation. Dynamics of Atmospheres and Oceans, 79, 31–42. https://doi.org/ 10.1016/j.dynatmoce.2017.07.001
Liu, X. D., & Chen, B. D. (2000). Climatic warming in the Tibetan Plateau during recent decades. International Journal of Climatology, 20(14), 1729–1742. https://doi.org/10.1002/1097‐0088(20001130)20:14<1729::AID‐JOC556>3.0.CO;2‐Y
Liu, X. K., Rao, Z. G., Zhang, X. J., Huang, W., Chen, J. H., & Chen, F. H. (2015). Variations in the oxygen isotopic composition of preci-pitation in the Tianshan Mountains region and their significance for the Westerly circulation. Journal of Geographical Sciences, 25(7), 801–816. https://doi.org/10.1007/s11442‐015‐1203‐x
Liu, Y., Zhang, M., Liu, Z., Xia, Y., Huang, Y., Peng, Y., & Zhu, J. (2018). A possible role of dust in resolving the Holocene temperature conundrum. Scientific Reports, 8(1), 4434. https://doi.org/10.1038/s41598‐018‐22841‐5
Liu, Z., Otto‐Bliesner, B. L., He, F., Brady, E. C., Tomas, R., Clark, P. U., et al. (2009). Transient simulation of last deglaciation with a new mechanism for Bolling‐Allerod warming. Science, 325(5938), 310–314. https://doi.org/10.1126/science.1171041
Liu, Z., Zhu, J., Rosenthal, Y., Zhang, X., Otto‐Bliesner, B. L., Timmermann, A., et al. (2014). The Holocene temperature conundrum. Proceedings of The National Academy of Science of the United States of America, 111, E3501–E3505. https://doi.org/10.1073/ pnas.1407229111
Ljungqvist, F. C. (2010). A new reconstruction of temperature variability in the extra‐tropical Northern Hemisphere during the last two millennia. Geografiska Annaler, 92A, 339–351. https://doi.org/10.1111/j.1468‐0459.2010.00399.x
Mann, M. E., Zhang, Z., Hughes, M. K., Bradley, R. S., Miller, S. K., Rutherford, S., & Ni, F. (2008). Proxy‐based reconstructions of hemi-spheric and global surface temperature variations over the past two millennia. Proceedings of The National Academy of Science of the United States of America, 105, 13,252–13,257. https://doi.org/10.1073/pnas.0805721105
Marcott, S. A., Shakun, J. D., Clark, P. U., & Mix, A. C. (2013). A reconstruction of regional and global temperature for the past 11,300 years. Science, 339(6124), 1198–1201. https://doi.org/10.1126/science.1228026
Marsicek, J., Shuman, B. N., Bartlein, P. J., Shafer, S. L., & Brewer, S. (2018). Reconciling divergent trends and millennial variations in Holocene temperatures. Nature, 554(7690), 92–96. https://doi.org/10.1038/nature25464
Masson‐Delmotte, V., Buiron, D., Ekaykin, A., Frezzotti, M., Gallée, H., Jouzel, J., et al. (2011). A comparison of the present and last interglacial periods in six Antarctic ice cores. Climate of the Past, 7(2), 397–423. https://doi.org/10.5194/cp‐7‐397‐2011
Maussion, F., Scherer, D., Mölg, T., Collier, E., Curio, J., & Finkelnburg, R. (2014). Precipitation seasonality and variability over the Tibetan plateau as resolved by the high Asia reanalysis. Journal of Climate, 27(5), 1910–1927. https://doi.org/10.1175/JCLI‐D‐13‐ 00282.1
Meyer, H., Opel, T., Laepple, T., Dereviagin, A. Y., Hoffmann, K., & Werner, M. (2015). Long‐term winter warming trend in the Siberian Arctic during the mid‐ to late Holocene. Nature Geoscience, 8(2), 122–125. https://doi.org/10.1038/ngeo2349
Moberg, A., Sonechkin, D. M., Holmgren, K., Datsenko, N. M., & Karlén, W. (2005). Highly variable Northern Hemisphere temperatures reconstructed from low‐ and high‐resolution proxy data. Nature, 433(7026), 613–617. https://doi.org/10.1038/nature03265
Mountain Research Initiative EDW Working Group. (2015). Elevation‐dependent warming in mountain regions of the world. Nature Climate Change, 5(5), 424–430. https://doi.org/10.1038/nclimate2563
PAGES 2k Consortium. (2013). Continental‐scale temperature variability during the past two millennia. Nature Geoscience, 6(5), 339–346. https://doi.org/10.1038/ngeo1797
PAGES 2k Consortium. (2017). A global multiproxy database for temperature reconstructions of the Common Era. Scientific Data, 4(1), 170088. https://doi.org/10.1038/sdata.2017.88
Pang, H., Hou, H., Kaspari, S., & Mayewski, P. A. (2014). Influence of regional precipitation patterns on stable isotopes in ice cores from the central Himalayas. The Cryosphere, 8(1), 289–301. https://doi.org/10.5194/tc‐8‐289‐2014
Pepin, N. C., & Lundquist, J. D. (2008). Temperature trends at high elevations: Patterns across the globe. Geophysical Research Letters, 35, L14701. https://doi.org/10.1029/2008GL034026
Rao, Z., Shi, F., Li, Y., Huang, C., Zhang, X., Yang, W., et al. (2020). Long‐term winter/summer warming trends during the Holocene revealed byα‐cellulose δ18
O/δ13
C records from an alpine peat core from central Asia. Quaternary Science Reviews, 232, 106217. https:// doi.org/10.1016/j.quascirev.2020.106217
Rao, Z., Wu, D., Shi, F., Guo, H., Cao, J., & Chen, F. (2019). Reconciling the“westerlies” and “monsoon” models: A new hypothesis for the Holocene moisture evolution of the Xinjiang region, NW China. Earth‐Science Reviews, 191, 263–272. https://doi.org/10.1016/j. earscirev.2019.03.002
Rehfeld, K., Trachsel, M., Telford, R. J., & Laepple, T. (2016). Assessing performance and seasonal bias of pollen‐based climate recon-structions in a perfect model world. Climate of the Past, 12(12), 2255–2270. https://doi.org/10.5194/cp‐12‐2255‐2016
Rozanski, K., Arguas‐Arguas, L., & Gonfiantini, R. (1992). Relation between long‐term trends of Oxygen‐18 isotope composition of pre-cipitation and climate. Science, 258(5084), 981–985. https://doi.org/10.1126/science.258.5084.981
Sigl, M., Jenk, T., Kellerhals, T., Szidat, S., Gäggeler, H., Wacker, H., et al. (2009). Towards radiocarbon dating of ice cores. Journal of Glaciology, 55(194), 985–996. https://doi.org/10.3189/002214309790794922
Sigl, M., Winstrup, M., McConnell, J. R., Welten, K. C., Plunkett, G., Ludlow, F., et al. (2015). Timing and climate forcing of volcanic eruptions for the past 2,500 years. Nature, 523(7562), 543–549. https://doi.org/10.1038/nature14565
Singh, D., Flanner, M. G., & Perket, J. (2015). The global land shortwave cryosphere radiative effect during the MODIS era. The Cyrosphere, 9(6), 2057–2070. https://doi.org/10.5194/tc‐9‐2057‐2015
Steinhilber, F., Abreu, J. A., Beer, J., Brunner, I., Christl, M., Fischer, H., et al. (2012). 9,400 years of cosmic radiation and solar activity from ice cores and tree rings. Proceedings of The National Academy of Science of the United States of America, 109, 5967–5971. https://doi.org/ 10.1073/pnas.1118965109
Stocker, T., Qin, D., Plattner, G.‐K., Tignor, M., Allen, S. K., Boschung, J., et al. (2013). Climate change 2013: The physical science basis. In Contribution of Working Group I to the Fifth Assessment Report of the Intergovernmental Panel on Climate Change(Chap. 2, pp. 159–254). Cambridge: Cambridge University Press.
Syed, F. S., Giorgi, F., & Pal, J. S. (2006). Effect of remote forcings on the winter precipitation of central southwest Asia part 1: Observations. Theoretical and Applied Climatology, 86(1–4), 147–160. https://doi.org/10.1007/s00704‐005‐0217‐1
Takeuchi, N., Fujita, K., Aizen, V. B., Narama, C., Yokoyama, Y., Okamoto, S., et al. (2014). The disappearance of glaciers in the Tien Shan Mountains in Central Asia at the end of Pleistocene. Quaternary Science Reviews, 103, 26–33. https://doi.org/10.1016/j.
quascirev.2014.09.006
Tang, Y. (2014). Holocene environment change inferred from the GDGTs from the peatland in Altai Mountains, Xinjiang of China. Master's Thesis. Lanzhou: Lanzhou University of China. (in Chinese)
Tang, Y., Pang, H., Zhang, W., Li, Y., Wu, S., & Hou, S. (2015). Effects of changes in moisture source and the upstream rainout on stable isotopes in precipitation—A case study in Nanjing, eastern China. Hydrology and Earth System Sciences, 19(10), 4293–4306. https://doi. org/10.5194/hess‐19‐4293‐2015
Thompson, L. G., Davis, M., Mosley‐Thompson, E., Lin, P., Henderson, K., & Mashiotta, T. (2005). Tropical ice core records: Evidence for asynchronous glaciation on Milankovitch timescales. Journal of Quaternary Science, 20(7–8), 723–733. https://doi.org/10.1002/jqs.972 Thompson, L. G., Mosley‐Thompson, E., Davis, M., Bolzan, J., Dai, J., Klein, L., et al. (1989). Holocene‐late pleistocene climatic ice core
records from Qinghai‐Tibetan Plateau. Science, 246(4929), 474–477. https://doi.org/10.1126/science.246.4929.474
Thompson, L. G., Yao, T., Davis, M., Mosley‐Thompson, E., Mashiotta, T., Lin, P., et al. (2006). Holocene climate variability archived in the Puruogangri ice cap on the central Tibetan Plateau. Annals of Glaciology, 43, 61–69. https://doi.org/10.3189/172756406781812357 Thompson, L. G., Yao, T., Davis, M. E., Henderson, K. A., Mosley‐Thompson, E., Lin, P.‐N., et al. (1997). Tropical climate instability: The
last glacial cycle from a Qinghai‐Tibetan ice core. Science, 276(5320), 1821–1825. https://doi.org/10.1126/science.276.5320.1821 Tian, L., Yao, T., Li, Z., MacClune, K., Wu, G., Xu, B., et al. (2006). Recent rapid warming trend revealed from the isotopic record in
Muztagata ice core, eastern Pamirs. Journal of Geophysical Research, 111, D13103. https://doi.org/10.1029/200JD006249
Tian, L., Yao, T., Schuster, P. F., White, J. W. C., Ichiyanagi, K., Pendall, E., et al. (2003). Oxygen‐18 concentrations in recent precipitation and ice cores on the Tibetan Plateau. Journal of Geophysical Research, 108(D9), 4293. https://doi.org/10.1029/2002JD002173 Uglietti, C., Zapf, A., Jenk, T. M., Sigl, M., Szidat, S., Salazar, G., & Schwikowski, M. (2016). Radiocarbon dating of glacier ice: Overview,
optimisation, validation and potential. The Cryosphere, 10(6), 3091–3105. https://doi.org/10.5194/tc‐10‐3091‐2016
Wang, N., Thompson, L. G., Davis, M. E., Mosley‐Thompson, E., Yao, T., & Pu, J. (2003). Influence of variations in NAO and SO on air temperature over the northern Tibetan Plateau as recorded byδ18
O in the Malan ice core. Geophysical Research Letters, 30(22), 2167. https://doi.org/10.1029/2003GL018188
Wang, Q., Fan, X., & Wang, M. (2014). Recent warming amplification over high elevation regions across the globe. Climate Dynamics, 43(1–2), 87–101. https://doi.org/10.1007/s00382‐013‐1889‐3
Winter, K. J. P. M., Kotlarski, S., Scherrer, S. C., & Schar, C. (2017). The Alpine snow‐albedo feedback in regional climate models. Climate Dynamics, 48(3–4), 1109–1124. https://doi.org/10.1007/s00382‐016‐3130‐7
Wu, D. D., Cao, J. T., Jia, G. D., Guo, H. C., Shi, F. X., Zhang, X. P., & Rao, Z. G. (2020). Peat brGDGTs‐based Holocene temperature history of the Altai mountains in arid central Asia. Palaeogeography, Palaeoclimatology, Palaeoecology, 538, 109464. https://doi.org/10.1016/j. palaeo.2019.109464
Yao, T., Duan, K., Xu, B., Wang, N., & Pu, J. (2002). Temperature and methane changes over the past 1000 years recorded in Dasuopu glacier (central Himalaya) ice core. Annals of Glaciology, 35, 379–383. https://doi.org/10.3189/172756402781816997
Yao, T., Masson‐Delmotte, V., Gao, J., Yu, W., Yang, X., Risi, C., et al. (2013). A review of climatic controls on δ18
O in precipitation over the Tibetan Plateau: Observations and simulations. Reviews of Geophysics, 51, 525–548. https://doi.org/10.1002/rog.20023
Yao, T., Thompson, L. G., Mosley‐Thompson, E., Yang, Z., Zhang, X., & Lin, P. (1996). Climatological significance of δ18
O in the north Tibetan ice cores. Journal of Geophysical Research, 101(D23), 29,531–29,537. https://doi.org/10.1029/96JD02683
Yao, T., Thompson, L. G., Yang, W., Yu, W., Gao, Y., Guo, X., et al. (2012). Different glacier status with atmospheric circulations in Tibetan plateau and surroundings. Nature Climate Change, 2(9), 663–667. https://doi.org/10.1038/nclimate1580
Yao, T., Xue, Y., Chen, D., Chen, F., Thompson, L. G., Cui, P., et al. (2019). Recent third pole's rapid warming accompanies cryospheric melt and water cycle intensification and interactions between monsoon and environment. Bulletin of the American Meteorological Society, 100(3), 423–444. https://doi.org/10.1175/BAMS‐D‐17‐0057.1
Zhang, D., & Feng, Z. (2018). Holocene climate variations in the Altai Mountains and the surrounding areas: A synthesis of pollen records. Earth‐Science Reviews, 185, 847–869. https://doi.org/10.1016/j.earscirev.2018.08.007
Zhang, Y., Renssen, H., Seppä, H., & Valdes, P. J. (2018). Holocene temperature trends in the extratropical Northern Hemisphere based on inter‐model comparisons. Journal of Quaternary Science, 33(4), 464–476. https://doi.org/10.1002/jqs.3027
Zhang, Y., Yang, P., Tong, C., Liu, X., Zhang, Z., Wang, G., & Meyers, P. A. (2018). Palynological record of Holocene vegetation and climate changes in a high‐resolution peat profile from the Xinjiang Altai Mountains, northwestern China. Quaternary Science Reviews, 201, 111–123. https://doi.org/10.1016/j.quascirev.2018.10.021
Zhang, Z., Hou, S., & Yi, S. (2018). Thefirst luminescence dating of Tibetan glacier basal sediment. The Cryosphere, 12(1), 163–168. https:// doi.org/10.5194/tc‐12‐163‐2018