First International Conference on Bio-based Building Materials
June 22nd - 24th 2015
Clermont-Ferrand, France
EXPERIMENTAL AND NUMERICAL EVALUATION OF THE HYGROTHERMAL
PERFORMANCE OF A HEMP-LIME BUILDING
B. Moujalled1*, Y. Aït-Oumeziane2, D. Samri1, E. Stéphan1, S. Moissette3, M. Bart3, C. Lanos3
1
CEREMA, DTer Sud-Ouest, Saint-Médard-en-Jalles, France
2 Université de Bordeaux, IUT de Bordeaux, I2M, Institut de Mécanique et d’Ingénierie,
Bordeaux, France
3 Université Européenne de Bretagne, IUT de Rennes, LGCGM Laboratoire de Génie Civil et
Génie Mécanique, Equipe Matériaux Thermo Rhéologie, Rennes, France *Corresponding author; e-mail: bassam.moujalled@cerema.fr
Abstract
Hemp-lime concrete (HLC) is a bio-based material which is currently undergoing a growing development. HLC is a low embodied energy material and an excellent hygrothermal regulator. Its thermal, hygric and mechanical properties are well known, and its capacity to reduce energy needs and to improve hygrothermal comfort was demonstrated across many laboratory and numerical studies. However, there are few works about its hygrothermal performance in real climatic conditions on the scale of a building. A French HLC individual dwelling-house was monitored during 2 years. Its envelope is made of 300mm thick sprayed HLC associated with a timber frame structure. Air temperature and relative humidity of each room were measured. Temperature and relative humidity of North and West facing walls were measured at their surfaces and inside the walls at two different depths. Besides heat flux is measured at the inside surface of the north wall. This paper presents the results collected in the framework of a field study to determine the transient hygrothermal behavior of HLC in real conditions. In-situ monitoring of walls temperatures shows the ability of HLC to almost completely dampen variations of external temperature with 11 hours time-shift. The evolution of indoor relative humidity confirms that HLC has an excellent moisture buffer performance. The analysis of the hygrothermal behavior of a wall is achieved by comparing measurements and numerical simulations results. In this study, two simulation tools are used and compared. The first tool is based on the well-known Wufi software and doesn’t take into account the hysteresis effect. In the second simulation tool, numerical simulations are performed with a hysteresis model implemented in a heat and moisture transfer model. Comparisons between numerical and experimental results highlight some influent parameters in the simulation of the hygrothermal response of a HLC wall in real climatic conditions.
Keywords:
Hemp-Lime concrete, hygrothermal behavior, in situ monitoring, numerical simulation
1 INTRODUCTION
In the context of sustainable development, one of the concerns in building construction is the choice of environmentally friendly materials. Indeed, it has some impacts on exhaustion of natural resources, energy consumption (for heating and cooling), and polluting emission. This study deals with Hemp-Lime Concrete (HLC) made of hemp shiv (renewable raw) and of lime (lower embodied energy than cement) [Boutin 2005]. Depending on its composition, it can be used for several applications: wall, floor and roof. HLC is characterized by a very unique porosity (more than 70% in volume for a ‘‘wall’’ mixture) and thus it has low dry density (around 400 kg.m-3 for a “wall” mixture). It
shows low compressive strength and is consequently mainly used as filling material associated with a wooden frame. However, HLC shows interesting hygrothermal properties for its use in buildings [Samri 2008, Chamoin 2013]. HLC is an excellent hygric regulator with a very good moisture buffer value [Collet 2012]. [Samri, 2008] has developed an experimental facility to analyze the hygrothermal response of HLC in comparison with two other usually used porous building materials. The results underline the role played by moisture content on the evolution of the hygrothermal properties (vapor permeability, moisture capacity…), contrary to aerated autoclaved concrete or vertically perforated brick, numerical modeling shows that HLC involves a strong interaction between heat transport and mass transfer. Moreover, HLC presents
a significant hysteretic behavior which conditions the evolution of the moisture content inside the material. Due to the hysteretic effect, the equilibrium moisture content depends not only on the relative humidity but also on the hygric history. Adsorption and desorption cycles measured in [Aït Oumeziane 2014] for HLC show the influence of hysteresis on the moisture content and hygric capacity evolutions.
The last researches on the transient hygrothermal response of HLC have been essentially led on the wall scale in laboratory conditions [Samri 2008, Colinart 2013, Lelievre 2014, Aït Oumeziane 2015]. In particular, these studies show the relevance to consider hysteresis and hygric history to improve numerical results [Lelievre 2014, Aït Oumeziane 2013, 2014, 2015]. Nevertheless, there are few works about its hygrothermal performance in real conditions. In order to predict the real hygrothermal behavior of this material, this paper presents a field study of transient hygrothermal behavior of a HLC building, located in South West of France. The main objective is to look for more realistic thermal and hygric characterization of hemp concrete at full scale and under real variable climatic conditions.
2 METHOD
2.1 Description of the HLC building
The construction is a 2-floor single-detached dwelling that hosts 4 people and has a surface of 250 m2 (Figure 1). It is located close to Perigueux in South West of France. It was built during 2011, and is occupied since December 2011. Its envelope is made of 30 cm thick HLC sprayed into walls of timber frame structure. HLC is also used in roof and intermediate floor in 10 cm and 15 cm thickness respectively. The walls are internally and externally protected with lime-sand plasters. The HLC was sprayed during April-May 2011, and the plasters were applied immediately after finishing the walls construction. The properties of the materials are presented in Table 1.
Fig. 1: View of the south façade of the building. Tab. 1: Properties of hemp concrete and plasters.
Material Density
Kg.m-3
λ value W.m-1.K-1 HLC in walls and floor
HLC in roof
450 220
0.11 0.06 Lime and plaster
(finishing plaster) 935 0.19 Lime and plaster
(exterior coarse) 1200 0.24
A pellet boiler coupled with 12.6 m² of solar collectors provides energy for heating and domestic hot water. Heat is distributed in the house through radiant floor at the ground level and radiant walls at the top level. A balanced ventilation system with heat recovery is used for ventilation.
2.2 Experimental method
Building envelope inspection
Thermographic survey and airtightness test were conducted in order to evaluate the envelope performance. The thermographic inspection helps to detect insulation defects, especially thermal bridging that may occur due to the timber frame structure. The blower door test helps to evaluate the level of air permeability, and to detect the air leakages through the envelope.
The thermographic survey was done using the FLIR Thermacam E4 infrared camera, and the airtightness testing with Blowerdoor Minneapolis® system.
Hygrothermal monitoring of indoor climate
In order to evaluate the thermal comfort, 8 Hobo data loggers monitored the air temperature and relative humidity in each room of the house. Data were recorded every 15 minutes. Special care was taken to prevent the probe from being subjected to radiation from neighboring heat sources.
Hygrothermal measurements of HLC walls
Temperature (T) and Relative Humidity (RH) monitoring was done for the West and North-facing walls of the home cinema room. The North-facing wall is sunless; it was monitored for comparison purposes with the West-facing wall. Both walls are made of 30 cm of HLC, and 3 cm of exterior lime-sand plaster. They are uncoated at the interior surface. Each wall was monitored as shown in Figure 2.
Two T/RH sensors (type S-THB-M008 from Onset) were placed within the wall at two different depths (15 and 25 cm from the interior surface). The sensors are 12 mm diameter. They were inserted into the wall through drilled holes at the specific depths. Once the sensors placed, holes were sealed with acrylic sealant. This measurement technique was validated by Samri [Samri 2008]. Two thermocouples (type TMC6-H from Prosensor), fixed with adhesive tape, measured the interior and exterior wall surface temperatures. The indoor air T and RH of the studied room were measured with a Hobo data logger. A weather station located near to the house recorded outdoor conditions. All data were monitored continuously from February 2012 with a time step of 15 minutes.
2.3 Numerical approach
Unfortunately, HLC hygrothermal properties were not experimentally determined. For this reason, hemp concrete hygrothermal properties experimentally determined in [Chamoin 2013] and modeled in [Aït Oumeziane 2013] are chosen. This hemp concrete has very close bulk density and heat conductivity as the hemp concrete of the studied house. For lime based plaster, hygrothermal properties given in WUFI database and reported by [Evrard 2008] are used. The density and thermal conductivity of WUFI lime plaster are higher than those given by the manufacturer for the used plaster. However its vapor diffusion resistance factor is relatively low (µ=7).
Fig. 2: Sensors mapping.
The hygrothermal performance of north HLC wall is simulated with two different simulation tools.
The first simulation tool used in this paper is WUFI Pro 5.1® software [Künzel, 1995]. WUFI is a one-dimensional simulation program that can model hygrothermal performance of porous materials. The program uses weather data to simulate in-situ conditions.
The second simulation tool uses the Matlab software. The model is fully described in [Aït Oumeziane 2013] and main points are reported in [Aït Oumeziane 2015]. In comparison with Wufi, Matlab gives more computational scopes to the users. In particular, advanced hysteresis models can be implemented. In this paper, Huang’s hysteresis model is chosen. This model gives the more consistent results in comparison with other hysteresis models [Aït Oumeziane 2013; Aït Oumeziane 2014] for the studied hemp concrete. In-situ monitored temperature and relative humidity are considered (outside and inside the studied room) for boundary conditions. Meteonorm weather files for the city of Bergerac are selected to take into account solar radiation.
3 RESULTS
3.1 Building envelope inspection
The thermographic inspection was performed in February 2013 with covered sky, and adequate temperature differential of 22°C between the interior and the exterior. Figure 3 shows the thermographic image of the exterior surfaces of the north/west corner of the house. The walls of the floor level are heated as being radiant walls. The exterior surface temperatures are clearly homogeneous. No structural thermal bridge due to the timber framework is observed.
The airtightness test indicates a poor result with an air permeability of 1.32 m3.h-1.m-2, more than twice as the French mandatory level (0.6 m3.h-1.m-2 for dwellings).
This can be explained by the shrinkage of the timber frame structure which creates gaps at the joints between the frame elements and interior finishing of the walls. Thermogram of Figure 4 shows air leakages at the joints between structural elements.
Fig. 3: Thermogram of the north and west facades of the building.
Fig. 4: Thermogram from the inside showing air leakages at joints between structural elements.
3.2 Thermal comfort analysis
Monitoring results are presented hereafter between February and March 2012 for winter conditions, and between June and September 2012 for summer conditions.
During winter, indoor air temperatures vary between 20 and 24°C with a mean of 21.5°C at the ground level, and 22.5°C at the floor level. Values of relative humidity vary between 25 and 45% with a mean of 35%. During summer, temperatures vary in a wider range from 21°C to 28°C, with a mean of 23°C at the ground level and 24°C at the floor level. Values of relative humidity vary between 40 and 60% with a mean of 55%.
Figures 5 and 6 show the coincidence of the measured psychrometric data and the comfort zones for the living room. The limits of the comfort zones are defined by the standard NF EN 15251 [NF, 2007]. During winter, T and RH values were in the comfort zone almost all the time (98% of the time). T exceeds sometimes 24°C because heating systems were not properly regulated. During summer, T and RH values were in the comfort zone 55% of the time. This can be explained by the fact that the living room was too cold rather than too hot. T exceeds 26°C during only 2% of the time. However, RH slightly exceeds the upper limit of 60% (18% of the time).
3.3 Hygrothermal behavior of the West wall Monitoring results of the West-facing wall are presented hereafter for the three coldest days of the winter and the three hottest days of the summer. The North-facing wall presents the same conclusion as for the West-facing wall.
Figures 7 and 8 present the measured T and RH from 26 to 28 February 2013. The indoor air temperature is maintained at 15°C due to the heating system, and the outdoor air temperature varies between -5°C and
10°C. The exterior surface temperature of HLC wall follows the variation of the outdoor T reaching a high peak in the afternoon due to the solar exposure. While the amplitude of the exterior surface T reaches more than 30°C, the temperature within the wall (at 15cm depth) varies in a narrower range of 2°C with an average of 10°C. Besides we observe a time shift of 11 hours between the peaks. This means that T within the wall increases when the outdoor T is the coldest. As for T, RH of indoor air and within the wall at 15cm depth are stable (48% and 70% respectively), while the outdoor RH varies from 50% up to 100%. RH at 25cm depth varies in a wider ranger (between 77% and 89%). 0 5 10 15 20 25 10 15 20 25 30 H u m id it y r a ti o ( g v a p /k g d ry a ir )
Dry bulb temperature (°C)
Winter comfort zone Living - winter
Fig. 5: Coincidence of measured psychometrics data with winter comfort.
0 5 10 15 20 25 10 15 20 25 30 H u m id it y r a ti o ( g v a p /k g d ry a ir )
Dry bulb temperature (°C)
Summer comfort zone Living - summer
Fig. 6: Coincidence of measured psychometric data with summer comfort.
Figures 9 and 10 show the measured T and RH for summer conditions. The results are the same as above. While the outdoor T and RH vary in a wide range (up to 60°C for the exterior surface T), T and RH variations within the wall (at 15 cm) are limited to 2°C and 4% respectively.
The HLC wall shows a high damping capacity (above 90%) and time shift up to 11 hours. The ability of the building to dampen the external oscillations and to delay such effects is fundamental to avoid summertime overheating.
In a recent experimental work, [Shea, 2012] reported similar results. Furthermore, they are in accordance with simulations performed by [Evrard, 2008].
However, the HLC wall is still drying even though the measurements were undertaken one year after the walls construction. Indeed, RH values within the wall are slightly high (around 80%) and need to be further examined in order to evaluate the risk of mold development. One of the reasons would be the fact that the lime-sand plaster was applied shortly after the
walls construction. Besides the outdoor RH showed high values over the period of the measurements (daily average varies between 60 and 95%). This may result in a significantly longer drying time.
-10 -5 0 5 10 15 20 25 30 35 26/02/13 27/02/13 28/02/13 01/03/13 T e m p é ra tu re ( °C )
Tair_ext Tsurface_ext Twall_25cm Twall_15cm Tsurface_int Tair_int
Fig. 7: Temperature within the west facing wall from 26 to 28 February 2013. 0 10 20 30 40 50 60 70 80 90 100 26/02/13 27/02/13 28/02/13 01/03/13 R e la ti v e h u m id it y ( % ) RHair_ext RH_wall_25cm RH_wall_15cm RHair_int
Fig. 8: Relative humidity within the west facing wall from 26 to 28 February 2013. 10 20 30 40 50 60 70 16/08/12 17/08/12 18/08/12 19/08/12 T e m p é ra tu re ( °C )
Tair_ext Tsurface_ext Twall_25cm Twall_15cm Tsurface_int Tair_int
Fig. 9: Temperature responses within the west facing wall from 16 to 18 August 2012.
0 10 20 30 40 50 60 70 80 90 100 16/08/12 17/08/12 18/08/12 19/08/12 R e la ti v e h u m id it y ( % ) RHair_ext RH_wall_25cm RH_wall_15cm RHair_int
Fig. 10: Relative humidity responses within the west facing wall from 16 to 18 August 2012.
4 SIMULATION OF THE HYGROTHERMAL RESPONSE OF THE WALL
In this section, the hygrothermal behavior of the north wall is calculated with Wufi and Matlab models and the results are compared to the measurements. Simulations are set up during a period of one year from 1st July 2012 to 30 June 2013. The measured T and RH of the indoor and outdoor environments in contact with the north wall are used as the climatic boundary conditions. The interior and exterior heat transfer coefficients considered in the simulations are 7.7 and 25 w.m-2.K-1 respectively. The solar absorption coefficient is set to 0.6 and the emissivity coefficient to 0.9. The interior and exterior surface mass exchange coefficients are 2.5 10-8 and 1.3 10-7 kg.Pa-1.m-2.s-1
respectively. The initial values of the wall T and RH are 25°C and 92% respectively.
The first two sets of simulations do not consider the hysteresis phenomenon, while the other simulations take into account hysteresis using only the Matlab software.
4.1 Analysis of the solar radiation influence As the solar radiation was not measured, the Meteonorm solar data of Bergerac city (located at 40 km from the site) has been considered. This first set of simulations aims to analyze the impact of the solar radiation on the calculated temperature. Figure 11 shows the evolution of the measured T of the exterior surface (Tse_exp) compared to the calculated T by Wufi and Matlab with and without solar radiation during two weeks of August. The results show a close agreement between Wufi and Matlab simulations for both cases. However the calculated T without solar radiation underestimated the measured values by 2 to 5°C. The solar radiation significantly reduces the discrepancies between measurements and simulations results. Therefore it will be taken into account in the following simulations; even though the solar radiation values are issued form Meteonorm1 and are not the
real in situ values.
Fig. 11: Comparison of wall T at the exterior surface between measurements, Wufi and Matlab simulations
4.2 Comparison between experimental, wufi and matlab numerical results
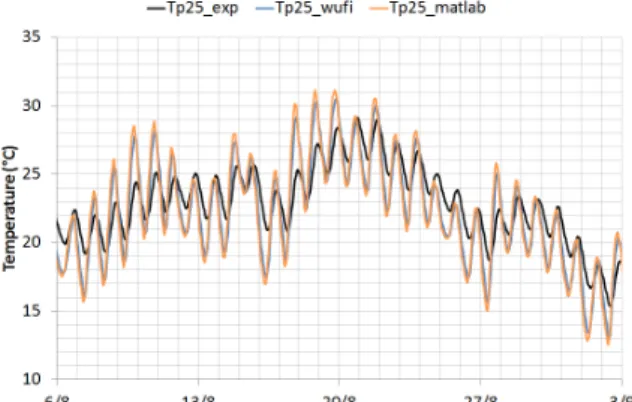
This second set of simulations presents comparisons between experimental and numerical temperature and relative humidity during summer and winter conditions. Figures 12 and 13 show the results for T at 25cm and 15cm depth during August respectively, and Figures
1 Meteonorm is a meteorological database for energy
application. The weather file is issued from the Meteonorm database included in TRNSYS software.
14 and 15 during March. As seen before, Wufi and Matlab simulations show a quite good agreement in all cases. However simulated T is lower by 2-3°C during winter. In fact, interior surface temperature is modified due to wall covering added by the occupants during September 2012. The interior covering layer creates additional thermal and hygric resistances that cannot be considered in simulations.
Fig. 12: Comparison of wall T at 25cm depth between measurements and simulations during August
Fig. 13: Comparison of wall T at 15cm depth between measurements and simulations during August
Fig. 14: Comparison of wall T at 25cm depth between measurements and simulations during March
Figures 16 and 17 show the results for RH at 25cm and 15cm depth respectively during the year.
As for T, Wufi and Matlab simulations show a very close agreement. However during the stage of adsorption between October and March, the Matlab RH increases slightly higher than Wufi (especially at 25 cm depth). One reason could be that Wufi and Matlab take into account differently the liquid transport coefficient. Matlab model uses an analytical equation to calculate the liquid transport coefficient depending on the moisture content, whereas Wufi uses a
numerical table with logarithmic interpolation between the table entries.
0 5 10 15 20 4/3 11/3 18/3 25/3 1/4 Te m p e ra tu re ( °C )
Tp15_exp Tp15_wufi Tp15_matlab
Fig. 15: Comparison of wall T at 15cm depth between measurements and simulations during March
When compared to measurements, the Wufi and Matlab simulations are not able to reproduce daily variations. However the yearly evolution is quite close to the experiment until March 2013. From this date to the end of the simulation, Wufi and Matlab RH decreased significantly at both studied depths while the experimental values increased slowly. Several reasons can explain this difference. First, the models don’t take into account the hysteresis in the sorption isotherm. [Kwiatkowski, 2009] confirms, through a sensitivity analysis, that in realistic conditions (which is our case with a room under variable climate and hygrothermal loads), neglecting hysteresis leads to overestimation of moisture buffering properties of material in contact with the indoor air. Also the surface exchange coefficients and the hygrothermal properties of the coating material add further element of uncertainties These elements are investigated in the following sections with the Matlab model.
Fig. 16: Comparison of wall RH at 25cm depth between measurements and simulations over the
year
Fig. 17: Comparison of wall RH at 15cm depth between measurements and simulations over the year
4.3 Influence of hysteresis
In this paragraph, hysteresis phenomenon is considered. In Matlab, Huang’s hysteresis model, selected to represent HLC hygric sorption process, is implemented in the heat and moisture transfer model. Figures 18 and 19 show for both studied depths that relative humidity significantly decreases with hysteresis during the first desorption stage from 1st July to the end of September. During this stage, moisture content does not follow the main adsorption curve but a primary desorption curve. Consequently, hygric capacity is significantly reduced which explains the shape of the curve. During the second stage of adsorption between the beginning of October and the beginning of March, moisture content follows a secondary adsorption curve. This curve has also a reduced hygric capacity in comparison with the main adsorption curve, case for which hysteresis is not considered. Finally, during the last desorption stage, moisture content follows a tertiary desorption curve. Moreover, figure 19 shows that hysteresis is also not able to reproduce the experimental evolution of RH at depth 15 cm during the last desorption stage.
Temperature evolutions are not presented in this paper but hysteresis does not create significant modifications in this case.
Despite a more physical and realistic description of the sorption process, numerical results obtained with hysteresis seem worse than without.
One can wonder if some parameters or physical phenomena are inadequately or incompletely modeled.
Fig. 18: Evolution of RH at depth 25cm: comparison between Matlab models with and without hysteresis
Fig. 19: Evolution of RH at depth 15cm: comparison between Matlab models with and without hysteresis
4.4 Influence of exchange coefficients
In this section, the influence of the surface exchange coefficients is discussed. The simulations are performed with hysteresis modeling.
Standard interior surface exchange coefficients are quite representative of the effective values. Natural convection on a vertical wall located in a room at ambient temperature around 20°C and, at a lesser degree, radiative contribution of the house lighting are well taken into account with a surface heat exchange coefficient about 8 W.m-2.K-1.
Likewise, the Lewis relation gives a representative value of interior surface mass exchange coefficient about 2.5 10-8 kg.Pa-1.m-2.s-1.
Discussion should rather be focused on exterior surface exchange. The exterior surface of the wall is submitted to natural convection due to the thermal gradient between exterior air and the wall surface temperature, to forced convection due to wind, to solar radiation and to wind-driven rain. All these phenomena are significantly weather-dependent and may highly fluctuate during all the year. The nature of the material of the exterior surface plays also a significant role. The constant standard values of surface heat and mass exchange coefficients respectively of 25 W.m-2.K-1 and
1.3 10-7 kg.Pa-1.m-2.s-1 are probably not representative of the real conditions.
To lead the discussion, the surface heat coefficient of 25 W.m-2.K-1 is kept. Only exterior surface mass exchange coefficient hm,ext is studied. In addition to the
reference value, two other values are investigated: 10-8
kg.Pa-1.m-2.s-1 and 10-9 kg.Pa-1.m-2.s-1.
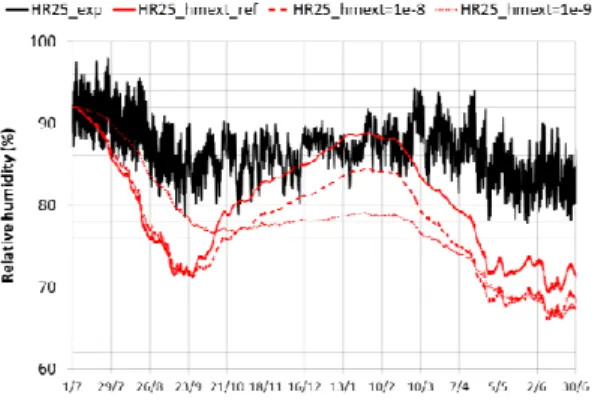
Figure 20 and 21 show the impact of the exterior surface mass exchange coefficient on the relative humidity evolutions at depths 25 cm and 15 cm.
Fig. 20: Evolution of RH at depth 25cm: influence of the exterior surface mass exchange coefficient
Fig. 21: Evolution of RH at depth 15cm: influence of the exterior surface mass exchange coefficient
The lower the surface mass exchange coefficient, the lower are the variations of relative humidity inside the wall. Indeed, a low value of hm,ext reduces the rate of
moisture released or uptaken by the wall. The results of this study show that the exterior surface mass
exchange coefficient has a significant influence on relative humidity evolutions.
In winter, rain is more frequent than in summer and can participates in surface exchange by increasing the rate of moisture entering in the wall. This phenomenon has to be considered in future works. Globally, a better modeling of exterior surface exchange (wind, radiation, rain…) should improve the numerical results.
The nature of the coating in lime-sand plaster may play a significant role in the distribution of relative humidity in HLC. Two hypotheses can be raised: either exchange between lime-sand plaster and exterior air is not efficiently modeled or moisture transfer in lime-sand plaster is overestimated.
4.5 Influence of the coating material
In this section, the influence of the coating material properties is investigated. Indeed, the lime based plaster used in the previous simulations has a low vapor diffusion resistance factor µ = 7. This value seems too low for the lime-sand plaster knowing its low open porosity. For this reason, the vapor diffusion resistance factor is chosen three times higher at µ=21. This modification changes the value of the vapor permeability and consequently affects moisture transport in the coating material. Standard surface heat and mass exchange coefficients are selected. Hysteresis is still taken into account. The results of the simulation are presented in figures 22 and 23.
Fig. 22: Evolution of RH at depth 25cm: influence of vapor diffusion resistance factor
Fig. 23: Evolution of RH at depth 15cm: influence of vapor diffusion resistance factor
The results show that the coating material significantly affects moisture transfer in HLC. The identification of its effective hygrothermal properties has to be a priority.
5 DISCUSSIONS AND RESULTS
In this paper, a field study of a hemp-lime building located in South-West of France is proposed. It
presents the monitoring results of thermal comfort and hygrothermal behavior of two walls, and a comparison with the numerical simulations.
Building envelope inspections show a good level of insulation for the 30 cm thick HLC walls with homogeneous temperature at the exterior surfaces. However, the exposed timber frame breaks the continuity of the finishing plaster. The shrinkage of the timber frame creates gaps at the joints between the frame elements and interior finishing of the walls. Due to air leakages at these locations, the result of the envelope airtightness test was poor. This problem can be avoided by applying a continuous plaster over the internal face of the walls.
The in situ monitoring of the building has confirmed the ability of HLC to maintain hygrothermal conditions at winter and summer comfort levels while outside T and RH daily variations are up to 15°C and 50% respectively. It confirms the global idea that bio-based materials are good indoor climate regulators. The measurements inside walls showed a high thermal inertia, which allowed them to dampen the daily variations by 90% and to delay the effects of peak values up to 11 hours. However, RH values within the wall are slightly high and need to be further examined in order to evaluate the risk of moulds development. Numerical results seem in a quite good agreement with experimental T and RH evolutions inside the walls. Nevertheless, despite a more physical representation of the effective hygric behavior of HLC, numerical simulations with hysteresis give poorer results than without. In this paper, the analysis of the influence of the exterior surface mass exchange coefficient highlights the necessity to improve the modeling of the exterior surface exchanges (rain, wind…).
An uncertainty remains concerning the effective hygrothermal properties of the materials especially for the coating in lime-sand plaster. Further investigations have to be done in the future.
If simulations are able to represent the global trends of T and RH evolutions on the scale of a year, they cannot describe the daily variations of RH. The effect of the temperature on the sorption process, not addressed in this paper, gives promising results as for relative humidity as temperature evolutions. Moreover, since the construction of the building, walls have been submitted to continuous variations of climatic conditions before the beginning of the measures. Consequently, hygrothermal history should be taken into account.
The monitoring will continue until the end of 2015 in order to cover three full years, offering the possibility to study the drying of HLC. Besides, a complete weather station has been installed in December 2014 with solar radiation and rain measurements for future comparisons between experimental and numerical simulations.
6 REFERENCES
[Aït Oumeziane 2013] Aït Oumeziane Y., Evaluation des performances hygrothermiques d'une paroi par simulation numérique : application aux parois en béton
de chanvre. Ph.D. thesis. France : INSA de Rennes, 2013.
[Aït Oumeziane 2014] Aït Oumeziane Y. ; Bart M. ; Moissette S. ; Lanos C. ; Hysteretic Behaviour and Moisture Buffering of Hemp Concrete. Transport in Porous Media, July 2014, Volume 103, Issue 3, pp 515-533.
[Aït Oumeziane 2015] Aït Oumeziane Y. ; Bart M. ; Moissette S. ; Lanos C. ;Colet F., Pretot S.; Hysteresis phenomenon in hemp concrete. ICBBM, Clermont-Ferrand, France, 22nd-24th June 2015.
[Boutin 2005] Boutin, M.P. ; Flamin, C. ; Quinton, S. ; Gosse, G. ; Etude des caractéristiques environnementales du chanvre par l’analyse de son cycle de vie. France: INRA Lille, 2005.
[Chamoin 2013] Chamoin J., Optimisation des propriétés (physiques, mécaniques et hydriques) de bétons de chanvre par la maîtrise de la formulation. Ph.D. thesis. France : INSA de Rennes, 2013.
[Colinart 2013] Colinart, T. ; Glouannec, P.; Pierre, T., Chauvelon, P.; Magueresse, A.; Experimental Study on the Hygrothermal Behavior of a Coated Sprayed Hemp Concrete Wall. Buildings, 2013, Volume 3, Issue 1, pp 79-99.
[Collet 2012] Collet, F.; Pretot, S.; Experimental investigation of moisture buffering capacity of sprayed hemp concrete. Construction and Building Materials, November 2012, Volume 36, pp 58-65.
[Evrard 2008] Evrard, A.; Transient hygrothermal behaviour of Lime-Hemp Materials. Ph.D. Thesis. Belgique: Université Catholique de Louvain, 2008. [Evrard 2010] Evrard, A.; De Herde, A.; Hygrothermal performance of lime-hemp wall assemblies. Journal of Building Physics, July 2010, Volume 34, Issue 1, pp 5-25.
[Künzel 1995] Künzel, HM.; Simultaneous Heat and Moisture Transport in Building Components – One and Two dimensional calculation using simple parameters. Germany: IBP Fraunhofer, 1995.
[Kwiatkowski 2009] Kwiatkowski, J.; Woloszyn, M.; Roux, J.J.; Modelling the hysteresis influence on mass transfer in building materials. Building and Environment, March 2009, Volume 44, Issue 3, pp 633-642.
[Lelievre 2014] Lelievre D.; Colinart, T.; Glouannec, P.; Hygrothermal behavior of bio-based building materials including hysteresis effects: Experimental and numerical analyses. Energy and Buildings, November December 2014, Volume 84, pp 617-627.
[NF 2007] NF EN 15251; Indoor environmental input parameters for design and assessment of energy performance of buildings addressing indoor air quality, thermal environment, lighting and acoustics. France: AFNOR, 2007.
[Samri 2008] Samri, D. ; Analyse physique et caractérisation hygrothermique des matériaux de construction : approche expérimentale et modélisation numérique. Ph.D. thesis. France : INSA de Lyon, 2008. [Shea 2012] Shea A., Lawrence M., Walker P.; Hygrothermal performance of an experimental hemp-lime building. Construction and Building Materials, November 2012, Volume 36, 270–275.