HAL Id: hal-00316221
https://hal.archives-ouvertes.fr/hal-00316221
Submitted on 1 Jan 1996
HAL is a multi-disciplinary open access
archive for the deposit and dissemination of sci-entific research documents, whether they are pub-lished or not. The documents may come from teaching and research institutions in France or abroad, or from public or private research centers.
L’archive ouverte pluridisciplinaire HAL, est destinée au dépôt et à la diffusion de documents scientifiques de niveau recherche, publiés ou non, émanant des établissements d’enseignement et de recherche français ou étrangers, des laboratoires publics ou privés.
Enhancement of stratospheric aerosols after solar proton
event
O. I. Shumilov, E. A. Kasatkina, K. Henriksen, E. V. Vashenyuk
To cite this version:
O. I. Shumilov, E. A. Kasatkina, K. Henriksen, E. V. Vashenyuk. Enhancement of stratospheric aerosols after solar proton event. Annales Geophysicae, European Geosciences Union, 1996, 14 (11), pp.1119-1123. �hal-00316221�
Ann. Geophysicae 14, 1119—1123 (1996) ( EGS — Springer-Verlag 1996
Enhancement of stratospheric aerosols after solar proton event
O. I. Shumilov1, E. A. Kasatkina1, K. Henriksen2,*, E. V. Vashenyuk31 High-Latitude Geophysical Laboratory of St. Petersburg Filial of IZMIRAN, Post Box 123, 184200 Apatity, Russia 2 The Auroral Observatory, University of Tromso, 9037 Tromso, Norway
3 Polar Geophysical Institute, Apatity, Russia
Received: 23 August 1995/Revised: 27 March 1996/Accepted: 17 April 1996
Correspondence to: E. A. Kasatkina *deceased
Abstract. The lidar measurements at Verhnetulomski ob-servatory (68.6°N, 31.8°E) at Kola peninsula detected a considerable increase of stratospheric aerosol concen-tration after the solar proton event of GLE (ground level event) type on the 16/02/84. This increase was located at precisely the same altitude range where the energetic solar protons lost their energy in the atmosphere. The aerosol layer formed precipitated quickly (1—2 km per day) during 18, 19, and 20 February 1984, and the increase of R(H) (backscattering ratio) at 17 km altitude reached 40% on 20/02/84. We present the model calculation of CN (con-densation nuclei) altitude distribution on the basis of an ion-nucleation mechanism, taking into account the ex-perimental energy distribution of incident solar protons. The meteorological situation during the event was also investigated.
1 Introduction
It is now well documented that heterogeneous chemistry triggering ozone destruction occurs on sulfate aerosols (Tolbert et al., 1988; Hofman and Solomon, 1989). The main sources of sulfate aerosols in atmosphere are vol-canic eruptions, anthropogenic emissions and biological activity. Contribution of each component to aerosol layer formation in the stratosphere differs in the two hemi-spheres and depends on latitude. The anthropogenic pol-lution seems to be the major contributor of sulfuric acid in Arctic region compared with Antarctic where the phytop-lankton emissions seem to prevail (Langner et al., 1992). However, volcanos also sometimes play a dominant role as sources of sulfur injections into the stratosphere. For example, the eruption of Mount Pinatubo (1991) caused increases in sulfuric acid abundance by a factor of 50 (Tolbert, 1994). Another source of stratospheric aerosols
exists in nature besides those already mentioned. The mechanism of ion nucleation triggering by solar cosmic ray ionization was suggested by Arnold (1982) as a poten-tial source of condensation nuclei (CN) on which strato-spheric sulfate aerosols can form (Arnold, 1982; Hofman and Rosen, 1983).
Ion nucleation involves growth of ions by association of sulfuric acid molecules to a critical size at which the resulting molecular cluster is stable against ion-ion re-combination. The rate of formation of nuclei is propor-tional to the ion production rate, and thus temporal and spatial changes of atmospheric ionization due to solar and galactic cosmic rays may induce corresponding changes of condensation nuclei concentration.
The creation of sulfate aerosols by means of ion nuclea-tion mechanism seems to be a possible reason for the ozone ‘‘minihole’’ appearance resulting from a set of het-erogeneous chemical reactions after solar proton events of GLE type in May 1990 at Spitsbergen (Shumilov et al., 1992; 1995). In this work the mechanism of aerosol forma-tion during the GLE event on 16 February 1984 is dis-cussed.
2 Experimental results
The solar proton event (SPE) of 16 February 1984 was detected at 08 : 58 UT and was caused by a solar flare behind the W-limb of the Sun. It had a very rigid energy spectrum and belonged to the GLE type of SPE. The maximum intensity of solar protons during the GLE reached 5 particles cm~2 s~1 ster~1 for energies between 84 and 200 MeV (Hargreaves et al., 1987). Figure 1 shows the Apatity (U@"63.3°) neutron monitor data for Febru-ary 1984.
During February 1984 the stationary lidar operated at Verhnetulomski observatory (68.6°N, 31.8°E) located in the Murmansk region. At the lidar the diameters of receiv-ing and transmittreceiv-ing telescopes were 50 cm and 20 cm, respectively. Two lasers with emission wavelengths of 694.3 nm and 532.0 nm were used in the lidar. All profiles
Fig. 1. Hourly count rates of the neutron monitor at Apatity ob-servatory from 12 to 21 February 1984
Fig. 2. The vertical profiles of scattering ratio R(H), l"694.3 nm taken on 15, 18, 19, and 20 February 1984 at Verhnetulomski observatory. Dashed curves give the quiet day level averaged for previous five undisturbed days
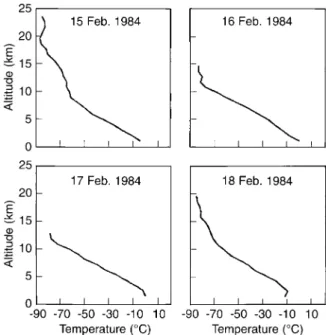
Fig. 3. Temperature profiles measured by balloons on 15, 16, 17, and 18 February 1984 above Murmansk observatory
shown here relate to the 694.3 nm channel. The ruby laser has wavelength of 694.3 nm, pulse repetition — 1 Hz, en-ergy per pulse — 0.4 J and pulse width — 30 ns. To limit the background emission an interference filter with 1.8 nm bandwidth and 0.4 transmission coefficient is used in the receiver. Lidar permits measurements in an altitude range between 3 and 40 km with vertical resolution of 1.5 km.
In Fig. 2 profiles of aerosol backscatter ratio R (H) at wavelength of 694.3 nm are shown. The expression for aerosol backscatter ratio is as follows:
R(H)"(bmol#baer)/bmol, (1) wherebmol and baer are molecular and aerosol backscatter-ing respectively. Figure 2 shows 15, 18, 19, and 20 Febru-ary R(H) profiles relative to the curve of average values for previous five undisturbed days. The lidar measure-ments on 16 and 17 February were absent because of bad weather conditions. The aerosol backscatter increase on 18 February 1984 between 15 and 25 km altitude can be seen (Fig. 2).
To examine the influence of meteorological factors an analysis of the meteorological situation over the Kola peninsula region has been made. The 100-hPa meteoro-logical map analysis has shown that during the period from 13 February to 20 February, the Kola peninsula was in the coldest part of the circumpolar vortex. Some altitude temperature profiles are shown in Fig. 3. These profiles were obtained at Murmansk meteorological ob-servatory (68.3°N, 33°E) located close to Verhnetulomski observatory. Figure 3 clearly shows that the temperatures are low enough for PSC formation.
Additional information about the meteorological situ-ation before and after GLE event considered may be obtained from Fig. 4 where the 100-hPa (16-km altitude) temperatures for Kola peninsula during the second half of February 1984 are shown. The arrows indicate the tem-perature at which Type-1 PSCs can be formed (Nagatani
et al., 1990). Figure 4 demonstrates that the 100-hPa
tem-peratures were sufficiently low, and PSC activity could be expected over Kola peninsula between 13 February and 21 February. However, the aerosol enhancement seems not to be related to the temperature decrease on 16 Febru-ary (!84 °C). The same extreme cold temperature was observed on 13 February (!83 °C) without any aerosol backscatter ratio R(H) changes (for reference see Figs. 2, 3). It seems reasonable to say that the PSC could form even before 13 February, and the additional
temper-ature decrease observed on 16 February could not lead to PSC formation. We therefore assume the aerosol increase observed between 15 km and 20 km was probably caused by a GLE event.
Fig. 4. 100-hPa temperatures over Kola peninsula from 13 Febru-ary to 23 FebruFebru-ary 1984. Arrows indicate the threshold temperatures for type 1 PSC formation
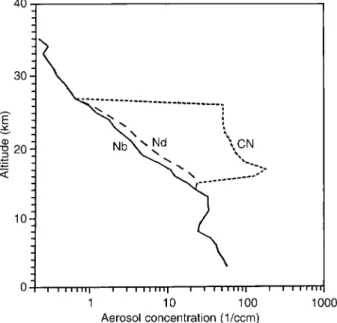
Fig. 5. Aerosol concentration profiles calculated from experimental lidar measurements on 15 February 1984 (Nb) is quiet day level, and on 18 February 1984 (Nd) is disturbed level. Curve CN (condensa-tion nuclei) gives CN concentra(condensa-tion profile calculated for GLE event using ion nucleation mechanism
3 Data analysis and discussion
Figure 2 shows aerosol backscatter increase on 18 Febru-ary 1984 relative to the average profile for the previous 5 days. The increase was not associated with considerable temperature enhancements (see Fig. 3) and seems to be caused by the GLE event on 16 February 1984.
Taking into consideration that bmol"nmpm and baer"napa, where pm and pa are molecular and aerosol backscattering cross sections, and nm, na are molecular and aerosol concentrations, respectively, Eq. (1) can be rewritten as:
R!1"(pana)/(pmnm). (2)
Aerosol concentration can be derived from backscat-tering ratio at 694.3 nm (R0.69). A reasonable aerosol backscattering cross section pa"2.5·10~11 cm2ster~1 and molecular backscattering cross section pm" 2 · 10~28 cm2 ster~1 at the 694.3 nm wavelength are taken from DeLuisi et al. (1975) and Kent and Wright (1970) respectively. Substitutingpa and pm and assuming them to be independent of altitude, from Eq. (2) we obtain:
na"0.8 ·10~17 (R0.69!1) nm. (3) Using the backscatter ratio profile R0.69(H) and a simple model of the atmosphere (Russel et al., 1979), we have calculated from Eq. (3) the height profile of aerosol con-centration.
In Fig. 5 the experimental aerosol background profile (Nb) and disturbed aerosol profile (Nd) of 18 February 1984 are shown. These experimental values correspond to ordinary altitude distribution of aerosol particles with sizes r50.69lm (Hofman et al., 1983). Calculated aerosol densities have errors limited by 4% (DeLuisi et al., 1975; Bajdalov, 1978). Figure 5 shows that aerosol concentra-tion increase on 18 February 1984 was about 50%.
To calculate ion production rate Q(cm~3 s~1) we have used the following equation:
Q(H)"(2n/e) ·=:
E1D(E)EL*(E) dE,
(4) where EL*(E) is the energy loss in the ith altitude slab in MeV (Jackman et al., 1980), ande"35 eV is the energy
needed for one ion-electron pair production. D(E) is the differential energy spectrum of incident protons (cm~2 s~1 sr~1 MeV~1) taken from Hargreaves et al. (1987), and E1 is the energy of Murmansk observatory geo-magnetic cut-off calculated as 150 MeV approximately.
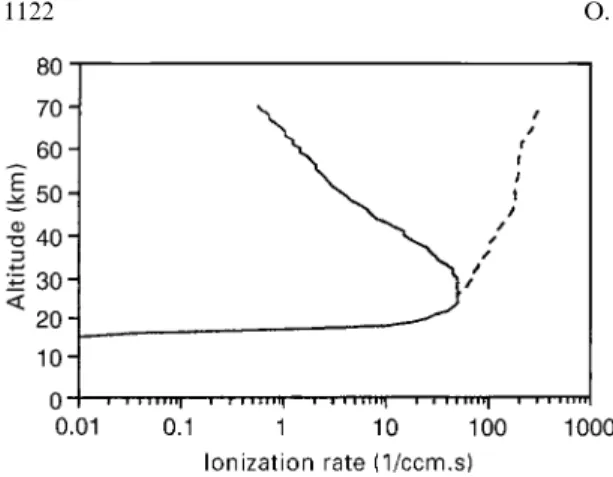
Figure 6 shows the ion production rate profile cal-culated at the maximum intensity on 16 February 1984 GLE event for E1"150 MeV (solid curve) and for E1"0 (dashed curve). E1"0 for geomagnetic polar cap region because the solar protons at all energy levels have free access to an atmosphere there. From Fig. 6 it is clear that these two curves have a considerable difference only above 30 km altitude.
Ion nucleation rate J (cm~3 s~1) is related to ion pro-duction rate Q by the equation (Hofman and Rosen, 1983):
J"Q · (1#(aQ)1@2/K[H2SO4])~Nc, (5) where a is the ion recombination coefficient (10~7 cm3 s~1), K is the association rate coefficient (10~9 cm2 s~1), and [H2SO4] is the molecular concentra-tion of H2SO4. Nc is the number of H2SO4 molecules in a critically sized embryo. In stratospheric conditions only molecules of H2SO4 and water can form stable clusters, and Nc is 3 (h427 km) and 10 (h'27 km) respectively (Arnold, 1982).
Figure 5 shows the condensation nuclei (CN) profile calculated for the 16 February 1984 GLE event using Eq. (5) and altitude distribution of H2SO4 for winter conditions (Arnold, 1982). As we can see from the Fig. 5, calculated values of CN are one order greater than experi-mental ones of Nd. Note that high and low levels of CN increase coincide with experimental ones. The high level (h"27 km) corresponds to the altitude of H2SO4 max-imum supersaturation (Arnold, 1982); the low one
Fig. 6. Ionization rate profiles calculated for GLE event of 16 Feb-ruary 1984 at time of its maximum. Solid curve gives ionization rate profile calculated with geomagnetic cut-off E1 at 150 MeV, and dashed curve gives ionization rate profile calculated when E1"0
(h"16 km) is related to ionization rate decrease (see Fig. 6). But we have to take into account the fact that aerosol particles detected by lidar have radii of more than 0.69lm compared with smaller radii of CN at 0.01 lm (Arnold, 1982). These radii differences can be reduced by involving coagulation process in terms of a kinetic equa-tion (Twomey, 1977): dN/dt"0.5=: 0 = : 0K(X1, X2)n(X1)n(X2) dX1 dX2, (6)
where N is the total number of particles, n(X1) and n(X2) are the numbers of particles of sizes X1 and X2 respective-ly, and K(X1,X2) is the coagulation coefficient. In our case we have CN where radius is 0.01lm and aerosol particles where radius is more than 0.69lm. So, Eq. (6) may be rewritten as:
dN/dt"!0.5K1n2!K2nNb, (7) where n is the number of calculated CN of radius 0.01lm, and Nb is the number of measured background aerosol particles of radius more than 0.69lm. The coefficient K1 (24 · 10~10 cm3 s~1) accounts for self-coagulation of CN, and the coefficient K2 (78000· 10~10 cm3 s~1) accounts for coagulation of CN with large aerosol particles with radii exceeding 0.69lm (Twomey, 1977).
Using Eq. (7) and assuming K1 and K2 to be constant we have calculated the time necessary for CN to transform from tiny particles whose radius is 0.01lm to large aero-sols with radii exceeding 0.69lm through coagulation process. For 25 km altitude it takes about 1.5 days and decreases with altitude, so that at 16 km a time of several hours is needed. In comparison the time scale for adding an H2SO4 molecule to a CN is approximately 3 h (Arnold, 1982). Note these values are very variable depending on H2SO4 concentration and aerosol particle distribution.We have to consider that some additional physical processes can strongly influence the aerosol formation mechanism for example: additional H2SO4 sources, such as hydroxyl radicals (OH) that seem to appear during GLE events (Krieger and Arnold, 1994); decrease of
stratospheric temperatures during SPE events (Kodama
et al., 1992); sudden stratospheric warming and
sub-sequent sudden cooling that can increase level of H2SO4 supersaturation etc. According to the model suggested the observed R(H) enhancement was caused by sulfate aero-sol particles with radii r50.69lm. It is known that liquid sulfate aerosols of such sizes can exist in the stratosphere under temperatures which are lower than type-1 PSC creation temperatures (Dye et al., 1992; Larsen, 1994). On the other hand, one can not exclude the type-1 PSC creation because the temperatures are quite low enough for it to occur (see Fig. 4). In this case the sulfate aerosol particles may be condensation nuclei for type-1 PSCs (Tolbert, 1994). Some other physical mechanisms are also possible. For example, according to Tinsley et al. (1989) and Tinsley and Heelis (1993), ionization charges super-cooled droplets in the stratosphere causing droplet growth and nucleation process intensification.
Results of the work show that GLE events seem to be able to trigger aerosol creation at high latitudes. Some experimental facts confirm the probable connection between solar proton events and aerosol concentration increase (Hofman and Rosen, 1983; Pudovkin and Babushkina, 1992; Roldugin and Vashenyuk, 1994). In Shumilov et al. (1992; 1995) reported an ozone total con-tent decrease during a GLE event and Tinsley et al. (1993) have demonstrated the connection between the vorticity atmospheric index (VAI) and galactic cosmic ray vari-ations which also indirectly confirm the reality of such connections.
4 Conclusions
1. A considerable increase of aerosol concentration up to 50% at 20 km level after GLE event on 16 February 1984 was documented by lidar measurements at Ver-hnetulomski observatory.
2. The profile of CN calculated using ion nucleation mechanism is presented. By modelling the growth of CN through coagulation process it is shown that theoretical and experimental aerosol altitude profiles coincide at some altitude ranges.
3. The results show the very important additional conse-quence that the transparency of the atmosphere can be greatly decreased after GLE events.
Acknowledgements. The authors wish to thank E. Friis-Christiansen for supplying the meteorological data. The work was supported by the Russian Foundation of Fundamental Investigations under grant 93-05-12181, INTAS Association under grant 21247/93 and the Norwegian Research Council.
Topical Editor F. Vial thanks a referee for his help in evaluating this paper.
References
Arnold, F., Ion nucleation — a potential source for stratospheric aerosols, Nature, 299, 134—137, 1982.
Bajdalov, S. I., The employment of lasers in studying the upper atmosphere (in Russian), Ionos. Issled., 26, 5—19, 1978. 1122 O. I. Shumilov et al.: Enhancement of stratospheric aerosols after solar proton event
DeLuisi, J. J., B. G. Schuster, and R. K. Sato, Separation of dust and molecular scattering contributions to the lidar observation: a method, Appl. Opt., 14, 1917—1923, 1975.
Dye, J. E., D. Baumgardner, B. W. Gandrud, S. R. Kawa, K. K. Kelly, M. Loewenstein, G. V. Ferry, and B. L. Gary, Particle size distributions in Arctic polar stratospheric clouds, growth and freezing of sulfuric acid droplets, and implications for cloud formation, J. Geophys. Res., 97, 8015—8034, 1992.
Hargreaves, J. K., H. Ranta, A. Ranta, E. Turunen, and T. Turunen, Observations of the polar cap absorption event of February 1984 by the EISCAT incoherent scatter radar, Planet. Space Sci., 35, 947—958, 1987.
Hofman, D. J., and J. M. Rosen, Condensation nuclei events at 30 km and possible influences of solar cosmic rays, Nature, 302, 511—514, 1983.
Hofman, D. J., and S. Solomon, Ozone destruction through hetero-geneous chemistry following the eruption of E1 Chichon, J. Geophys. Res., 94, 5029—5041, 1989.
Hofman, D. J., J. M. Rosen, R. Reiter, and H. Jager, Lidar- and balloon-borne particle counter comparisons following recent volcanic eruptions, J. Geophys. Res., 88, 3777—3782, 1983. Jackman, C. H., J. E. Frederick, and R. S. Stolarski, Production of
odd nitrogen in the stratosphere and mesosphere: an intercom-parison of source strengths, J. Geophys. Res., 85, 7495—7505, 1980.
Kent, G. S., and R. W. H. Wright, A review of laser radar measure-ments of atmospheric properties, J. Atmos. ¹err. Phys., 32, 917—943, 1970.
Kodama, M., T. Kohno, and H. Kanzawa, Stratospheric sudden cooling after solar proton event over Syowa station, Antarctica, J. Geomagn. Geoelectr., 44, 361—366, 1992.
Krieger, A., and F. Arnold, First composition measurements of stratospheric negative ions and inferred gaseous sulfuric acid in the winter Arctic vortex: implications for aerosols and hydroxyl radical formation, Geophys. Res. ¸ett., 21, 1259—1262, 1994. Langner, J., H. Rodhe, P. J. Crutzen, and P. Zimmermenn,
Anthro-pogenic influence on the distribution of tropospheric sulphate aerosol, Nature, 359, 712—715, 1992.
Larsen, N., The impact of freezing of sulfate aerosols on the forma-tion of polar stratospheric clouds, Geophys. Res. ¸ett., 21, 425—428, 1994.
Nagatani, R. M., A. J. Miller, M. E. Gelman, and P. A. Newman, A comparison of Arctic lower stratospheric winter temperatures for 1988—89 with temperatures since 1964, Geophys. Res. ¸ett., 17, 333—336, 1990.
Pudovkin, M. I., and S. V. Babushkina, Influence of solar flares and disturbances of the interplanetary medium on the atmospheric circulation, J. Atmos. ¹err. Phys., 54, 841—846, 1992.
Roldugin, V. K., and E. V. Vashenyuk, Atmospheric transparency variations under the influence of the solar cosmic rays (in Rus-sian), Geomagn. Aeron., 34, 155—158, 1994.
Russel, P. B., T. J. Swissler, and M. P. McCormick, Methodology for error analysis and simulation of lidar aerosol measurements, Appl. Opt., 18, 3783—3797, 1979.
Shumilov, O. I., K. Henriksen, O. M. Raspopov, and E. A. Kasatkina, Arctic ozone abundance and solar proton events, Geophys. Res. ¸ett., 19, 1647—1650, 1992.
Shumilov, O. I., E. A. Kasatkina, K. Henriksen, and O. M. Raspopov, Ozone ‘‘miniholes’’ initiated by energetic solar protons, J. Atmos. ¹err. Phys., 57, 665—671, 1995.
Tinsley, B. A., and R. A. Heelis, Correlations of atmospheric dy-namics with solar activity evidence for a connection via the solar wind, atmospheric electricity, and cloud microphysics, J. Geo-phys. Res., 98, 10375—10384, 1993.
Tinsley, B. A., G. M. Brown, and P. H. Scherrer, Solar variability influences on weather and climate: possible connections through cosmic ray fluxes and storm intensification, J. Geophys. Res., 94, 14783—14792, 1989.
Tolbert, M. A., Sulfate aerosols and polar stratospheric cloud forma-tion, Science, 264, 527—528, 1994.
Tolbert, M. A., M. J. Rossi, and D. M. Golden, Heterogeneous interactions of chlorine, nitrate, hydrogen chloride, and nitric acid with sulphuric acid surfaces at stratospheric temperatures, Geophys. Res. ¸ett., 15, 847—850, 1988.
Twomey, S., Atmospheric aerosols, Elsevier Scientific, Amsterdam, 576 pp., 1977.