HAL Id: hal-02148446
https://hal.archives-ouvertes.fr/hal-02148446
Submitted on 5 Jun 2019
HAL is a multi-disciplinary open access
archive for the deposit and dissemination of
sci-entific research documents, whether they are
pub-lished or not. The documents may come from
teaching and research institutions in France or
abroad, or from public or private research centers.
L’archive ouverte pluridisciplinaire HAL, est
destinée au dépôt et à la diffusion de documents
scientifiques de niveau recherche, publiés ou non,
émanant des établissements d’enseignement et de
recherche français ou étrangers, des laboratoires
publics ou privés.
surveillance area, Burkina Faso
Toussaint Rouamba, Seydou Nakanabo-Diallo, Karim Derra, Eli Rouamba,
Adama Kazienga, Yasuko Inoue, Ernest Ouedraogo, Moussa Waongo, Sokhna
Dieng, Abdoulaye Guindo, et al.
To cite this version:
Toussaint Rouamba, Seydou Nakanabo-Diallo, Karim Derra, Eli Rouamba, Adama Kazienga, et
al.. Socioeconomic and environmental factors associated with malaria hotspots in the Nanoro
demo-graphic surveillance area, Burkina Faso. BMC Public Health, BioMed Central, 2019, 19 (1), pp.249.
�10.1186/s12889-019-6565-z�. �hal-02148446�
R E S E A R C H A R T I C L E
Open Access
Socioeconomic and environmental factors
associated with malaria hotspots in the
Nanoro demographic surveillance area,
Burkina Faso
Toussaint Rouamba
1,2,3*, Seydou Nakanabo-Diallo
1, Karim Derra
1, Eli Rouamba
1, Adama Kazienga
1,
Yasuko Inoue
2,4, Ernest K. Ouédraogo
5, Moussa Waongo
5, Sokhna Dieng
2,6, Abdoulaye Guindo
2,7,
Boukary Ouédraogo
2,8, Kankoé Lévi Sallah
2, Seydou Barro
9, Pascal Yaka
5, Fati Kirakoya-Samadoulougou
3,
Halidou Tinto
1and Jean Gaudart
10Abstract
Background: With limited resources and spatio-temporal heterogeneity of malaria in developing countries, it is still difficult to assess the real impact of socioeconomic and environmental factors in order to set up targeted campaigns against malaria at an accurate scale. Our goal was to detect malaria hotspots in rural area and assess the extent to which household socioeconomic status and meteorological recordings may explain the occurrence and evolution of these hotspots.
Methods: Data on malaria cases from 2010 to 2014 and on socioeconomic and meteorological factors were acquired from four health facilities within the Nanoro demographic surveillance area. Statistical cross correlation was used to quantify the temporal association between weekly malaria incidence and meteorological factors. Local spatial autocorrelation analysis was performed and restricted to each transmission period using Kulldorff’s elliptic spatial scan statistic. Univariate and multivariable analysis were used to assess the principal socioeconomic and
meteorological determinants of malaria hotspots using a Generalized Estimating Equation (GEE) approach. Results: Rainfall and temperature were positively and significantly associated with malaria incidence, with a lag time of 9 and 14 weeks, respectively. Spatial analysis showed a spatial autocorrelation of malaria incidence and significant hotspots which was relatively stable throughout the study period. Furthermore, low socioeconomic status households were strongly associated with malaria hotspots (aOR = 1.21, 95% confidence interval: 1.03–1.40). Conclusion: These fine-scale findings highlight a relatively stable spatio-temporal pattern of malaria risk and indicate that social and environmental factors play an important role in malaria incidence. Integrating data on these factors into existing malaria struggle tools would help in the development of sustainable bottleneck strategies adapted to the local context for malaria control.
Keywords: Malaria, Hotspots, Spatial epidemiology, Socioeconomic status, Meteorological factors, Spatio-temporal analysis, Bottleneck strategies, Lag time
* Correspondence:rouambatoussaint@gmail.com
1Clinical Research Unit of Nanoro, Institute for Research in Health Sciences,
National Center for Scientific and Technological Research, Nanoro, Burkina Faso
2Aix Marseille Univ, IRD, INSERM, UMR1252 Sciences Economiques & Sociales
de la Santé & Traitement de l’Information Médicale, Marseille, France Full list of author information is available at the end of the article
© The Author(s). 2019 Open Access This article is distributed under the terms of the Creative Commons Attribution 4.0 International License (http://creativecommons.org/licenses/by/4.0/), which permits unrestricted use, distribution, and reproduction in any medium, provided you give appropriate credit to the original author(s) and the source, provide a link to the Creative Commons license, and indicate if changes were made. The Creative Commons Public Domain Dedication waiver (http://creativecommons.org/publicdomain/zero/1.0/) applies to the data made available in this article, unless otherwise stated.
Background
Malaria’s epidemiology is influenced by climatic factors [1–3] which affect the ecology of the vector and conse-quently exposure of human populations to pathogens. At a global or micro-epidemiological scale, malaria transmis-sion is highly heterogeneous and modified by numerous factors, generating malaria hotspots that can maintain malaria transmission over a long time and across a wider area [4–7]. In 2015, according to the World Malaria Re-port, there were approximately 214 million cases of mal-aria and an estimated 438,000 deaths in malmal-aria endemic countries, including Burkina Faso [7], with children under 5 years being the most affected [8].
In Burkina Faso, malaria is endemo-epidemic, the transmission is seasonal with a peak of incidence during and just after the rainy season and depends also on
cli-matic and socioeconomic conditions [9]. Despite the
combined efforts from local government and its inter-national partners to mitigate the malaria burden, malaria annual incidence remains stubbornly high throughout the country areas. Additionally, the incidence of malaria increased from 309 cases per 1000 persons per year in 2011 to 514 cases per 1000 persons per year in 2016, however, the lethality due to malaria during the same period was considerably decreased (from 3.3% in 2011 to 0.9% in 2016 or 73% of reduction) [9, 10]. The current national policy is based on the Test-Treat-Track initia-tive (T3 initiainitia-tive), universal distribution of long-lasting insecticide-treated nets (LLINs), seasonal malaria che-moprevention (SMC) for children under 5 years old during the high transmission period and intermittent preventive treatment (IPT) of malaria during pregnancy [11, 12]. Beside these measures, government adopted a national policy which provided health care free-of-charge to children under 5 years and to pregnant women attending public health facilities [13]. With these com-ponents of current national policy, it is noticeable that in 2017 and according to the national health statistics, malaria remained the first cause of outpatient consulta-tions (43.5%), hospitalization (clinical observation) and (60.5%) mortality (35.9%) in health facilities; its annual incidence was estimated at 607 cases per 1000 persons per year with a lethality rate of 0.8% in the general popu-lation [14]. These statistics provide a partial estimate of the total malaria burden because home treatment or self-medication is a common practice in the Burkinabè context [15, 16], and are therefore not accounted for in the statistics presented above. To overcome the high rates of morbidity and mortality related to malaria, it is crucial to undertake research to refine approaches to ap-plying existing interventions most effectively and effi-ciently in local contexts, in a bottleneck approach such as malaria hotspot-targeted strategies and according to the season of transmission [3]. Albeit some studies have
reported that, within a micro-epidemiological scale in endemic areas, malaria disproportionately affects popu-lation living in similar conditions (nearest mosquito breeding site, wind direction and velocity, vegetation, house construction features, human genetic and behav-ioural factors) [17–21], the large growing studies carried out across African countries seemed to prove that mal-aria hotspot-targeted approaches are efficient and have more validity [22,23]. However, for now the conclusion of results varied, some research have reported that mal-aria hotspot targeted approaches are not effective and/or efficient, especially for reducing transmission outside of the hotspot [4,24].
Furthermore, albeit the effects of weather and environ-mental factors (social and natural) on malaria distribu-tions at the global, regional and local scale (including the village level) are well documented [19,25–30], con-troversial data regarding the role of meteorological and socioeconomic variables on generating or maintaining malaria hotspots observed at a fine scale remains a re-search topic to explore [17,31–33].
In Burkina Faso, only few studies have directly or indir-ectly addressed spatial or spatio-temporal variation of malaria [5, 6, 34]. Some of these studies suggested rela-tionships between malaria transmission and socioeco-nomic, environmental climatic variables [5, 6, 17, 18, 34,
35]. Nevertheless, until recently, the spatio-temporal dy-namic of transmission at a fine geographical scale has not been sufficiently explored, because of lack of data. The lit-erature investigating the role of socioeconomic and envir-onmental factors on the dynamic spatio-temporal of malaria at the household level is growing. In such context of high malaria burden associated with national and local resource constraints in a framework of seasonal malaria chemoprevention program, we proposed to address this gap by analysing longitudinal malaria data from rural hy-perendemic area in the Central-West region of Burkina Faso, Nanoro, taking into consideration socioeconomic and meteorological factors at household level.
The aim of this study was to define accurately the differ-ent transmission (or incidence) periods of malaria at a fine scale rural area and estimate the lag times between me-teorological variables and high malaria incidence period. Then, to detect potential malaria spatial hotspot for each period of transmission. The study further investigated if meteorological and socioeconomic were associated to malaria hotspots observed at a fine scale over time.
Methods
Study area, design and population
The study was carried out in Nanoro Demographic Sur-veillance Area (DSA), located in a rural in the Central West region of Burkina Faso. DSA was created in 2009 by the Clinical Research Unit of Nanoro (CRUN) and
covered two departments: Nanoro (15 villages) and Soaw (9 villages). The DSA lied between longitudes 1°892,537 and 2°83,146 West and latitudes 12°857,955 and 12°
872,863 North and covers an area of 594.3 km2. In
this area, seven peripheral health facilities and one referral hospital (Centre Médical avec Antenne
Chir-urgicale, CMA) provided health care to the
popula-tion. In the baseline of initial census (years 2009), 54,781 inhabitants were recorded. A unique identifi-cation number was assigned to each inhabitant of the DSA in order to track the different events
occur-ring in the population by regular home visits [36].
This study focused on Nanoro departments health facilities (Fig. 1) [36, 37].
Our study was an observational, longitudinal cohort study. We examined all malaria cases reported in the telegram weekly official letter (Telegramme Lettre
Offi-ciel Hebdomadaire,TLOH) for 260 weeks (January 2010
to December 2014) from four health facilities of the
Nanoro department (406.3 km2) covering 12 villages
(35,952 inhabitants in 2010). The TLOH has been devel-oped by the Burkina Faso National Epidemiological Surveillance department which provided weekly reports on 11 diseases (including malaria cases) notified in each health facility; the number of cases is then gathered and
controlled by health districts each week before being sent to the Ministry of Health. All age groups pa-tients attending health facilities within the DSA and for whom malaria diagnosis (according to national protocol) was confirmed by a parasitological exam (Rapid Diagnostic Test or Microscopy), were reported in the TLOH.
A subset from 1,028 households (Fig. 2) was further
investigated, in which all individuals were included for detailed investigations, mainly for the detection of mal-aria hotspots and to assess the effect of socioeconomic and meteorological factors.
Data acquisition procedures and data structure Malaria cases data
Data on malaria cases were obtained from two sources. The first was extracted from TLOH of health facilities of Nanoro health district (NHD) and the second from med-ical consultation registries of health focal points (HFP)
of CRUN. The CRUN’s HFP represented sentinel health
stations that were set up in the framework of health research activities and nested within each health facilities of NHD [38].
The TLOH database included all malaria cases of the study area reported by health facilities (including case
Fig. 1 Burkina Faso map showing Nanoro Health District and the Nanoro Demographic Surveillance Area (DSA). Source: Burkina Faso, Base Nationale de Découpage du territoire (BNDT, 2006); shapefile downloaded fromwww.maplibrary.org. Created by Eli Rouamba, 2018
reported by HFP of CRUN). We extracted cases from four peripheral health facilities (Urbain, Godo, Nazoanga and Séguedin). This database aggregated malaria cases by health facility and by week (in accordance with the epidemiological calendar of the National Disease Control Directorate, Ministry of Health (Direction de Lutte
con-tre la Maladie DLM). It was supplied by the Centre of
Health Information and Epidemiological Surveillance (Centre d’Information Sanitaire et de Surveillance Epidé-miologique, CISSE) of NHD.
Registries of HFP of CRUN: Each patient who was at-tending one of the HFP of CRUN was recorded in a registry by the medical team member who had examined him/her. Date of consultation, names, age and sex of the patient, village or neighbourhood he/she lived in, recent history of any treatment intake, weight, clinical signs,
diagnosis, prescribed treatment (dose and duration) were reported.
Socioeconomic, demographic and geo-location data
This database included information from 1,028 house-holds of individuals of HFP registries. All participants provided their consent to be part to a Health and Demo-graphic Surveillance System (HDSS). Socioeconomic, demographic and Geo-location data were extracted from DSA database of CRUN. A unique identification number hold by each permanent resident [36] allowed us to es-tablish the link between of individuals in the registries through a HDSS to their respective houses. Data on 26 variables of individual demography, household posses-sions and assets and materials for house construction were extracted. For this present study, analysis has been
conducted at household level, so the individual data have not been considered.
Data on household included number of inhabitants per household, water source, house types and shapes, main goods and properties (for further precisions see [36]).
Geo-location data for each household was provided by GPS (Global Positioning System coordinates). These geo-location data were collected as part of the HDSS [36].
Meteorological data
These data were collected by the National Meteoro-logical Directorate (Direction Générale de la
Metéorolo-gie, DGM), and aggregated weekly in accordance to the
epidemiological calendar.
The data from local rainfall station located in Nanoro was used. Since temperature and humidity data were not available at departmental level, data from the syn-optic station of Ouagadougou, located at about 85 km from the study area, were used, in accordance with the standards of the World Meteorological Organization (WMO). Thus, for evapotranspiration and temperature, WMO recommends a maximum distance of 150 km be-tween the measuring stations. For the rainfall network, WMO recommends a minimum of one station per 10,000 km2area [39]. The selected meteorological vari-ables were rainfall (cumulative rainfall and number of rain events per week); temperatures (average of mini-mum and maximini-mum per week, total average per week); relative humidity (minimum and maximum average per week, total average per week).
Geographical data
Nanoro department shape file (administrative boundary) with UTM zone 30 projection (Universal Transverse Mercator coordinate system zone 30) was downloaded from the following website: www.maplibrary.org.
Statistical analysis
Descriptive and exploratory analysis of time series
Malaria incidence per week was estimated providing time series. Mann-Kendall test [40, 41] was used to as-sess the trend of the time series. The periodicities of the time series were assessed by their autocorrelograms, fol-lowing the Box-Jenkins approach [42].
To take into account combinations of meteorological variables, but also to solve the collinearity and to reduce dimension, a principal component analysis (PCA) [43] was used, and the number of dimensions were selected according to the Kaiser rule.
To define transmission periods we performed, after a logarithmic transformation of the malaria incidence, a change point analysis [44], in order to detect significant changes in the mean and variance of the series for 260 weeks. For this purpose, the algorithm PELT (Pruned
Exact Linear Time) [45] was used and the Modified Bayes-ian Information Criterion [46] was chosen for penalty.
Building ARIMA seasonal model and cross-correlation of the malaria series with the series of meteorological variables
Box-Jenkins approach [42] was used to model independ-ently each time series. The best seasonal autoregressive integrated moving average (SARIMA) model was selected with the lowest Akaike Information Criterion (AIC). The remaining white noise was verified by using the Ljung-Box and Student test. With this approach, stationary time series were obtained, and used to explore relationships between time series.
Cross correlation function (CCF) was then used to as-sess the relationship between weekly meteorological vari-ables (principal components), and log-transformed weekly malaria incidence.
Spatio-temporal analysis for hotspots detection
In our study a hotspot was defined using Martin Kull-dorff’s Satscan approach [47] and was defined as statis-tical cluster or area of houses aggregation where malaria or incidence is higher than in the surrounding areas [4]. Spatial analysis for local hotspots detection was per-formed by using a purely elliptic spatial analysis (Poisson distribution), the detection was performed in each of the three combined period of malaria transmission (results of the change point analysis) in order to limit the impact of very high risk cluster on secondary cluster detection [48, 49]. The p-values were estimated by Monte Carlo inference.
Location of all household and statistically significant hotspots were mapped and roads, land, permanent water bodies were added using information from OpenStreet-Map, after geo-referencing ( https://www.openstreetma-p.org/#map=12/12.6228/-2.1622).
Multivariable analysis
Based on Kulldorff scan detection results, the outcome variable was categorized as“being in a significant hotspot” (1) and“not being in a significant hotspot” (0) throughout the different transmission periods. Socioeconomic profile of each household and the effect of this profile on malaria hotspot were established by proceeding as follow. Firstly, we performed Multiple Correspondence Analysis (MCA) including all socioeconomic and demographic variables. The resulted coordinates (from the MCA) were then used for a hierarchical ascendant classification [50]. The end result grouped all the households in three clusters or “so-cioeconomic profiles”. Secondly, we used generalized esti-mating equations (GEE) model to explore the effect of socioeconomic profiles and principal components (by considering lag times between meteorological variables variable and high malaria transmission period) on malaria
hotspot across time (malaria transmission periods). The accurate working correlation matrix was selected by assessing the correlation structure showing the low QIC (Quasi-AIC) score [51].
Ethics consideration
This analysis used household socioeconomic data from Nanoro HDSS that set up a population-based monitor-ing system in a framework of main study entitle ‘Phar-macovigilance for ACTs in Africa’ and was approved by Centre Muraz Institutional Ethical Committee (N° Réf. 03-2010C/E-CM), Burkina Faso National Ethics Com-mittee for Research in Health (N° 2010–27).
Software and packages
Statistical analyses were performed using the R software version 3.2.5 (R Development Core Team, R Foundation for Statistical Computing, Vienna, Austria), including the following packages: autoarima, Dcluster, FactoMineR, geepack, rgdal. Local hotspot assessment was performed by using the SatScan™ software version 9.4.2. Maps were provided by using the QGIS software (2014 QGIS Devel-opment Team).
Results
Description of time series and subset characteristics
Over the 5 years, 115,306 malaria cases were notified in the TLOH. The annual malaria incidence per 1000 in-habitants were 559, 581, 613, 646 and 623 respectively for year 2010, 2011, 2012, 2013 and 2014. For the subset, 19,091 subjects from 1,028 households were included in 2010, among them 788 malaria cases were reported. The flow of the study subject selection is shown on Fig.2.
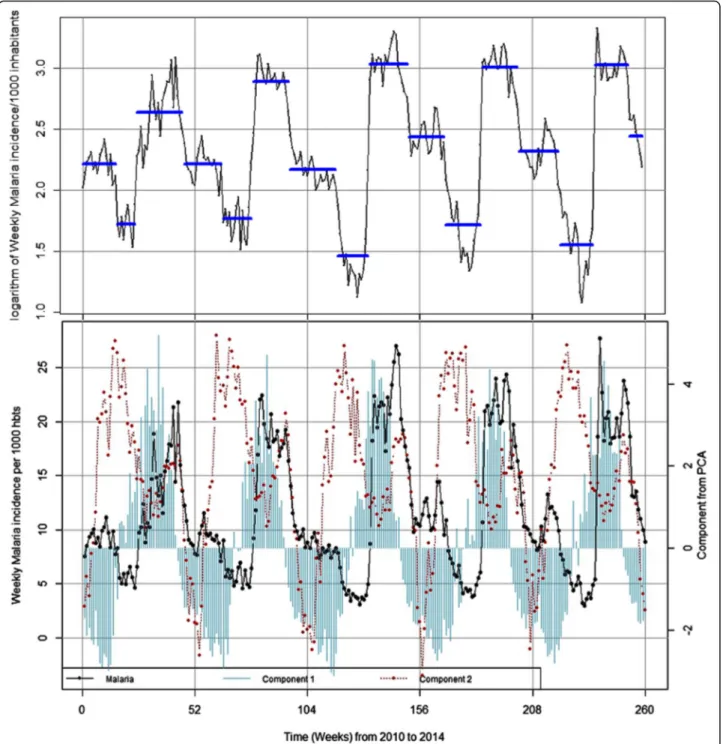
The Fig. 3 which illustrates the evolution of malaria incidence and meteorological variables time series, showed a maximum peak every 52 week, indicating the classical seasonal pattern of this endemo-epidemic area, but no trend was observed (see Additional file1).
The reduction of meteorological variables showed that the two first components explained 88.25% of the total inertia (see Additional file 2). The first component was mainly associated to rainfall (cumulative rainfall and number of rain events) and relative humidity (maximum, minimum and average). The second component was mainly associated to temperatures (maximum, minimum and average).
The cross-correlation analysis between malaria and the first component showed that rainfall and humidity were positively and significantly associated with malaria incidences with a time lag of 9 weeks. The lag time of 9 weeks indicates the time elapsing periods between the peak of rainfalls and the peak of malaria incidence (rise of malaria case). The second component showed that temperatures were positively and significantly associated
with malaria cases with a time lag of 14 weeks. The time lagged variables were used in the GEE regression for components 1 and 2 in order to assess the impact of these meteorological factors on spatial hotspot genesis.
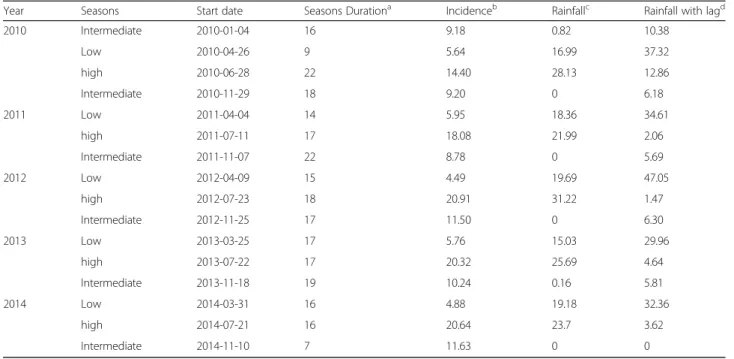
The change point analysis of the malaria time series identified 15 time-points or periods. These periods were uniformly distributed annually (three periods each year). The most important changes in the time series for mal-aria incidence for one period (i.e. 52 weeks) occurred be-tween July and mid-November where malaria incidences increased (about 3.53-fold) (Table1and Fig.3).
Spatio-temporal hotspot detection
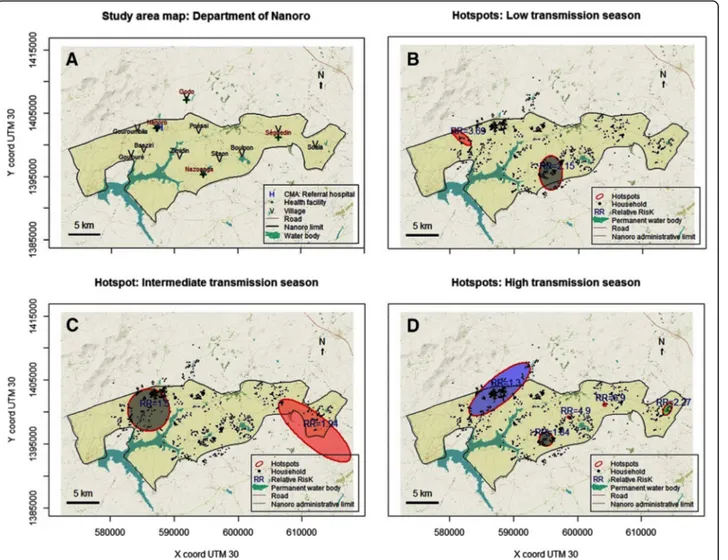
Kulldorff scan method for hotspots detection, according to the three transmission periods, showed a spatio-tem-poral heterogeneity. But, the location of the different hot-spots through the study area was relatively stable through the study period. Two significant hotspots were detected during the low and intermediate transmission periods, with relative risks (RR) of 2.15 and 3.69 (Low transmission period, respectively 82 and 13 households, p < 0.001), and of 1.50 and 1.94 (Intermediate transmission period, re-spectively 211 and 43 households, p = 0.001 and p = 0.028). Five significant hotspots were identified during the high transmission period. Principally, this area belonged to the villages of Gouroumbila, Nanoro, Basziri, Goulouré and Godo. The hotspot which showing the highest RR was in Séguedin village (RR = 6.90, 1 single household, p = 0.002). The largest hotspot counted 255 households, with the lowest RR of 1.30 (p = 0.011) and was located both in Nanoro and Godo Villages (Table 2, Fig. 4, and Additional file3).
Multivariable analysis
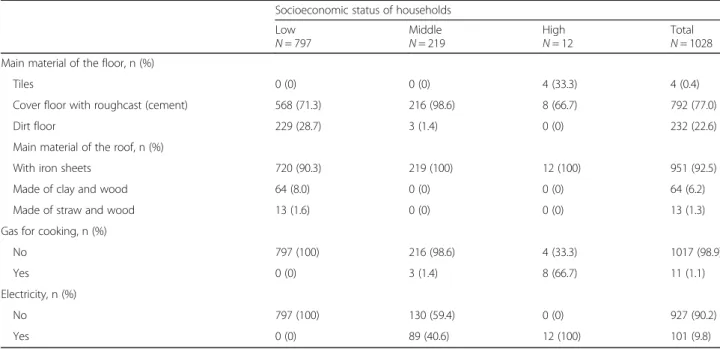
In this study area, we find three socioeconomic profiles among the 1,028 households. Thus, 797 (77.5%), 219 (21.3%) and 12 (1.2%) households were classified (from HCA) as low, middle and high socioeconomic status respectively (Table 3). The low socioeconomic class was characterized mainly by a shorter distance to health facil-ity (37.8%), less material goods ownership (excluding mo-bile phone, 89.7%, radio, 69.6%), less latrines (2.8%), piped water, no electricity and no gas, more houses made by clay bricks, dirty floors, and clay, wood, or straw made roofs.
Unadjusted univariate GEE analysis (Table 4) revealed significant associations between malaria hotspots and households classified as low socioeconomic status (OR = 1.23, 95% CI: 1.05–1.44 and the temperature component (OR = 0.65, 95% CI: 0.61–0.69). After adjusting on temperature and rainfall/humidity, households showing a low socioeconomic status presented the highest signifi-cant risk (aOR = 1.21, 95% CI: 1.03–1.40) associated to malaria hotspot compared to the households belonging to the medium and high status.
Discussion
This longitudinal observational study showed the annual seasonal pattern of malaria incidence, but with an inter-mediate transmission (or incidence) period between the two-classical low and high transmission. Moreover, weekly rainfall was positively associated with weekly malaria incidence, with a lag time of 9 weeks. Our find-ings supported a relative stability of the spatio-temporal
pattern. The relative stable hotspots were associated with meteorological factors but also with low socioeco-nomic status.
Contrary to literature that describes two malaria trans-mission periods (high and low) in Burkina Faso [17,37], our results have shown three clear transmission (or inci-dence) periods per year in Nanoro setting which corres-pond to high, intermediate and low period of malaria
Fig. 3 Transmission periods and seasonality of weekly malaria incidence and weekly meteorological variables from 2010 to 2014. Component 1 was associated to rainfall and relative humidity (cumulative rainfall and number of rain events and relative humidity); Component 2 was associated to temperatures (maximum, minimum and average)
incidence. Similar result was recently found by
Oue-draogo et al. (2018) in Ouagadougou. Our intermediate
period of malaria incidence (middle-November to March) is consistent with the rainfall transition period reported in the literature (November and February) [37]. During our“intermediate” period, recorded rainfalls were quasi null (Table 1), however, the presence of wetlands (temporary and permanent waterbodies) associated with optimum range of temperatures (28.41 °C [18°–38°]), rela-tive humidity (30.33% [12–47%]), and human activities (off-season agriculture is intensifying during this period)
created suitable conditions to maintain larval or mosquito abundance and thus contributed to maintain risk for mal-aria transmission in human populations.
Furthermore, considering the lag time (9 weeks) found in our study, rainfalls had a delayed influence on malaria cases whatever the transmission period (Table 1). These findings established the classical positive strong tem-poral association between meteorological factors (com-ponent 1: rainfall & relative humidity; and com(com-ponent 2: temperatures) and weekly malaria incidence in our area. In addition, these lag times coincided with the theoretical
Table 1 Description of malaria incidence and rainfall according to the transmission periods
Year Seasons Start date Seasons Durationa Incidenceb Rainfallc Rainfall with lagd
2010 Intermediate 2010-01-04 16 9.18 0.82 10.38 Low 2010-04-26 9 5.64 16.99 37.32 high 2010-06-28 22 14.40 28.13 12.86 Intermediate 2010-11-29 18 9.20 0 6.18 2011 Low 2011-04-04 14 5.95 18.36 34.61 high 2011-07-11 17 18.08 21.99 2.06 Intermediate 2011-11-07 22 8.78 0 5.69 2012 Low 2012-04-09 15 4.49 19.69 47.05 high 2012-07-23 18 20.91 31.22 1.47 Intermediate 2012-11-25 17 11.50 0 6.30 2013 Low 2013-03-25 17 5.76 15.03 29.96 high 2013-07-22 17 20.32 25.69 4.64 Intermediate 2013-11-18 19 10.24 0.16 5.81 2014 Low 2014-03-31 16 4.88 19.18 32.36 high 2014-07-21 16 20.64 23.7 3.62 Intermediate 2014-11-10 7 11.63 0 0 a
Seasons Duration in weeks b
Malaria incidence per 1000 person-weeks for the transmission season c
Accumulates Rainfall (mm) / week for the same transmission season d
Accumulates Rainfall (mm) / week with time lag (9 weeks)
Table 2 Malaria hotspots detected by the elliptic scan
Period Na Xb Yb Axis in km (major/minor) Number of households RRc P value
HighH 1 595,099 1,395,750 1.09/1.09 38 1.84 < 0.001 2 604,229 1,401,150 0.00/0.00 1 6.90 0.002 3 614,102 1,400,450 1.12/0.56 12 2.27 0.003 4 587,828 1,403,520 6.01/2.00 255 1.30 0.011 5 598,740 1,399,110 0.31/0.15 2 4.90 0.015 InterI 1 586,028 1,400,300 3.28/3.28 211 1.50 0.001 2 611,969 1,397,070 7.09/2.36 43 1.94 0.028 LowL 1 595,715 1,395,570 2.67/1.78 82 2.15 < 0.001 2 581,892 1,401,070 1.82/0.61 13 3.69 < 0.001
L Low transmission periods I intermediate transmission periods H high transmission periods a
Number of hotspots for each period b
Centroid coordinates of hotspots (UTM zone 30) c
vector-parasite-host cycle under optimum conditions [52– 55] and contributes to better understanding the classical hypothesis of biological/ecological drivers of the spatial-temporal distribution of malaria throughout a country. Indeed, surface water from first rainfalls may have been rapidly dried, by infiltration or evaporation. Therefore, the formation of a temporary waterbodies needed nu-merous rainfalls before becoming breeding sites. An-other delay may be due to the vector life cycle itself, from eggs to adults, and the number of cycles before reaching the sufficient population needed to accelerating the parasite transmission (also depending on meteoro-logical factors favouring mosquito survival). Finally, an-other delay may be observed until the first clinical cases were reported, defining the epidemic“official” onset.
In Ghana [56], neighbouring country of Burkina, in
Ethiopia (East Africa) and China [1, 57–59], rainfalls
and malaria were positively correlated with a lag time of 9 and 10 weeks respectively. Similarly, lag times between one and 3 months were reported in Mali (3 months), Kenya (one and 3 months) and China (1 month) [58, 60,61]. By contrast, malaria incidence rate was delayed by 2 weeks compared to meteorological fac-tors in Ouagadougou, located at about 85 km from Nanoro site. According to the authors of this latter study, the 5 dams located in this central region may contribute to the constant presence of vectors, which explains this short delay [6]. Taken together, this finding highlights the variability of spatio-temporal dynamic of malaria at micro-epidemiological scale in endemic areas. These lag times should be understood and considered by the Health Program Planners when implementing SMC campaigns in local context for delivering interven-tions at the right/relevant time.
Fig. 4 Map of Nanoro (a) with water bodies, villages and health facilities. Hotspots of cumulative weekly malaria incidence in Nanoro: High transmission period (b), Intermediate transmission period (c), Low transmission period (d). Source: Burkina Faso, Base Nationale de Découpage du territoire (BNDT, 2006); shapefile downloaded fromwww.maplibrary.org. The map background (raster) is captured fromhttps://
Table 3 Socioeconomic characteristics of households (1028) obtained by the hierarchical ascendant classification
Socioeconomic status of households Low N = 797 Middle N = 219 High N = 12 Total N = 1028 Distance to health facility, n (%)
< 5 km 540 (67.8) 127 (58.0) 5 (41.7) 672 (65.4) 5–10 km 251 (31.5) 87 (39.7) 7 (58.3) 345 (33.6) > 10 km 6 (0.8) 5 (2.3) 0 (0) 11 (1.1) Ownership of radio, n (%) No 242 (30.4) 38 (17.4) 4 (33.3) 284 (27.6) Yes 555 (69.6) 181 (82.6) 8 (66.7) 744 (72.4) Ownership of TV, n (%) No 788 (98.9) 159 (72.6) 0 (0) 947 (92.1) Yes 9 (1.1) 60 (27.4) 12 (100) 81 (7.9)
Ownership of mobile phone, n (%)
No 82 (10.3) 4 (1.8) 0 (0) 86 (8.4) Yes 715 (89.7) 215 (98.2) 12 (100) 942 (91.6) Ownership of fridge, n (%) No 797 (100) 206 (94.1) 0 (0) 1003 (97.6) Yes 0 (0) 13 (5.9) 12 (100) 25 (2.4) Ownership of car, n (%) No 796 (99.9) 199 (90.9) 8 (66.7) 1003 (97.6) Yes 1 (0.1) 20 (9.1) 4 (33.3) 25 (2.4) Ownership of motorcycle, n (%) No 322 (40.4) 47 (21.5) 0 (0) 369 (35.9) Yes 475 (59.6) 172 (78.5) 12 (100) 659 (64.1) Ownership of bicycle, n (%) No 14 (1.8) 10 (4.6) 1 (8.3) 25 (2.4) Yes 783 (98.2) 209 (95.4) 11 (91.7) 1003 (97.6) Toilet ownership, n (%) Latrine 3 (0.4) 66 (30.1) 11 (91.7) 80 (7.8) Latrines unenriched 19 (2.4) 151 (68.9) 1 (8.3) 171 (16.6) Absence 775 (97.2) 2 (0.9) 0 (0) 777 (75.6)
Major source of drinking water, n (%)
Tap (Piped water) 2 (0.3) 6 (2.7) 7 (58.3) 15 (1.5)
Well 131 (16.4) 1 (0.5) 0 (0) 132 (12.8)
Water drilling 660 (82.8) 212 (96.8) 1 (8.3) 873 (84.9)
Other 4 (0.5) 0 (0) 4 (33.3) 8 (0.8)
Main source of lighting, n (%)
Electricity 0 (0) 89 (40.6) 12 (100) 101 (9.8)
Other 797 (100) 130 (59.4) 0 (0) 927 (90.2)
Main material of walls (bedrooms), n (%)
Made of cement bricks 7 (0.9) 59 (26.9) 11 (91.7) 77 (7.5)
Semi-hard 81 (10.2) 12 (5.5) 1 (8.3) 94 (9.1)
However, studies carried out in Sri Lanka and Madhya Pradesh (Central India), did not detect a clear relationship between rainfall and malaria incidence probably because of dry areas [62] or flooded areas [63].
Our study area was characterised by a spatial aggrega-tion and spatio-temporal heterogeneity of malaria cases through all transmission periods. Similarly, in Burkina Faso, a study that use the Kulldorff’s approach with health facility as spatial scale, had found also a spatial variability and relative temporal stability of malaria inci-dence around the capital Ouagadougou [6].
The persistence of hotspots, especially in the village of Nanoro (down-town of the department) and its surround-ing, could be explained partly by several combined factors. First, by presence of several areas of off-season agriculture, better health services accessibility that could improve
malaria cases reporting, the construction of the new dam of Soum which created a swampy area, favourable condi-tions for the breeding sites. Second, by the high popula-tion density which was estimated at 104 persons per km2 [36]. However, it is important to note that this relationship may not be linear nor direct. Indeed, study carried-out in malaria endemic countries across Africa suggested that population densities of 100 persons per km2were more predictive of malaria infection in young children than very low densities (less than 10 persons per km2) or very high densities (more than 1000 persons per km2) [64]. Another study in Ethiopian highland suggests that, the spatial dis-tribution of malaria in the low season is well-explained by both temperature and population density [65].
Persistence of malaria hotspots during low transmission periods might constitute a stepping-stone control strat-egies, and stir transmission during high transmission pe-riods [22]. Therefore, these hotspots in low transmission seasons could be targeted for efficacious strategies, follow-ing a bottleneck approach to reduce malaria transmission at the local scale (see Additional file3) [4,66].
Our findings regarding the space-time dynamic of malaria, the three incidence periods of malaria and the lag time elapsing periods between the peak of rainfalls and the peak of malaria incidence might be considered for disrupting malaria transmission in the study area by adapting the malaria SMC program to local context and developing bottleneck strategies. Indeed, new strategies such as mass drug administration (MDA), mass screen-ing and treatment (MSAT) are under consideration [23].
This study also found that malaria hotspots were constituted by all types of households whatever their Table 3 Socioeconomic characteristics of households (1028) obtained by the hierarchical ascendant classification (Continued)
Socioeconomic status of households Low N = 797 Middle N = 219 High N = 12 Total N = 1028 Main material of the floor, n (%)
Tiles 0 (0) 0 (0) 4 (33.3) 4 (0.4)
Cover floor with roughcast (cement) 568 (71.3) 216 (98.6) 8 (66.7) 792 (77.0)
Dirt floor 229 (28.7) 3 (1.4) 0 (0) 232 (22.6)
Main material of the roof, n (%)
With iron sheets 720 (90.3) 219 (100) 12 (100) 951 (92.5)
Made of clay and wood 64 (8.0) 0 (0) 0 (0) 64 (6.2)
Made of straw and wood 13 (1.6) 0 (0) 0 (0) 13 (1.3)
Gas for cooking, n (%)
No 797 (100) 216 (98.6) 4 (33.3) 1017 (98.9)
Yes 0 (0) 3 (1.4) 8 (66.7) 11 (1.1)
Electricity, n (%)
No 797 (100) 130 (59.4) 0 (0) 927 (90.2)
Yes 0 (0) 89 (40.6) 12 (100) 101 (9.8)
Table 4 Factors associated with malaria hotspots
Univariate Multivariable
OR [95% CI] P value aOR [95% CI] P value Socioeconomic status Medium (Ref) 1 – 1 – Low 1.23 [1.05–1.44] 0.013b 1.21 [1.03–1.40] 0.021b High 0.90 [0.43–1.92] 0.79 0.93 [0.43–1.98] 0.84 Component 1 1.03 [1.00–1.06] 0.05a 1.01 [0.97–1.05] 0.68 Component 2 0.65 [0.61–0.69] < 0.001c 0.65 [0.61–0.69] < 0.001c
Component 1: resumed rainfalls considering its lag time with malaria Component 2: resumed temperatures considering its lag time with malaria aOR adjusted odds ratio
a
significant at the 0.1 level b
significant at the 0.05 level c
socioeconomic status, this emphasizes that vector breed-ing sites were common in this area and the behaviour of the majority population influenced the profile and inten-sity of malaria transmission. Nevertheless, within this setting, low socioeconomic status of households and me-teorological factors were positively correlated with
mal-aria hotspots. After adjusting for meteorological
components, the association of low socioeconomic sta-tus with malaria hotspots still remained. Poorer
socio-economic status of households was significantly
associated with some factors that lead to increase and sustain malaria transmission, from poor-quality housing (bedroom with clay brick walls, roof made of clay/straw and wood, dirt floor, absence electricity, and absent of toi-let, absence of tap) and absence of exposure to TV preven-tion campaigns. This positive associapreven-tion between malaria transmission and low socioeconomic status has been pre-viously described in Burkina Faso at national or sub-national level [5,17,18,34,67].
The association with the rainfall/humidity disappeared in the multivariable analysis. Possible explanations of this observation could be inter alia, (1) the location of the households near water points, (2) permanent water-bodies due to the construction of the new dam of Soum which created flooded areas.
One limitation of the study was the fact that the study included both malaria cases diagnosed actively and pas-sively. The passive detection of malaria cases might bias the findings by people who live closer to a health facility. However, this bias could be considered low because, in our context, about two-thirds of the study participant houses were located less than five kilometres. Moreover, active case detection, even in remote areas from health facilities, have also limited a potential bias due to health facility proximity. Additionally, as prevalence of home or self-treatment was presumably high, malaria incidence may be underestimate. A study carried out in 2011 noted that 72.7% of presumptive malaria admitted in a hospital of district practiced self-medication at home [68]. However, in our study area, strategies have been implemented to limit the practice of self-medication. In-deed, DSA’s field workers and community-based health workers, permanently sensitized population to avoid self-medication and attend a health facility if they expe-rienced abnormal symptoms.
Conclusion
Our study area was characterized by high incidence of malaria despite increasing efforts to fight the disease during the last decade. Findings showed a clear annual seasonal pattern of malaria incidence with three periods of different level of incidence and determined the lag times (9 weeks) between suitable meteorological factors and the peak of incidence of malaria. At a fine scale, and
according to the three periods of malaria incidence, our findings supports a relative spatio-temporal stability of malaria hotspots, which were characterized by low so-cioeconomic status. Understanding environmental and socio-economic factors associated to the spatio-temporal dynamic of malaria is of high importance to adapt current control strategies and to develop new strategies such as bottleneck strategies.
Additional files
Additional file 1:Autocorrelogram of weekly malaria incidence. (JPG 46 kb)
Additional file 2:First and second meteorological components derived from the Principal component analysis (PCA) of weekly meteorological variables. Rh max (Maximal relative humidity), Rh min (Minimal relative humidity), Rh ave. (Average relative humidity), Temp max (Maximal temperature), Temp min (Minimal temperature), Temp ave. (Average temperature), Rh max (Maximal relative humidity). (JPG 43 kb)
Additional file 3:Spatial hotspots according to the transmission periods (as described in Table1) year from 2010 to 01-04 to 2014-12-31. Source: Burkina Faso, Base Nationale de Découpage du territoire (BNDT, 2006); shapefile downloaded fromwww.maplibrary.org. The map background (raster) is captured fromhttps://www.openstreetmap.org/#map=12/ 12.6228/-2.1622. Maps created by Toussaint Rouamba, 2018. (PDF 931 kb)
Abbreviations
AIC:Akaike Information Criterion; aOR: Adjusted Odds Ratio; CCF: Cross Correlation Function; CI: Confidence Interval; CISSE: Centre d’Information Sanitaire et de la Surveillance Epidémiologique; DGM: Direction Générale de la Météorologie; DSA: Demographic Surveillance Area; GEE: Generalized Estimating Equation; GPS: Global Positioning System coordinate; HAC: Hierarchical Ascendant Classification; HFP: Health Focal Points; MCA: Multiple Correspondence Analysis; NHD: Nanoro Health District; OR: Odds Ratio; PCA: Principal Component Analysis; PELT: Pruned Exact Linear Time; QIC: Quasi Akaike Information Criterion; RR: Relative Risk; SARIMA: Seasonal Autoregressive Integrated Moving Average; TLOH: Télégramme Lettre Official Hebdomendaire; WMO: World Meteorological Organization
Acknowledgements
We would like to thank everyone who supported this study directly or indirectly through fieldwork, data collection or analysis support. The staff of health information and epidemiological surveillance centres of the Nanoro health districts. The meteorological service actors who collected and transmitted meteorological data.
We would like to thank professor Roch Giorgi and SESSTIM UMR1252 staff for their support.
The results have been partly presented (poster presentation) at the 10th European Congress on Tropical Medicine and International Health, 16-20 October 2017, Antwerp, Belgium [69].
Funding
This work (Data analysis and manuscript redaction) has been carried out thanks to the support of the A*MIDEX grant (n°ANR-11-IDEX-0001-02) funded by the French Government“Investissements d’Avenir program”). It was also supported by the French NGO Prospective& Cooperation.
The main study‘Pharmacovigilance for artemisinin-based combination treat-ments in Africa’ was supported WHO/TDR.
These institutions did not intervene in the study nor on the manuscript.
Availability of data and materials
The datasets used and/or analysed during the current study are available from the corresponding author on reasonable request.
Authors’ contributions
JG and TR designed the study protocol, performed statistical analysis and interpretation, drafted the manuscript; TR, SND, KD,AK, ER, SB, PY, MW, TH,
EKO performed the data collection; TR, AG, YI, BO, SD participated to the data cleaning and statistical analysis; HT, KLS, FKS revised the article. All authors read and approved the final manuscript.
Ethics approval and consent to participate
All the socioeconomics and GPS coordinates data of households were obtained from Nanoro HDSS. The Nanoro DSA was created initially in the framework of a study entitled‘Pharmacovigilance for artemisinin-based com-bination treatments in Africa’ (ClinicalTrials.govIdentifier: NCT01232530). This latter study was reviewed and approved by Centre Muraz Institutional Ethics Committee, the Burkina Faso National Ethics Committee and the World Health Organization (WHO) Ethical Review Committee. In this framework, a census of the population living in Nanoro department and around had been carried out after community consent was obtained.
The data presented in this work were extracted from the Nanoro HDSS data base, DGM data base, Nanoro health district TLHO, with the permission of the different Directors, Dr. Halidou Tinto, Dr. Ernest K. Ouédraogo and Dr. Seydou Barro. They have been made available for this study in an aggregated form so that the data request fulfils standards for transmission. Consent for publication
Not applicable. Competing interests
The authors declare that they have no competing interests.
Publisher’s Note
Springer Nature remains neutral with regard to jurisdictional claims in published maps and institutional affiliations.
Author details
1Clinical Research Unit of Nanoro, Institute for Research in Health Sciences,
National Center for Scientific and Technological Research, Nanoro, Burkina Faso.2Aix Marseille Univ, IRD, INSERM, UMR1252 Sciences Economiques &
Sociales de la Santé & Traitement de l’Information Médicale, Marseille, France.
3Center for Research in Epidemiology, Biostatistics and Clinical Research,
School of Public Health, Université libre de Bruxelles (ULB), Brussels, Belgium.
4Embassy of Japan in the Republic of Guinea, Conakry, Guinea.5Direction
Générale de la Météorologie du Burkina Faso, Ouagadougou, Burkina Faso.
6Ecole des Hautes Etudes en Santé Publique, Rennes, France.7MRTC, Malaria
and Training Research Center– Ogobara Doumbo, Bamako, Mali.8Direction Régionale de la Santé du Centre-Ouest, Ministère de la santé, Koudougou, Burkina Faso.9Directorate of Health Information Systems, Ministry of Health,
Ouagadougou, Burkina Faso.10Aix Marseille Univ, APHM, INSERM, IRD,
SESSTIM, Hop Timone, BioSTIC, Marseille, France.
Received: 27 March 2018 Accepted: 19 February 2019
References
1. Teklehaimanot HD, Lipsitch M, Teklehaimanot A, Schwartz J. Weather-based prediction of Plasmodium falciparum malaria in epidemic-prone regions of Ethiopia I. Patterns of lagged weather effects reflect biological mechanisms. Malar J. 2004;3:41.https://doi.org/10.1186/1475-2875-3-41.
2. Mouchet J, Faye O, Juivez J, Manguin S. Drought and malaria retreat in the Sahel, West Africa. Lancet. 1996;348:1735–6. https://doi.org/10.1016/S0140-6736(05)65860-6.
3. Health Organization World. Global Technical Strategy for Malaria 2016–2030. Geneva: Global Malaria Programme; 2015.http://apps.who.int/iris/bitstream/ handle/10665/176712/9789241564991_eng.pdf;jsessionid=
66E6DA665C88369AF0BA3A99E8525283?sequence=1. Accessed 4 Sept 2018 4. Bousema T, Stresman G, Baidjoe AY, Bradley J, Knight P, Stone W, et al. The
impact of hotspot-targeted interventions on malaria transmission in Rachuonyo South District in the Western Kenyan highlands: a cluster-randomized controlled trial. PLoS Med. 2016;13:e1001993.https://doi.org/10. 1371/journal.pmed.1001993.
5. Samadoulougou S, Maheu-Giroux M, Kirakoya-Samadoulougou F, De Keukeleire M, Castro MC, Robert A. Multilevel and geo-statistical modeling
of malaria risk in children of Burkina Faso. Parasit Vectors. 2014;7:350.
https://doi.org/10.1186/1756-3305-7-350.
6. Ouedraogo B, Inoue Y, Kambiré A, Sallah K, Dieng S, Tine R, et al. Spatio -temporal dynamic of malaria in Ouagadougou , Burkina Faso, 2011–2015. Malar J. 2018;17:1–12.https://doi.org/10.1186/s12936-018-2280-y. 7. World Health Organisation. World Malaria Report: Geneva: World Health
Organization; 2015. http://www.who.int/malaria/publications/world-malaria-report-2015/en/
8. Tiono AB, Kangoye DT, Rehman AM, Kargougou DG, Kaboré Y, Diarra A, et al. Malaria incidence in children in south-West Burkina Faso: comparison of active and passive case detection methods. PLoS One. 2014;9:e86936.
https://doi.org/10.1371/journal.pone.0086936.
9. Ministère de la Santé/Programme National de Lutte contre le Paludisme. Plan Stratégique National de Lutte Contre le Paludisme du Burkina Faso 2016–2020. Burkina Faso: Ministère de la Santé; 2016.
10. Ministère de la Santé/Direction Générale des Etudes et des Statistiques Sectorielles. Annuaire statistique 2016. Burkina Faso: Ministère de la Santé; 2017. http://www.sante.gov.bf/index.php?option=com_edocman&task= document.viewdoc&id=363&Itemid=1123. Accessed 8 Sept 2017. 11. Ministère de la Santé/Programme National de Lutte contre le Paludisme.
Directives Nationales pour la prise en charge du paludisme au Burkina Faso. Burkina Faso: Ministère de la Santé; 2017.
12. World Health Organization. T3: Test. Treat. Track initiative: WHO; 2016.http:// www.who.int/malaria/areas/test_treat_track/en/. Accessed 4 Sept 2018 13. SIG: Service d’Information du Gouvernement – Burkina Faso » COMPTE RENDU DU CONSEIL DES MINISTRES DU MERCREDI 02 MARS 2016.http:// www.sig.bf/2016/03/compte-rendu-du-conseil-des-ministres-du-mercredi-02-mars-2016/. Accessed 24 Nov 2018.
14. Ministère de la Santé/Direction Générale des Etudes et des Statistiques Sectorielles. Annuaire statistique 2017. Burkina Faso: Ministère de la Santé; 2018. http://cns.bf/IMG/pdf/annuaire_ms_2017.pdf. Accessed 12 Sept 2018. 15. Ouédraogo LT, Somé IT, Diarra M, Guissou IP. Self-medication in the
treatment of acute malaria: study based on users of private health drug stores in Ouagadougou, Burkina Faso. Bull Soc Pathol Exot. 2008;101:124–7
http://www.ncbi.nlm.nih.gov/pubmed/18543706. Accessed 8 Jul 2018. 16. Müller O, Traoré C, Becher H, Kouyaté B. Malaria morbidity, treatment-seeking behaviour, and mortality in a cohort of young children in rural Burkina Faso. Trop Med Int Health. 2003;8:290–6.https://doi.org/10.1046/j. 1365-3156.2003.01030.x.
17. Baragatti M, Fournet F, Henry M-C, Assi S, Ouedraogo H, Rogier C, et al. Social and environmental malaria risk factors in urban areas of Ouagadougou, Burkina Faso. Malar J. 2009;8:13.https://doi.org/10.1186/1475-2875-8-13. 18. Yamamoto S, Louis VR, Sié A, Sauerborn R. Household risk factors for
clinical malaria in a semi-urban area of Burkina Faso: a case-control study. Trans R Soc Trop Med Hyg. 2010;104:61–5.https://doi.org/10.1016/j.trstmh. 2009.07.003.
19. Kreuels B, Kobbe R, Adjei S, Kreuzberg C, von Reden C, Bäter K, et al. Spatial variation of malaria incidence in young children from a geographically homogeneous area with high endemicity. J Infect Dis. 2008;197:85–93.
https://doi.org/10.1086/524066.
20. Bejon P, Williams TN, Liljander A, Noor AM, Wambua J, Ogada E, et al. Stable and unstable malaria hotspots in longitudinal cohort studies in Kenya. PLoS Med. 2010;7:e1000304.https://doi.org/10.1371/journal.pmed.1000304. 21. Midega JT, Smith DL, Olotu A, Mwangangi JM, Nzovu JG, Wambua J, et al. Wind
direction and proximity to larval sites determines malaria risk in Kilifi District in Kenya. Nat Commun. 2012;3:674.https://doi.org/10.1038/ncomms1672. 22. Bousema T, Griffin JT, Sauerwein RW, Smith DL, Churcher TS, Takken W, et al.
Hitting hotspots: spatial targeting of malaria for control and elimination. PLoS Med. 2012;9:e1001165.https://doi.org/10.1371/journal.pmed.1001165. 23. Landier J, Parker DM, Thu AM, Lwin KM, Delmas G, Nosten FH, et al. Effect
of generalised access to early diagnosis and treatment and targeted mass drug administration on Plasmodium falciparum malaria in eastern Myanmar: an observational study of a regional elimination programme. Lancet. 2018; 391:1916–26.https://doi.org/10.1016/S0140-6736(18)30792-X.
24. Stresman GH, Mwesigwa J, Achan J, Giorgi E, Worwui A, Jawara M, et al. Do hotspots fuel malaria transmission : a village-scale spatio-temporal analysis of a 2-year cohort study in the Gambia. BMC Med. 2018;16:1–9.https://doi. org/10.1186/s12916-018-1141-4.
25. Gething PW, Patil AP, Smith DL, Guerra CA, Elyazar IR, Johnston GL, et al. A new world malaria map: Plasmodium falciparum endemicity in 2010. Malar J. 2011;10:378.https://doi.org/10.1186/1475-2875-10-378.
26. Kleinschmidt I, Omumbo J, Brit O, Van De Giesen N, Sogoba N, Mensah NK, et al. An empirical malaria distribution map for West Africa. Trop Med Int Heal. 2001;6:779–86.https://doi.org/10.1046/j.1365-3156.2001.00790.x. 27. Gaudart J, Poudiougou B, Dicko A, Ranque S, Toure O, Sagara I, et al.
Space-time clustering of childhood malaria at the household level: a dynamic cohort in a Mali village. BMC Public Health. 2006;6:286.https://doi.org/10. 1186/1471-2458-6-286.
28. Yeshiwondim AK, Gopal S, Hailemariam AT, Dengela DO, Patel HP. Spatial analysis of malaria incidence at the village level in areas with unstable transmission in Ethiopia. Int J Health Geogr. 2009;8:5.https://doi.org/10. 1186/1476-072X-8-5.
29. Wangdi K, Canavati SE, Ngo TD, Tran LK, Nguyen TM, Tran DT, et al. Analysis of clinical malaria disease patterns and trends in Vietnam 2009–2015. Malar J. 2018;17:332.https://doi.org/10.1186/s12936-018-2478-z.
30. Parker DM, Tripura R, Peto TJ, Maude RJ, Nguon C, Chalk J, et al. A multi-level spatial analysis of clinical malaria and subclinical Plasmodium infections in Pailin Province, Cambodia. Heliyon. 2017;3:e00447.https://doi. org/10.1016/j.heliyon.2017.e00447.
31. Yé Y, Kyobutungi C, Louis VR, Sauerborn R. Micro-epidemiology of Plasmodium falciparum malaria: is there any difference in transmission risk between neighbouring villages? Malar J. 2007;6:46.https://doi.org/10.1186/1475-2875-6-46. 32. Pierrat C. Risque palustre : appréhender la vulnérabilité des individus à
l’échelle locale (Sud du Bénin). VertigO - la Rev électronique en Sci l’environnement. 2012;11:1–22.https://doi.org/10.4000/vertigo.11549. 33. Patz JA, Strzepek K, Lele S, Hedden M, Greene S, Noden B, et al. Predicting
key malaria transmission factors, biting and entomological inoculation rates, using modelled soil moisture in Kenya. Trop Med Int Heal TM IH. 1998;3: 818–27.https://doi.org/10.1046/j.1365-3156.1998.00309.x.
34. Diboulo E, Sié A, Vounatsou P. Assessing the effects of malaria interventions on the geographical distribution of parasitaemia risk in Burkina Faso. Malar J. 2016;15:228.https://doi.org/10.1186/s12936-016-1282-x.
35. Yé Y, Hoshen M, Kyobutungi C, Louis VR, Sauerborn R. Local scale prediction of plasmodium falciparum malaria transmission in an endemic region using temperature and rainfall. Glob Health Action. 2009;2.https://doi.org/10. 3402/gha.v2i0.1923.
36. Derra K, Rouamba E, Kazienga A, Ouedraogo S, Tahita MC, Sorgho H, et al. Profile: Nanoro health and demographic surveillance system. Int J Epidemiol. 2012;41:1293–301.https://doi.org/10.1093/ije/dys159. 37. Institut National de la Statistique et de la Démographie. Enquête sur les
Indicateurs du Paludisme au Burkina Faso (EIPBF). Ouagadougou: INSD; 2014.https://dhsprogram.com/pubs/pdf/MIS19/MIS19.pdf
38. Tinto H, Valea I, Sorgho H, Tahita M, Traore M, Bihoun B, et al. The impact of clinical research activities on communities in rural Africa: the development of the clinical research unit of Nanoro (CRUN) in Burkina Faso. Malar J. 2014; 13:113.https://doi.org/10.1186/1475-2875-13-113.
39. Diello P, Paturel JE, Mahe G. Approche d’identification d’un réseau climatique pour le suivi du climat au Burkina Faso. Sud Sci Technol. 2003;10: 18–25.http://hdl.handle.net/2042/30343.
40. Bayazit M, Önöz B. To prewhiten or not to prewhiten in trend analysis? Hydrol Sci J. 2007;52:611–24.https://doi.org/10.1623/hysj.52.4.611. 41. Onoz Bayazit MB. The power of statistical test for trend detection. Turkish J
Eng Environ Sci. 2003;27:247–51http://journals.tubitak.gov.tr/engineering/ issues/muh-03-27-4/muh-27-4-5-0206-6.pdf.
42. Box GEP, Jenkins GM. Time Series Analysis: Forecasting and Control. In: Holden-Day. San Francisco: Holden-Day; 1976. p. 575.
43. Jolliffe I. Principal component analysis. 2nd ed. New York: Springer-Verlag; 2002.https://trove.nla.gov.au/version/180765988
44. Killick R, Eckley IA. changepoint: An R Package for Changepoint Analysis. J Stat Softw. 2014;58:1–19.https://doi.org/10.18637/jss.v058.i03.
45. Killick R, Fearnhead P, Eckley IA. Optimal detection of changepoints with a linear computational cost. J Am Stat Assoc. 2012;107:1590–8.https://doi.org/ 10.1080/01621459.2012.737745.
46. Zhang NR, Siegmund DO. A modified Bayes information criterion with applications to the analysis of comparative genomic hybridization data. Biometrics. 2007;63:22–32.https://doi.org/10.1111/j.1541-0420.2006.00662.x. 47. Kulldorff M. A spatial scan statistic. Commun Stat Theory Methods. 1997;
26:1481–96https://www.satscan.org/papers/k-cstm1997.pdf. Accessed 15 Sept 2018.
48. Guttmann A, Ouchchane L, Li X, Perthus I, Gaudart J, Demongeot J, et al. Performance map of a cluster detection test using extended power. Int J Health Geogr. 2013;12:47.https://doi.org/10.1186/1476-072X-12-47.
49. Guttmann A, Li X, Feschet F, Gaudart J, Demongeot J, Boire J-Y, et al. Cluster detection tests in spatial epidemiology: a global Indicator for performance assessment. PLoS One. 2015;10:e0130594.https://doi.org/10. 1371/journal.pone.0130594.
50. Ludovic L, Alain M, Marie P. Statistique exploratoire multidimensionnelle. Paris: Dunod; 1995.
51. Pan W. Akaike’s information criterion in generalized estimating equations. Biometrics. 2001;57:120–5.https://doi.org/10.1111/j.0006-341X.2001.00120.x. 52. Lucius R, Loos-Frank B. Biologie von Parasiten. 2nd ed. Berlin, Heidelberg:
Springer Verlag; 2008.
53. Martens W, Niessen L, Rotmans J, Jetten TH, McMichael J. Climate change and vector-borne disease: a global modelling perspective. Glob Env Chang. 1995;5:195–209.https://doi.org/10.1016/0959-3780(95)00051-O.
54. Centers for Disease Control and Prevention. Malaria About Malaria -Biology. 2018.https://www.cdc.gov/malaria/about/biology/index.html. Accessed 6 Sept 2018.
55. Hurtado LA, Calzada JE, Rigg CA, Castillo M, Chaves LF. Climatic fluctuations and malaria transmission dynamics, prior to elimination, in Guna Yala, República de Panamá. Malar J. 2018;17:85.https://doi.org/10.1186/s12936-018-2235-3. 56. Krefis AC, Schwarz NG, Krüger A, Fobil J, Nkrumah B, Acquah S, et al.
Modeling the relationship between precipitation and malaria incidence in children from a holoendemic area in Ghana. Am J Trop Med Hyg. 2011;84: 285–91.https://doi.org/10.4269/ajtmh.2011.10-0381.
57. Midekisa A, Senay G, Henebry GM, Semuniguse P, Wimberly MC. Remote sensing-based time series models for malaria early warning in the highlands of Ethiopia. Malar J. 2012;11:165.https://doi.org/10.1186/1475-2875-11-165. 58. Bi P, Tong S, Donald K, Parton KA, Ni J. Climatic variables and transmission of malaria: a 12-year data analysis in Shuchen County, China. Public Health Rep. 2003;118:65–71.https://doi.org/10.1016/S0033-3549(04)50218-2. 59. Wu Y, Qiao Z, Wang N, Yu H, Feng Z, Li X, et al. Describing interaction effect
between lagged rainfalls on malaria: an epidemiological study in south-West China. Malar J. 2017;16:53.https://doi.org/10.1186/s12936-017-1706-2. 60. Coulibaly D, Travassos MA, Tolo Y, Laurens MB, Kone AK, Traore K, et al.
Spatio-temporal dynamics of asymptomatic malaria: bridging the gap between annual malaria resurgences in a Sahelian environment. Am J Trop Med Hyg. 2017;97:1761–9.https://doi.org/10.4269/ajtmh.17-0074. 61. Pascual M, Cazelles B, Bouma MJ, Chaves LF, Koelle K. Shifting patterns:
malaria dynamics and rainfall variability in an African highland. Proc Biol Sci. 2008;275:123–32.https://doi.org/10.1098/rspb.2007.1068.
62. Van Der Hoek W, Konradsen F, Perera D, Amerasinghe PH, Amerasinghe FP. Correlation between rainfall and malaria in the dry zone of Sri Lanka. Ann Trop Med Parasitol. 1997;91:945–9.https://doi.org/10.1080/00034989760347. 63. Singh N, Sharma VP. Patterns of rainfall and malaria in Madhya Pradesh,
Central India. Ann Trop Med Parasitol. 2002;96:349–59.https://doi.org/10. 1179/000349802125001113.
64. Kabaria CW, Gilbert M, Noor AM, Snow RW, Linard C. The impact of urbanization and population density on childhood Plasmodium falciparum parasite prevalence rates in Africa. Malar J. 2017;16:49.https://doi.org/10. 1186/s12936-017-1694-2.
65. Siraj AS, Bouma MJ, Santos-Vega M, Yeshiwondim AK, Rothman DS, Yadeta D, et al. Temperature and population density determine reservoir regions of seasonal persistence in highland malaria. Proc Biol Sci. 2015;282:20151383.
https://doi.org/10.1098/rspb.2015.1383.
66. Bejon P, Williams TN, Nyundo C, Hay SI, Benz D, Gething PW, et al. A micro-epidemiological analysis of febrile malaria in coastal Kenya showing hotspots within hotspots. Elife. 2014;3:e02130.https://doi.org/10.7554/eLife.02130. 67. Wang S-J, Lengeler C, Smith TA, Vounatsou P, Diadie DA, Pritroipa X, et al.
Rapid urban malaria appraisal (RUMA) I: epidemiology of urban malaria in Ouagadougou. Malar J. 2005;16:1–16.https://doi.org/10.1186/1475-2875-4-43. 68. Yaméogo TM, Kyelem CG, Bamba S, Savadogo LB, Sombié I, Traoré AZ, et al.
Chemin de soin des cas présomptifs de paludisme admis dans un hôpital de district au Burkina Faso. Med Sante Trop. 2014;24:301–6.https://doi.org/ 10.1684/mst.2014.0368.
69. Rouamba T, Nakanabo-Diallo S, Derra K, Rouamba E, Kankoe S, Yaka P, et al. Environmental characteristics and evolution of malaria hotspots in a rural area, Burkina Faso. In: 10th European Congress on Tropical Medicine and International Health. Antwerp: Tropical Medicine and International Health; 2017. p. 224.https://onlinelibrary.wiley.com/doi/abs/10.1111/tmi.12979. Accessed 31 Aug 2018.