HAL Id: cea-01830910
https://hal-cea.archives-ouvertes.fr/cea-01830910
Submitted on 3 Jan 2019
HAL is a multi-disciplinary open access
archive for the deposit and dissemination of
sci-entific research documents, whether they are
pub-lished or not. The documents may come from
teaching and research institutions in France or
abroad, or from public or private research centers.
L’archive ouverte pluridisciplinaire HAL, est
destinée au dépôt et à la diffusion de documents
scientifiques de niveau recherche, publiés ou non,
émanant des établissements d’enseignement et de
recherche français ou étrangers, des laboratoires
publics ou privés.
Moving Sources Detection Algorithm for Radiation
Portal Monitors Used in a Linear Network
Romain Coulon, Vladimir Kondrasovs, Karim Boudergui, Stéphane Normand
To cite this version:
Romain Coulon, Vladimir Kondrasovs, Karim Boudergui, Stéphane Normand. Moving Sources
De-tection Algorithm for Radiation Portal Monitors Used in a Linear Network. IEEE Transactions
on Nuclear Science, Institute of Electrical and Electronics Engineers, 2014, 61 (4), pp.2189 - 2194.
�10.1109/TNS.2014.2299872�. �cea-01830910�
Moving Sources Detection Algorithm for Radiation
Portal Monitors Used in a Linear Network
Romain Coulon, Vladimir Kondrasovs, Karim Boudergui, and Stéphane Normand
Abstract—To monitor radioactivity passing through a vehicle
such as a pedestrian, a car, a train or a truck, Radiation Portal Monitors (RMP) are commonly employed. These detection sys-tems consist of a large volume detector set close to the potential source path. An alarm is then triggered when the signal rises over a threshold initially estimated in view of the natural background signal. The approach developed in this work makes use of several detectors in a network along the source path. The correlation detection approach is elaborated to take into account the tem-poral periodicity of the signals taken by all distributed sensors as a whole. This new detection method is then not based only on counting statistics but also on the temporal series analysis. There-fore, a specific algorithm has been developed in our laboratory for this security application and shows a significant improvement, especially in terms of detection probability increase and false alarm reduction. This paper presents the theoretical approach and promising results obtained by simulation.
Index Terms—Algorithm, detection, filter, instrument,
measure-ment, monitor, moving, nuclear, radiation, radioactive, safeguard, security, signal processing, source, time series analysis.
I. INTRODUCTION
M
ONITORING a moving source is currently required fornumerous nuclear security applications. Nuclear mate-rials could be contained into a pedestrian, a car, a truck, or a train and could also be disseminated into a water pipe or an air vent. The detection is challenging due to the source motion when passing by the probe.A. State of the Art
To optimize the detection eff ciency, a large volume sensor is required. Such systems are proposed by a large number of industrial suppliers [1], [2]. Advanced RPMs, additionally, are currently developed in research laboratories, exploiting the in-formation contained into the deposited energy distribution given by the large plastic scintillator [3]–[5]. Time series analysis of the counting signal is also studied to improve the detection of a single RMP [6], [7]. The work developed in this paper deals with time series analysis applied to RPMs in linear network.
The authors are with the CEA, LIST, Laboratoire Capteurs et Architectures Électroniques and Laboratoire, F-91191 Gif-sur-Yvette, France (e-mail: [email protected]; [email protected]; [email protected]; [email protected]).
B. Conventional Approach
Conventional RPMs are implemented with a single channel and gross count rate continuous measurements. Detection is commonly done from a given channel by a threshold. The threshold is calculated according to the background f uctuation band on the backed level estimated with a Poisson counting as-sumption and an acceptable false alarm probability FAP. Counts from background are considered as a Poisson process. Its expectation and its variance are a function of background eff ciency , background intensity around the detector and elementary counting time as described in Eq. (1).
(1) An decision threshold DT is determined by the statistical stan-dard deviation and a coverage factor (set in regards of the maximum acceptable FAP).
(2) Counts from signal are similarly considered as a Poisson process. Its expectation and its variance are the functions of the source eff ciency , the source activity and elementary counting measurement time as described in Eq. (3).
(3) The detection test consists in trigging the alarm if the con-dition becomes true. The ratio is therefore proportional to the source eff ciency and activity, proportional to the square root of the elementary counting time and inversely proportional to the square root of the background eff ciency and intensity as shown in the Eq. (4).
(4) The background eff ciency increases proportionally to de-tector volume. The source eff ciency converges to an asymptotic value as the detector volume increases. An optimum in terms of signal to noise ratio is calculated (by MC particles transport code for example) as a function of the experimental conditions (nature of the source, background, vehicle…). Consequently, optimizing the design of the sensor comes f rst in the issue to be addressed.
The counting time has to be short compared to the speed of the source. In practice, it can only by optimized by making the
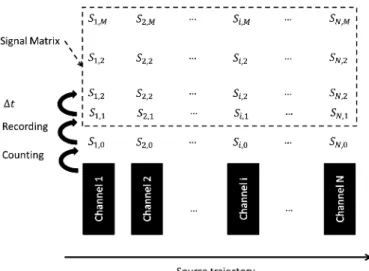
Fig. 1. Principle of the signal recording.
considered vehicle stop in front of the system. Such a method could disturb the traff c f ux; it is therefore undesirable.
C. Concept of the Correlation Approach
Another way of improvement is proposed in this work: it relies upon several portal units set along the source path. As a result, the detection probability is increased and the network structure could provide us with additional type of information about the signalthankstothetemporalcorrelationbetweensensors.Instead of triggingonthe independentsignalamplitude,a periodicityinto the overall signal is searched for. An improvement in detection ability is suggested. Moreover, this new approach could be more reliableasfarastheself-shieldingissuesareconcerned.
Past studies have been carried out for the source tracking using matrix sensor networks. MCNC calculations and Bayesian approach allowing sources tracking without any knowledge of the source trajectory have been developed [8]. An algorithm based on triangulation has been studied for source localization purposes [9]. These methods are optimized for 2-D problems and are therefore unsuited for our situation where the source trajectory is well known (1-D). Faster algorithms have then been developed but these require an accurate knowledge of the source velocity which is not usually the case for security problematic [10], [11]. Fusion of correlated decisions is another path to address this issue. Local decision from multiples sen-sors are sending to a fusion center and correlation test is done (CUMSUM test or test based on copula theory) [12], [13].
The next parts of this paper present a detection method based on temporal series analysis associated with linear sensor net-work without taking in account the local decision information. It allows a continuous and fast detection without accurate knowl-edge of the source velocity. The method is described and a com-parative study with conventional detection method is presented.
II. METHODS
The radioactive source is passed in front of the N successive channels. Counts are recorded to a memory corresponding to every channel (see Fig. 1).
The detection f lter and measurement are processed with the following steps.
Fig. 2. Formulation of the signal matrix.
A. Memory Management
At the end of the counting time , a “First In First Out” (FIFO) list is recorded at every channel. After, the last counting is recorded into the f rst values of the memories. Counting values are noted where is the channel number and the time step at the memory level (see Fig. 2).
B. Correlation Vector Calculation
A temporal correlation vector is calculated as a function of delay times between sensors. The explicit formula is presented in Eq. (5).
(5)
With and .
C. Determination of the Decision Threshold
A decision threshold is calculated using the mean of the static product (Eq. (6)) and its associated empirical standard devi-ation (Eq. (7)).
(6)
(7) The threshold estimation could be impacted by the source signal itself. To avoid this phenomenon the median could be used instead of the mean for the static product estimation. An-other empirical standard deviation is recalculated after rejection of extreme values has been performed.
D. Detection Test
A detection test consists in determining if a correlation be-tween the channels is considered relevant. The maximum of cor-relation is searched into the vector and a test is performed by comparison of this value to the static product and its standard de-viation. The parameter is the coverage factor set in regards of the acceptable FAP. This parameter can be considered as the threshold set proportionally the f uctuation level of the correla-tion product.
(8) The system is able to detect all source motions as long as the speed can be considered constant and comprise into the delay
Fig. 3. Geometrical model.
time scan range. The system is also able to assure a reliable de-tection behavior during the evolution of the background signal. This approach is therefore immune to self-shielding effect.
E. Speed Estimation
If detection has occurred, the time period corresponding to the maximum of vector could give, using the distance between sensors , an approximation of the source speed . The accuracy in this speed estimation is linked to the time sampling
of the detection system.
(9) (10)
F. Signal Simulation
The signal is simulated by the superimposition of a constant background intensity and a source intensity (equal to the count rate in front of a detector). A geometrical model allows for the simulation of the global intensity of a channel as a function of time (see Fig. 3).
The intensity is derived as a function of the distance between probes , the distance to the source track line and the source velocity (see Eq. (11)–(12)).
(11) (12) The inhomogeneous Poisson process is generated for each channel as illustrated in Fig. 4. Pulse trains are generated using the pseudo-random function rand of Matlab into the exponen-tial probability function modeling the pulse-time separation as a function of the signal intensity .
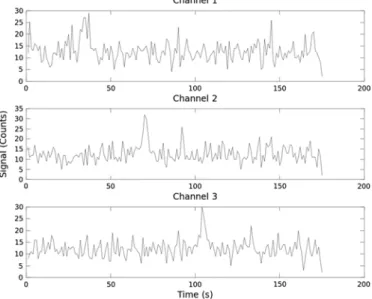
The counts are integrated during an elementary counting time to obtain three independent count signals as presented in Fig. 5. The signal is then characterized by the background intensity , the source intensity , the source velocity , the distance between the source and the detector line path , and the corre-sponding number of samples separating detector to each other’s
, as.
(13) III. RESULTS
A. Detection Filter Testing
The correlation production is then calculated for several delay times as described in Eq. (5) and shown in the Fig. 6.
Fig. 4. Example of pulses arrivals from 3 sensors while a source is passing.
Fig. 5. Simulated counts signal from 3 sensors while a source is passing.
The detection threshold (dash line) is calculated in regards to the signal correlation product f uctuations (see Eq. (6)–(8)). In comparison to Fig. 5 (same displayed signals) obvious improve-ments in the signal to noise ratio are noticed when using the cor-relation product estimator.
To evaluate the performance of this scheme, the following detection algorithm conf gurations are simulated:
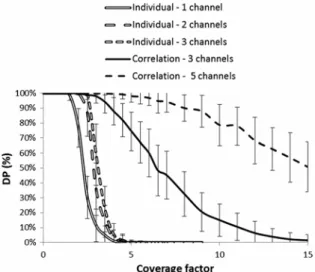
• The f rst one is the conventional method described in Eq. (1)–(3) for a sensor network from 1 to 5 units. Detection occurs if at least one of the signals falls above the threshold. • The second one is the time correlation algorithm as de-scribed in Eq. (5)–(8) with a sensor network of 1 to 5 units.
B. First Results
To evaluate FAP during the potential passage of the source, constant signals are injected ten thousand times during an in-terval of (corresponding to the velocity of the potential source used for DP calculation). This sequence is then generated times with an elementary sampling time of 0.1 second.
Fig. 6. Correlation production as a function of the delay time during the pass of a radioactive source.
Fig. 7. FAP as a function of coverage factor for the individual detection f lter (double line) and the correlation detection f lter (single line).
The FAP is estimated by the number of detection occurring divided to the number of generated sequences (Eq. (14)). The associated statistical error is shown in Eq. (15).
(14) (15) The FAP evolution as a function of coverage factor is shown in Fig. 7 for the two detection f lters.
The FAP distribution is completely different between the in-dividual and the correlation detection methods. Signal from the source ( cps, cps, m.s m) is then injected ten thousand times to estimate the detection prob-ability DP (see Eq. (16), (17)).
(16) (17) Fig. 8 shows the DP as a function of the coverage factor for both detection f lters.
The DP distribution for the correlation f lter is smoother than the statistical one. The detection probability from source SDP is def ned as the difference between the DP and the FAP, which
Fig. 8. DP as a function of coverage factor for the individual detection f lter (double line) and the correlation detection f lter (single line).
Fig. 9. SDP as a function of coverage factor for a signal of 12 cps and a baseline background of 20 cps.
is a satisfactory indicator performance (see Eq. (18), (19)).
(18) (19) The SDP evolution as a function of the coverage factor is presented in Fig. 9.
It can be seen that the optimal coverage factor is different be-tween the two detection methods and in regards to the number of used channels. In this example, the correlation method clearly shows a signif cant detection probability improvement in com-parison with the individual statistical threshold method.
C. Impact of Parameters
When an increase of the radioactive source speed occurs, the SDP decreases in the same manner for both detection f lter methods (see Fig. 10).
The distance between detectors does not impact the indi-vidual detection but could impact the correlation detection. One
Fig. 10. SDP as a function of the source speed for a signal of 12 cps, a baseline background of 20 cps, distance between detector of 3 m, a coverage factor of 3 for the individual detection, and a coverage factor of 7 for the correlation detection.
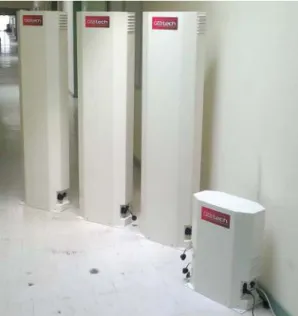
Fig. 11. RPMs network prototype showing three long detection units and a small control unit.
must therefore ensure that this distance is long enough within the speed range at hand.
D. Realization
A prototype system of the RPMs network is under develop-ment in our laboratory in the context of the SECUR-ED Euro-pean project for urban mass transportation [14].
Each sensor unit is composed of two plastic scintillation de-tectors coupled to fast linear focused 12 stages PMT. Scintilla-tors are EJ-200 produced by Eljen Technology with the dimen-sions mm. Data acquisition electronics (DAQ) have been developed by CEA and an embedded video camera to record movies of the suspect object has also been implemented [15], [16].
The DAQ is made of a compact set including a DC module providing power supply to the other modules (5 W), a Field Programmable Gate Array (FPGA) board and a High Voltage board for the 2 PMTs.
The FPGA card aims at digitalizing the signal directly from the detector anode signal. Four shifted ADC with
Msample.s are used to reach the 800 MHz sampling frequency.
The software used in this system is based on a client/server model. The server software aims at managing and collecting data from sensor units, saving them into a f le and sending them to the connected client.
The client can be a portable computer (PC) based near the control unit or deported to a control room. A standard network is used to establish the connection and to communicate.
The server can collect all data every 100 ms from every sensor unit, perform the signal processing and send automatically an alarm in case of the radioactive source detection.
IV. DISCUSSION
The correlation of network portal monitor signals forms a promising approach for moving source detection applications. The distance between probes has to be carefully set by the user into the network. Adding a smoothering stage is a path for improvement. Future work will therefore approach by coupling time analysis detection with an upstream adaptive smoother [17].
Because they do not scan the same type of information, the conventional and the correlation methods are not antagonistic but complement each other. We shall therefore conduct a study about the combination of both approaches.
Another way of improvement lies within the analysis of the evolution in the temporal prof le of the measurement period. The exploitation of this time delay evolution prof le is the next step in detection enhancement allowed by correlation approach.
V. CONCLUSION
The detection of moving radioactive sources constitutes a challenge for nuclear security applications. Processing of the signal given by a RPM network has been studied. An algorithm allowing detection based on the time correlation between chan-nels has been developed. A signif cant detection probability im-provement has been shown by simulation study of RPM signals. This preliminary result proves that time correlation approach is an innovative solution for moving source detection. Further improvements are envisaged on the basis of this algorithm, no-tably by coupling with an upstream adaptive smoother, coupling with the conventional individual f lter, and time delay evolution prof le approach.
This algorithm will be implemented into a prototype and ex-perimentally tested. A demonstration will be conducted during the SECUR-ED project demonstration, in order to verify com-pliance with international standards ANSI N42.35 [18].
ACKNOWLEDGMENT
The authors would like to thank J, Dumazert for his help in writing this paper.
REFERENCES
[1] “Radiological control of vehicle load,” SAPHYMO Technical f le 29294 835 EN, 2011 [Online]. Available: http://www.saphymo.fr [2] “RADOS DnD-Portal,” MIRION Technologies Technical f le, 2010
[3] L. J. Kangas, P. E. Keller, E. R. Siciliano, R. T. Kouzes, and J. H. Ely, “The use of artif cial neural networks in PVT-based radiation portal monitors,” Nucl. Instrum. Methods Phys. Res., vol. A587, pp. 398–412. [4] R. Hevener, M.-S. Yim, and K. Baird, “Investigation of energy win-dowing algorithms for effective cargo screening with radiation portal monitors,” Radiation Measurem., 2013, In Press.
[5] R. C. Runkle, M. F. Tardiff, K. K. Anderson, D. K. Carlson, and L. E. Smith, “Analysis of spectroscopic radiation portal monitor data using principal components analysis,” IEEE Trans. Nucl. Sci., vol. 53, no. 3, pp. 1418–1423, 2004.
[6] S. M. Robinson, S. E. Bender, E. L. Flumerfelt, C. A. Lopresti, and M. L. Woodring, “Time series evaluation of radiation portal monitor data for point source detection,” IEEE Trans. Nucl. Sci., vol. 56, no. 6, pp. 3688–3693, 2009.
[7] R. B. Vilim, R. Klann, C. Fink, C. Campos, and T. Medley, “Sensitivity improvement in low-prof le distributed detector systems for tracking sources in transit,” in Proc. IEEE Conf. Technol. Homeland Security, 2007, pp. 174–179.
[8] S. Brennan, A. Mielke, and D. Torney, “Radioactive source detec-tion by sensor networks,” IEEE Trans. Nucl. Sci., vol. 52, no. 3, pp. 813–819, 2005.
[9] J.-C. Chin, N. Rao, D. Yau, M. Shankar, Y. Hou, J. Hou, S. Srivathsan, and S. Iyengar, “Identif cation of low-level point radioactive source using a sensor network,” AMC Trans. Sensor Netw., vol. 7, no. 3, pp. 21:1–21:35, Sep. 2010.
[10] R. Nemzek, J. Dreicer, D. Torney, and T. Warnock, “Distributed sensor networks for detection of mobile radioactive sources,” IEEE Trans.
Nucl. Sci., vol. 51, no. 4, pp. 1693–1700, 2004.
[11] D. Stephens and A. Peurrung, “Detection of moving radioactive sources using sensor networks,” IEEE Trans. Nucl. Sci., vol. 51, no. 5, pp. 2273–2278, 2004.
[12] L. Quian, J. Fuller, and I. Chang, “Quickest detection of nuclear radia-tion using a sensor network,” in Proc. IEEE Conf. Technol. Homeland
Security, 2012, pp. 648–653.
[13] A. Sundaresan, P. K. Varshney, and N. S. V. Rao, “Distributed detec-tion of a nuclear radioactive source using fusion of correlated deci-sions,” in Proc. Int. Conf. Infor. Fusion, 2007, pp. 1–7.
[14] K. Boudergui, V. Kondrasovs, R. Coulon, G. Corre, and S. Normand, “New monitoring system to detect a radioactive material in motion,” in Proc. ANIMMA, 2013.
[15] “EJ-200 plastic scintillator,” Eljen Technology [Online]. Available: http://www.eljentechnology.com
[16] C. Carasco, C. Eleon, B. Perot, K. Boudergui, V. Kondrasovs, G. Core, S. Normand, G. Sannié, R. Woo, and J.-M. Bourbotte, “Data acquisition and analysis of the UNCOSS underwater explosive neutron sensor,” in Proc. ANIMMA, 2013.
[17] V. Kondrasovs, R. Coulon, and S. Normand, “An adaptive smoother for counting measurements,” in Proc. ANIMMA, 2013.
[18] IEEE, “American national standard for evaluation and performance of radiation detection portal monitors for use in homeland security,” ANSI 42.35, 2006.