Characterization of Nanofilter Arrays for Small
Molecule Separation
by
Hansen Chang Bow
B.S. Electrical Engineering and Computer Sciences, 2004
University of California, Berkeley
Submitted to the Department of Electrical Engineering and Computer
Science in partial fulfillment of the requirements for the degree of
Masters of Science in Electrical Engineering and Computer Science
at the
MASSACHUSETTS INSTITUTE OF TECHNOLOGY
June 2006
© Massachusetts Institute of Technology 2006. All rights reserved.
Signature of Author:
Li
Department of Electrical Engineering and qnputer Science
May
25,
2006
)
Certified by:
Assistant Professor
Jongyoon Han
of Electrical Engineering and Computer Science
rvisor
Accepted by:
IProfessor of Electrical Engineering and Computer Science
MASSACHUSETTS INSTITUTE,
OF TECHNOLOGY
Characterization of Nanofilter Arrays for Small Molecule
Separation
by
Hansen Chang Bow
Submitted to the Department of Electrical Engineering and Computer Science on
May
25,
2006, in partial fulfillment of the
requirements for the degree of
Masters of Science in Electrical Engineering and Computer Science
Abstract
Experimental studies were performed to evaluate methods of improving
separation resolution and speed in microfabricated nanofilter arrays. Experiment
parameters investigated include electric field strength, nanofilter geometry, and
buffer concentration. DNA polymers of size 25-1000 base pairs were the subject of
our study.
We concluded that increasing electric field strength resulted in inferior
separation for larger DNA polymers (400-1000 bp). Additionally, we quantified
the improvement in resolution of smaller nanofilter pores and lower buffer
concentration. A theoretical model based on Macrotransport Theory was developed
to estimate average species velocity and peak dispersion.
Thesis Supervisor: Jongyoon Han
Acknowledgments
I would like to thank Professor Han for being my research mentor and teacher. His passion,
resourcefulness, and patience have always been qualities I try to emulate. I am especially grateful for his encouragement when experiments are successful and his suggestions and willingness to help when experiments do not work out as we had hoped.
I would also like to thank Jianping Fu for guiding me through the fabrication process and
discussing various aspects of biomolecule separation. Current and past lab members have also helped me immensely with my research and become good friends. They include Pan Mao, Arnaud LeCoguic, Noel Reyes Gonzalez, Ying-Chih Wang, and Yong-Ak Song. The staff at MTL's ICL were enjoyable to work with and extremely supportive.
I will be forever grateful to the teachers who have provided me the foundation to what I do today
and who have broadened and challenged my thinking. I am also indebted to my parents and my family for encouraging me to do what interested me and brought me happiness.
Finally, this research is made possible with the support of funding sources NIH
Contents
1 Introduction
9
2 Background
11
Electrokinetic Phenomena
I1
Debye Length
I1
Electrophoresis
12
Electroosmosis
12
Separation of DNA and Other Biomolecules
13
DNA electrophoresis
13
Overview of Free-Solution DNA Separation in Microdevices
13
3 Materials and Methods
15
Reagents
15
TBE Buffer
15
YOYO-1 Labeled DNA
15
Microfluidic Device
16
Remark: Bubble formation
17
Remark: Filling
17
Equipment
18
Voltage
18
Illumination
18
Microscope
18
Data Acquisition and Processing
19
Experiment Procedure
19
Buffer Concentration Equilibration inside Channels
19
Reservoir Preparation
19
Experiment Execution
20
4 Characterization of Velocity and Dispersion in Nanofilter Arrays Based on
Macrotransport Theory
21
Diffusion Constant Modification to Incorporate Convective Band Spreading in Shallow
Region
26
5
Characterization of Electric Field Dependent Nanofilter Separation
Resolution
29
Experimental Setup
29
Results and Discussion
30
Standard Deviation and Dispersion in the Nanofilter Array
32
Resolution
33
Conclusion
34
6 Characterization of Separation in Nanofilter Arrays with Different
Structural Parameters
35
Experimental Setup
36
Deep region depth
37
Shallow Region Depth with Fixed Ratio between Shallow and Deep
42
Conclusion
43
7 Control of Effective Nanofilter Gap Size by Ionic Strength
45
Experimental setup
46
Results
48
Discussion
52
Electroosmotic Flow
52
Selectivity and Ionic Strength
53
Non-uniform Free Solution Mobility of Small DNA
55
Persistence Length Changes
56
Conclusion
56
8 Conclusion
57
Chapter
1
Introduction
In parallel with the development of microelectronics and integrated circuits, the field of Microelecromechanical Systems (MEMS) has expanded from focusing mainly on pressure sensors and automobile accelerometers to presently the large areas encompassing relevant devices in medicine, optics, imaging, and positioning. One of the applications of this technology is in the area of biology, termed BioMEMS: microfabrication has enabled the creation of devices on the length scale of cells (ptm) and large biomolecules (10 nm), such as DNA2. Advantages of BioMEMS compared to traditional
bio-analysis methods include faster preparation and bio-analysis times, smaller sample requirements, integration of multiple steps on one device, and increased sensitivity.
Within BioMEMS, much research has been carried out during the past decade on separating biomolecules, such as carbohydrates, proteins, and DNA3. The characteristics that these separation
methods rely on include size4, charge', isoelectric point6, binding affinity7, and diffusivity8. The unique aspect of these separation methods is that they do not require the use of conventional sieving gels, such as polyacrylamide or agarose. These separations are accomplished in free solution, which facilitates sample recovery.
Separation of DNA has been extensively investigated in microfluidic devices. The separation of large DNA (> 10 kbp) in free solution has been accomplished with hydrodynamic chromatography9, entropic traps4, and pulsed-fields electrophoresis in the presence of posts0. Additionally, the separation of small (< 1 kbp) DNA in these devices has also been demonstrated without the use of gels. Using the same device geometry as Han et al. for separating large DNA4, Fu et al. recently demonstrated separation of small DNA (< 1000 bp)1 and proteins.
While separation of small biomolecules using microfabricated nanofilters has been demonstrated, further optimization is critically needed with respect to the following three objectives. First, these devices currently cannot separate natural proteins, carbohydrates, or hormones. The ability to separate these molecules on a microfabricated chip could lead to cheaper and more accurate screening and diagnostic medical devices. Second, to achieve better separation, we must understand and characterize the sieving process. The resolution achieved by a separation method depends on two factors: selectivity and dispersion. While selectivity in these devices has been addressed by Fu et al.'2, dispersion has not. Third, a theoretical model is necessary for understanding and predicting both selectivity and dispersion in different device geometries and experimental conditions.
concepts relevant to this work and briefly review relevant literature. In Chapter 3, we detail the specific materials and methods used in our experiments. In Chapter 4, we develop a basic model of ensemble velocity and dispersion based on Macrotransport Theory 3. The following three chapters provide experimental results and discussions regarding the three aspects of nanofilter separation that we analyze: electric field strength, structural dimensions of the array, and buffer concentration. We conclude by summarizing our results and suggest future directions for research on nanofilter arrays.
Chapter 2
Background
When an electric potential is applied across a liquid containing charged particles, the particle movement that results is primarily a combination of electrophoresis and bulk electroosmosis. We briefly describe electrokinetic phenomena by providing a foundation with Debye length and then explaining electrophoresis and electroosmosis. More detailed reviews on electrokinetic phenomena1 4 15 and DNA/electrophoresis 4 can be found elsewhere.
Electrokinetic Phenomena
Debye Length
When a charged surface is in contact with an electrolyte solution, counter-ions, ions oppositely charged with respect to the surface, will be attracted to it while co-ions will be repelled. The distance over which this effect occurs is called the electrical double layer, and the Debye length is a measure of its thickness:
eRT 2 n F2 z c
where c is the permittivity of the liquid, R is the gas constant, T is the temperature, F is the Faraday constant, z, is the charge of ion i, and c1a is the concentration of ion i far from the surface. The Debye
length is proportional to the inverse of the square root of the ionic strength. Intuitively, greater concentration of ions results in greater shielding capacity, decreasing the Debye length. Outside the electrical double layer, the solution is electrically neutral.
Using the Debye-Htckel approximation, the electric potential in the solution is
where x represents the distance from the charged surface and 0, is the potential at the charged surface. From the Boltzmann distribution, the concentration of ion i in the solution is
Ci = ci, exp( z' F) RT
where ci,, is the concentration of ion i far from the surface. For a monovalent co-ion, the location x where $ equals 26 mV is the location where the concentration decays to l/e of its value far from the surface, since RT/F = 26 mV at room temperature. In addition to the Debye length, this distance may be used to
characterize the co-ion exclusion distance.
The potential at the wall may not be the most appropriate for analyzing experimental results, since there is usually a layer of ions permanently adsorbed to the wall. The distance over which the ions are fixed is called the Stem layer. The zeta potential, , is the potential at the fluid slip plane just outside the Stem layer.
Electrophoresis
Electrophoresis occurs when an electric field causes a charged object to move with respect to a stationary liquid. A simple model for the particle velocity for relatively small Debye lengths compared to particle size is given by the Helmholtz-Smoluchowski equation.
U = E
P
where E is the transverse electric field and u is the liquid viscosity. This model does not take into account the viscous drag created by the electroosmotic movement of the counterions, the increased conductivity immediately around the particle that reduces the effective electric field, or the dipole that is established from the non-spherical shape of the counter-ion cloud. From this equation, the electrophoretic velocity is independent of particle size for a given surface potential.
Electroosmosis
In contrast to electrophoresis, electroosmosis occurs when the liquid nearby a stationary charged object in solution moves in the presence of an electric field. This effect is caused by mobile ions in the electrical double layer migrating toward the oppositely charged electrode. The ion migration drags adjacent liquid by viscous forces, which results in overall liquid flow.
The electroosmotic flow profile between parallel charged plates is
U = - ;( - exp(-Ia - yJ / AD))E
where the plates are located at ±a. In the limit when the gap between the plates is large relative to the Debye length, i.e. for large a/AD, the electroosmotic flow velocity is effectively constant throughout the channel cross section. The value of this constant is again given by the Helmholtz-Smoluchowski equation
Separation of DNA and Other Biomolecules
DNA electrophoresis
DNA is a polymer consisting of a sequence of base pair monomers. The double helix can be
approximated as a cylinder with a 2.0 nm diameter and a rise/bp of 0.34 nm. When the contour length, the end to end length of a DNA molecule stretched linearly, is much greater than
4,
= 50 nm ~ 150 bp, thepersistence length of DNA, its conformation is a random walk of step I = 24p = 100 nm. The approximate radius of this DNA molecule is given by the radius of gyration, Rg.
R9
=- ((R n- Rc,)2)I1 2
=-N
26
where N = contour length / 1, Rn is the location of segment n, and Rn is the location of the chain's center
of mass. When the contour length of DNA is shorter than p, DNA can be approximated as a rigid rod of length 0.34 x number of bp.
The negatively charged phosphate groups of DNA contribute 2 negative charges per bp to the overall charge of the molecule in neutral to alkaline pH. At the 8.3 pH used in our experiments, DNA is negatively charged. Therefore, in free solution under the influence of an electric field, they are dragged toward the anode.
Overview of Free-Solution DNA Separation in Microdevices
With the Human Genome Project (HGP) as stimulus, starting in the 1990s there has been an intense interest in developing microfluidic devices that can efficiently carry out Sanger sequencing of
DNA. As was implied in the Electrophoresis section, the free solution mobility of long DNA polymers is
independent of size. Although there have been efforts to attach molecular parachutes to the ends of these strands to create differences in mobility, this method has not generally been successful in separating DNA beyond 150 bp5. Traditional methods of separating DNA based on size evolved from 1950s methods of
separating proteins and RNA. Agarose or acrylamide gels in containers with a length scale of 10 cm are typically used. These gels act as a sieve and smaller DNA fragments travel faster in the presence of an electric field. This method is still the most popular in typical biology laboratories today.
A major improvement to conventional gel electrophoresis, which was spurred by the human
genome project, is capillary gel electrophoresis (CGE). During the 1990s, researchers experimented with ways of filling a microfluidic channel with a sieving gel1 6. This method provided improvements in the
areas of sample amount, speed, ease of use, and integration of multiple preparation steps over traditional agarose or acrylamide separation techniques. The HGP, completed in 2003, primarily relied on this method.
Although capillary gel electrophoresis has been successful, filling a microfluidic channel with gel is not an easy process. Furthermore, this filling requirement makes integration with other processing steps on the same microfabricated device difficult. Because of these limitations, researchers have also
developed gel-free sieving structures in microfabricated devices". Gel-free systems also enable sample collection. The separation mechanisms in gel-free microfluidic separation systems can be categorized into three broad categories: hydrodynamic chromatography, diffusivity, and sieving.
In hydrodynamic chromatography, each class of molecules samples different fluid streamlines with a unique probability distribution. For example, the center of a microfluidic channel travels faster than the edges due to viscous shear and no-slip at the walls. Large molecules will tend to sample the center flow stream more, since they are sterically hindered from sampling the edges. Thus large molecules travel faster. Blom et al. have used pressure to separate polystyrene beads18; Pennathur and Santiago used electric field to separate proteins based on charge repulsion from the wall'; and Iki et al. have used both electric field and pressure to separate DNA from 120 to 23130 bp19. Building on these one
dimensional separation methods, two dimensional separation schemes were developed that could continuously separate and collect the separated particles. Huang et al. created a two-dimensional array of posts, which deflects particles laterally based on size2 0. Takagi et al. also created a device that sends particles to different channels by first pushing them against a wall and then having them follow their corresponding fluid streamline. In all of these hydrodynamic chromatography separation methods, achieving high resolution is difficult. Fundamentally, in a parabolic flow profile, e.g. plane Poiseuille
flow, the fastest particle can travel at a maximum of 1.5 times the speed of the slowest particle.
Another method of separating biomolecules in gel-free microfabricated devices exploits particles' diffusivity differences. The separation process is based on the concept of a ratchet: particles can only go forward, not back. Small particles travel faster because they diffuse forward faster than larger particles. To achieve the ratchet effect, Bader et al. created a periodic array of parallel alternating electrodes, with the distance between one electrode and its two neighbors being highly unequal22. The electric field would be switched on and off. Once a particle crosses the oppositely charged electrode when the electric field is off, it would be pushed forward to the next electrode when the field came back on. Similar in idea, van Oudenaarden and Boxer created a two dimensional array of diffusion barriers and used pressure-driven flow to separate non-polar phospholipids23. In both of these methods, high resolution is difficult to achieve, because diffusivity for a sphere depends only weakly on mass (~M-113
A third method of separating biomolecules in microfabricated devices is sieving. An array of
small pores is created, and molecules are separated based on their ability to cross each pore. One of the pioneering studies of the class of devices was performed by Volkmuth and Austin. They created a two-dimensional array of pillars that was able to separate large DNA based on its ability to reptate through the array. Huang et al. used asymmetric pulsed fields and a two-dimensional array of pillars to separate and collect DNA 61-209 kbp. Han and Craighead created a channel with alternating depths that was also able to separate large (5 -160 kb) DNA26. Interestingly, in both this study and one-dimensional movement in the array of pillars larger DNA moved faster than smaller DNA. Using a similar device geometry as Han and Craighead, Fu et al. demonstrated separation of small DNA (100-1000 bp) and proteins27. Their method of separation involves smaller particles entering the shallow region more easily than larger particles, which results in greater velocity. They have also demonstrated two-dimensional separation and sample collection based on the same principles28.
In this work, our eventual goal is to optimize Fu et al.'s nanofilter array' to separate even smaller particles, such as carbohydrates with sizes on the order of 10 bp of DNA. We determined that other methods of separation, such as hydrodynamic chromatography and diffusion, were not able to yield the resolution these carbohydrates required. As a precursor step, we used DNA as a model molecule to explore methods of increasing separation resolution. To achieve this goal, we experimented with electric field strength, device structure parameters, and buffer concentration.
Chapter 3
Materials and Methods
The materials and methods described in this chapter are used throughout this thesis. Only exceptions are mentioned in later chapters.
Reagents
TBE Buffer
Tris-Borate-EDTA (TBE) buffer was obtained from Sigma Aldrich. After dilution with the
indicated amount of deionized water, which produced TBE 5x, the solution contained 0.445 M
Tris-borate and 10 mM EDTA at pH 8.3. Different buffer concentrations were created by further diluting with
deionized water.
YOYO-1
Labeled DNA
Fifty pl of the buffer planned for the experiment, 0.4 pl Invitrogen YOYO-1 dye, and 2.5 pg of
either Invitrogen or New England Biolabs DNA were mixed together and left in the dark for 1 hour before
Microfluidic Device
Figure 3.1: Photograph of device after attachment of reservoirs.
Reservoir #1
Sample
EDNA
4 Q]
Cathode (+)
Nanofilters
Anode (-)3
Waste
Figure 3.2: Schematic
device.
I
of reservoir numbering and purpose. Refer to Figure 3.1 for a photograph of the
I
Figure 3.3: Schematic of nanofilter region connecting reservoirs 4 and 2. The green and red rods represent smaller and larger DNA respectively. The smaller DNA moves faster through the nanofilters.
The fabrication methods for the devices used in this thesis are detailed in Fu et all'. Specifics
regarding the bonding of the pyrex cover to the etched silicon are detailed in Mao et a1
29. The periodicity
of the shallow and deep regions for the devices used in this thesis is 1 pLm. Immediately after device
fabrication, a small amount of TBE lx buffer was deposited in the access holes of the chip. Through
capillary action, the buffer filled the device's channels within minutes. The devices were then stored in
TBE Ix until needed.
To prepare a device for experiments, reservoirs were first attached to the access holes. The
reservoirs consisted of a shortened TipOne 0.1-10 pl Natural Pipet Tips tip affixed with Amazing Goop
Plumbing Contact Adhesive and Sealant. The reservoirs were then filled with TBE lx and covered with
Parafilm Laboratory Film to prevent evaporation until use.
The experiments in Chapter 7 regarding buffer concentration were done with devices fabricated
by Jianping Fu, since they could withstand higher voltages without bubble formation as mentioned next.
Remark: Bubble formation
Air bubbles violently appeared in the microfluidic channels of the devices used in Chapters 3 and
4 when the voltage was increased beyond 30 v / cm. We speculate not enough insulating oxide covered
the semi-conductive silicon substrate in certain locations, leading to electrical conductance through the
channel. This defect may be produced by debris during the fabrication etch step creating silicon spikes.
Subsequently, these spikes were not adequately converted into silicon dioxide during the oxidation step.
Hydrogen and oxygen gas are generated at the electrodes when a current flows through water.
The conductive locations inside the channel effectively became electrodes, and hydrogen or oxygen was
generated at those locations. These bubbles interrupted both the electric field and the path of the DNA
in
the separation region. At this point, the experiment was be aborted.
Figure 3.4: Photograph of bubbles toward the end of the separation region. The bubbles are 1/5 the figure
width from the right. The device dimensions are 60/240 nm.
Remark: Filling
Devices with 40 nm shallow regions did not fill with TBE buffer. We speculate adverse surface
conditions caused this problem. We attempted to use de-gassed buffer. We also tried biasing the silicon
substrate. Neither of these efforts was successful.
Equipment
Voltage
Voltages were supplied by a Labsmith HVS448 3000D High Voltage Sequencer. The output
voltages were connected to 100 kW resistors to prevent fluctuation at low voltages (< 50 V). The voltages
supplied were observed to be accurate within 0.5 V of the desired value.
The nominal voltage used in each experiment was calculated based on the voltages applied at the
four reservoirs, Figure 3.2. To calculate the voltage at the intersection, we ignored the voltage applied
at
reservoir 4, since the resistance from the intersection to reservoir 4 is much larger than that to reservoirs
1,
2, and 3. Reservoirs 1, 2, and 3 are about equidistant from the intersection, so the voltage
at the
intersection is 2/3 the value applied at reservoirs 1 and 3, which are always equal in the experiments.
Thus
the voltage across the separation region is the voltage at reservoir 4 subtract 2/3 the voltage at
reservoir 3.
For example, if the voltages at reservoirs 1, 2, 3, and 4 are 15, 0, 15, and 50 V, the voltage we
indicate is
50 - 2/3 * 15 = 40 V/cm.
Illumination
An Olympus Optical Co. Model U-LH100HGAPO Mercury Lamp was used to provide
large-scale illumination. For intensity measurements, a National Laser Company Argon Ion 488
nm laser
provided more concentrated and less noisy illumination.
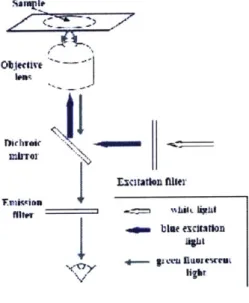
Microscope
An Olympus IX-71 inverted microscope was used to view the microfluidic channels. To quantify
the YOYO-1 labeled DNA sample, which has an optimal excitation wavelength at 491 nm and
emission
wavelength at 509 nm, the corresponding excitation filter, dichroic mirror, and emission
filters were
chosen. For intensity vs. time measurements, a 40x objective lens was used.
4 sanqtIt Mchjei
Jk~fr
muExcit\ruljvift
*blue acitation fgt lightV_
J't 40 410 00 0 C 650 70C '5(
waveIang (rwnm)
Figure 3.7: Filter transmittance vs. wavelength. Blue: excitation; red: emission; green: dichroic mirror.
Adapted from LeCoguic et al.
30Data Acquisition and Processing
Images were captured on a PCO CCD Imaging SensiCam Camera and analyzed using
Scanalytics' IPLab software. For all of the experiments, the image capture location was 0.5 cm from the
start of the nanofilter region. Images were recorded every 0.5 s using 200 ms exposure. Curve-fitting was
done using OriginLab Origin 7 software. From the curve-fitting, the mean velocity and standard deviation
of the elution profiles were extracted.
To obtain the normalized mobility plots from the mobility data, all values were divided by the
zero-size mobility. The zero-size mobility was extrapolated by linear least squares fitting of the first three
data values. Typically these corresponded to 100, 200, and 300 bp or 50, 150, and 300 bp.
Experiment Procedure
Buffer Concentration Equilibration inside Channels
Before the actual experiments, the original buffer (TBE Ix) was removed from the reservoirs and
the buffer planned for the experiments loaded. The device was then covered with Parafilm.
Reservoir-specific platinum wires were rinsed with deionized water, ethanol, and deionized water again before
insertion into the reservoirs through the Parafilm. Twenty Five volts were then applied across the
nanofilter region for at least 12 hours. This voltage generates electroosmotic flow, which equilibrates the
buffer concentration inside the channels.
Reservoir Preparation
Reservoirs are numbered, as shown in Figure 3.2. The buffer in reservoir 1 is replaced with the
labeled DNA sample. The other reservoirs are replaced with buffer of the specified concentration. The
reservoirs are re-covered with Parafilm. The reservoir-specific platinum wires, which prevent
contamination, are inserted through the Parafilm.
Experiment Execution
To load the DNA, 20 volts were applied to reservoir 3 while the other reservoirs were grounded for at least 15 minutes. Once the intensity at the intersection was determined to be high enough (typically the maximum intensity was greater than 1000 units when illuminated by the mercury lamp through a 40 x objective using an amplification value of 3 and 4 x 4 binning in IPLab) the experiment was started.
Typically, an experiment consisted of 5 minutes of loading, 5 or 10 seconds of injection, and 2 hours of running. The timer is started at the same time as injection. After ensuring that the DNA has entered the separation region and is migrating through the nanofilters, the microscope stage is positioned at the intensity measurement location (typically next to marked location at center of the channel, 0.5 cm from the injection location). The light source is then changed from the mercury lamp to the argon-ion laser, and recording commences.
After an experiment, the nanofilter region is checked to ensure that it is free of DNA. If the channel is clear, the next experiment can proceed.
Chapter 4
Characterization of Velocity and Dispersion in
Nanofilter Arrays Based on Macrotransport
Theory
The separation resolution of a particular device and set of running conditions is critically determined by the average velocity and dispersion of the groups of molecules we attempt to separate. As a guide to more effective separations, we develop a theoretical model that attempts to predict the velocity and dispersion of groups of molecules.
One method of modeling the periodic nanofilter array is based on Macrotransport Theory. An excellent reference is Brenner and Edwards' Macrotransport Processes. In Macrotransport Theory, which is effectively a generalization of Taylor-Aris dispersion, the micro-scale transport processes are abstracted into a large-scale view of the system. Identical repetitive elements are mapped onto one representative period, which simplifies the analysis significantly. The power of Macroransport Theory is its ability to easily obtain the average velocity and dispersion of groups of molecules without considering small scale details of molecular motion and interaction in the sieving media.
In his PhD thesis, Dorfman created a discrete macrotransport framework to analyze the velocity and dispersion of molecules in periodic microfluidic separation devices". Furthermore, Dorfman et al. created a model for large (10-100 kbp) DNA moving through a nanofilter array identical to the one used in our experiments3 2. In this model, the amount of time it took the DNA to cross each trap, the trapping time, is converted into an effective additional distance to travel. The results of this model, for which the trapping time was extracted from experimental data, matched the experimental results qualitatively but not quantitatively.
In this section, we develop a macrotransport model for small (10-1000 bp) DNA moving through a nanofilter array. We begin by mapping each deep region and half of each adjacent shallow region of our periodic nanofilter array to a state. Molecules that move within a period do not contribute to a state transition: only molecules that cross the threshold between periods transition states. One assumption of this model is that once a molecule enters a deep region (a single state), dispersion within that 'state' (within a deep region) is fast (either by field-driven convection or diffusion) compared to the transitions between states. In such a 'perfect' mixing case, one could conceptually ignore any complex 3D convection and dispersion within a deep region, therefore significantly diminishing the complexity of the
Molecules in a state (a deep region) can move to an adjacent deep region. This movement is classified as a transition between the two neighboring states. These transitions are initiated by electrophoresis and diffusion, Figure 4.1. By characterizing transitions out of a one particular state for some class of molecules, we can make generalizations about the macroscopic behavior of this class.
For this model, we assume DNA free solution mobility is independent of size. This assumption is generally valid for DNA larger than 400 bp, and is valid within 5% from 400 bp down to 100 bp". We assume that this free solution mobility and diffusivity is the same in the shallow region and the deep region, although the diffusivity of DNA located between parallel plates is known to be somewhat less than its diffusivity in free solution3 4. Additionally, it is arguable, although conclusive evidence is not available, that the electrophoretic mobility of DNA in the size range of interest is different in a parallel plate microchannel3". Even in that study, 1-15 kbp DNA electrophoretic mobility differed by approximately 7% over the entire range. We do not consider the dipole-inducing orientation effects of the electric field on the DNA partitioning between shallow and deep regions36. Despite these simplifications, the results of our model agree reasonably well with experimental results.
A La11
C I
A a C
Figure 4.1: Mapping of each nanofilter period into a state.
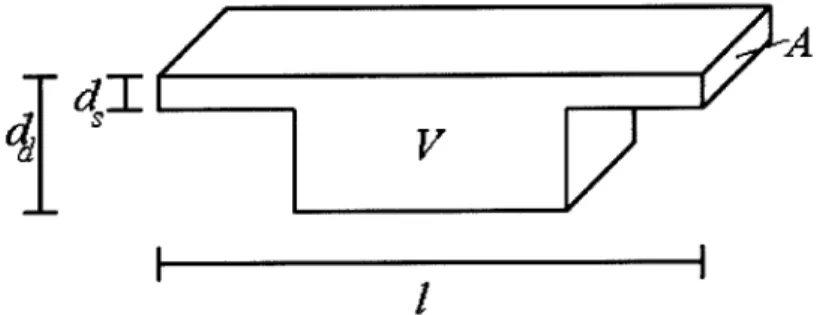
We start by defining variables. Variables with a subscript n are dependent on DNA size.
x aposition
V period volume
1
aperiod lengthA cross-section area through which molecule transitions between periods
d, adepth of shallow region dd depth of deep region
a dd/ds
to aduration of time
U velocity of DNA in the shallow region
Dn adiffusion coefficient
P,, concentration of molecules at A relative to overall concentration in V
L distance from separation region entrance to observation point tntravel
mean elution time for a group of molecules
d
I
~
Figure 4.2: Dimensional variables with respect to nanofilter period. V refers to the entire volume of the period. The out-of-page dimension is not to scale: it is much larger than the other two dimensions.
Time is partitioned into very small discrete segments of duration to. The velocity of DNA in the shallow region, U, is independent of DNA size. We arbitrarily make convective velocity point to the right. To determine U, we first extrapolate the time it takes for a point-sized particle to elute, as mentioned in the Materials and Methods chapter. Theoretically, the velocity of point-sized particles is not affected by the constrictions: their movement only depends on electric field. The electric field in the deep region is
1/a its value in the shallow region, using Gauss' Law. The velocity of the point particle in the deep region
is then U/a, assuming mobility is independent of electric field. The overall velocity is then:
L
1
timeo int,,travel / + la
2U 2U
U=a+I L
2 timepo int, travel
To calculate P,, we use the concept of a partition coefficient, which is the relative concentration of molecules in a constrained region relative to a free region. The partition coefficient for rigid rods between parallel plates separated by distance d is given by37
K !rod
I1
whn'rodK =1-
when 12 d
d
K = d otherwise 2 1rod
We approximate the DNA molecules as semi-rigid rods, following the Kratky-Porod worm-like chain model38. The equation relating the DNA size to the end-to-end length is
L = 2lnip 1 - 1- exp(- "j
in 1P
where 1, is the persistence length and In is the contour length of the DNA. A typical value of
4p
is 50 nm, which corresponds to 147 bp. The contour length In is the size in bp, n, multiplied by the rise per base pair,Modeling the DNA as rods, we first determine the available volume for DNA in the shallow region, using C as a reference concentration.
Cshallow =-Kshallw C
The overall concentration in the entire period is the number of molecules in the shallow and deep regions divided by the overall volume:
Kshallow C Vshallow+ Kdee CVdeep
Coveraii
shallow + Vdeep
then
Cshallow
Coverall
Kshallow
(Vshallow
+ VdeepKsallow Vshallow + Kdeep Vdeep
First we consider electrophoresis-driven movement. In one time step, the proportion of molecules transitioning out of a state is
to(Pn AU) V
where the expression in parenthesis is the flux out of the period.
In diffusion-driven movement, the diffusive velocity is defined as
Dn
Analogous to electrophoresis-driven movement, the proportion of molecules transitioning out of a state
by diffusion-driven movement is to(Pn ADn)
P/7
The average velocity of the molecules is the expected value of the molecules' position after one
E[x]
to
to(Pn AU) + to (P ADn)
V
P
to(P, ADn)
to
_
PnAU
V
The variance of the molecule's position after time to is
E[x-x)
2]=
-to(PnAU) +to(PADn)
12to(PnADn)
12V
P
P7
_(to(PnAU)
) 2V
As we partition time finer and finer, the last term in the expression becomes insignificant, relative to the first two terms:
m2].
to(PAU) to(PADA)
)2fimo-
E[(x
X-x] ~
+
P7+to
(Pn
ADJ 1 2+ P
The effective diffusivity is then defined as
2dt
SPnA U+2
Dn1 22 V (
)
To approximate the standard deviation of the species electropherogram at the point of observation, we calculate the SD in distance and then convert it into the SD in time by dividing by the empirical velocity. SDndi a = 2D*tntael =
PA (U
+2Dn )j2t travel V 1 SD ntimeL~ cetn,travelPnA (U
V
+2Dn 1 ) 2,travel ,travel LDiffusion Constant Modification to Incorporate Convective Band Spreading in Shallow Region
The diffusion constant that we used above D, only accounts for pure molecular diffusion across
nanofilters. A more accurate description takes into account the spreading due to the electric field strength
and contours in the shallow region: if molecular diffusion were negligible with respect to axial velocity in
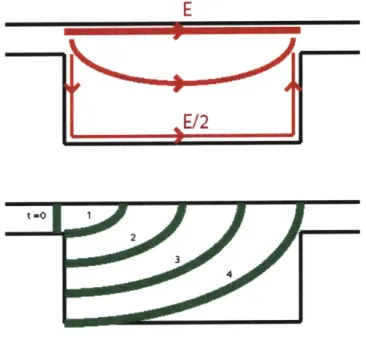
the shallow region, molecules would still spread in a racetrack-like way, Figure 4.3.
E
E/2
t
=0 1 2 3 4Figure 4.3: Top: Representative average electric field lines and strengths. The average field strength along
the bottom and sides of the deep region is half that along the top, if the length of the deep region is twice
its depth. This conclusion follows from unique voltages at the entrance and exit of the deep region, and
the lengths of the bottom and sides being approximately twice that of the top. Bottom: DNA plug
spreading due to differences in electric field strength. A molecule moving along the top edge will arrive at
the exit in % the time of a molecule traveling along the sides and bottom, since the electric field strength
is half as strong and the contour length is twice as large for the sides and bottom compared to the top.
We can model this convective spreading in a similar manner as band spreading in a microfluidic
channel turn. As an approximation, we map our rectangular geometry onto a semicircle turn geometry by
equating the inner semicircle length to the top deep region length, and the outer semicircle length to the
sum of the lengths of the sides and bottom. From Griffiths and Nilson
39, an effective diffusion constant
for the spreading in a turn is
D = 4 +D
=
30r
2DO+6Ua
2r
where U is the average flow speed, a is the channel width, 0 is the angle of the turn, r is the average
radius, and D is the molecular diffusivity.
In the context of our 80/320 nm devices,
(Deff-D)/D
was on the order of 10-3: the racetrack effect
is not significant. The values we use for this calculation are U
=
10-3 cm/s (the fastest velocity in our
experiments), a
= (320*2+500-500)/
=
1.8
x 10-5 cm, 0=
a, r = (320*2+500+500)/(2n) =
2.1
x10-5 cm,
and D = 10-7 cm2/s. As a result, Deff= 7.9* 10-"1 + D.
as the convective velocity in the deep region, 10-1 cm2
/s as D and 320 x 10-7cm as the depth of the deep region. Then Pe = .32, which indicates that in the time for the molecules to travel axially across a trap, the
transverse concentration is smoothed out. Molecules in the faster streamline have time to diffuse into slower streamlines before traversing a period.
The racetrack effect could be important in devices with deeper deep regions, which would result in a larger Peclet number. From the equation above, a would increase, making the racetrack term more important. The reasoning is that the diffusion velocity would decrease dramatically, resulting in molecules having less time to move from one streamline to another.
Alternate Method of Deriving Dispersion due to State Residence Time Distribution
We make three assumptions:
1) Mapping of one period of the nanofilter array onto one state (i.e. what happens in one period does not
affect what happens in the next)
2) Fast mixing within each period (or state) with respect to transition rate
3) Only transitions forward permitted (we only consider electrophoresis here)
We will discuss the validity of these assumptions later.
If the elapsed residence time of molecules in each state have no bearing on their time to transition,
then the time to transition necessarily takes the form of an exponential. We use the same definitions as earlier and the new variable
n L/l = number of states from start to detector
The expected time to transition for molecules in each state is
E[transition time] = tntravel/n
Based on the properties of the exponential probability density function, the variance of the time to transition is
var(transition time) E[transition time]2
2
_ n,travel
( n )
Then the variance in elution time due to state residence is
var(elution time)= n*var(transition time)
The standard deviation in elution time is then
SD(elution time) = tn,travel
This expression is consistent with the earlier result, with Dn set to 0.
Assumption 1 implies that the residence time in one state has no effect on the residence time in the next state. In the context of our experiments, if molecular diffusion is completely absent, a molecule
would move along a given electric field line. Because some electric fields are stronger than others,
molecules located on the higher electric field would consistently travel faster, filter after filter.
Figure 4.4: Electric field lines across two traps. The red electric field line is greater in magnitude than the
yellow, which is greater than the green by uniqueness of potential. Then a molecule traveling on the red
electric field line would travel much faster than a molecule on the green.
However, correlated speed across traps is not the case. A typical shallow region depth is on the order of
100 nm =
10-5cm. Typical diffusivity values for DNA 100
-
1000 bp is I0- cm
2/s. Then a typical time
constant for diffusion across streamlines in the shallow region
is 12/D
= 10-s. The time constant for
crossing the shallow region is on the order of elution time / number of filters
=1000
s / 104 filters = 10-1 s/ filter. Because the time constant for diffusion is much less than that for convection (i.e. the Peclet
number << 1), many shallow region diffusion events can happen before a trap crossing. Hence the
correlation in residence time in two consecutive traps due to staying on a field line is extinguished.
Assumption 2 implies that the concentration in the deep region is effectively uniform. If diffusion
acts much faster than electrophoresis in the deep region, this assumption would be valid. The width of the
deep region is 500 nm in all of our experiments. Using 10-7 cm
2/s as D, a typical time constant for
diffusing across the deep region is on the order of 10-2 s. The time constant for crossing the deep region is
on the order of 10-1 s. The diffusion time is approximately an order of magnitude less than the convection
time. Therefore, the quick mixing assumption is generally valid.
Assumption 3 states that only forward movement is permitted. In our experiments, movement is
caused by a combination of electrophoresis and electroosmosis. The electric field lines are derived from
the electric potential, which satisfies Laplace's equation inside the channel. Furthermore, the electric field
lines have no perpendicular component with respect to the walls (assuming uncharged walls). For
electroosmotic flow at high buffer concentration, the flow profile is plug-like and effectively allows slip
very close to the wall. The flow profile can be computed from a stream function, which again obeys
Laplace's equation. Furthermore no fluid streamlines can be perpendicular to a wall. Because solutions to
Laplace's equation with set boundary conditions are unique, the solutions to the electric potential and
stream function are identical. Thus the electric field lines and fluid streamlines point in the same direction,
with the ratio of their magnitudes being constant. From this analysis, there are no locations where
electroosmotic
flow
overcomes
electrophoresis
to
make
the
DNA
move
backwards.
Chapter
5
Characterization of Electric Field Dependent
Nanofilter Separation Resolution
In previous experimental studies, researchers have shown that separation resolution is lost when the driving electric field is too strong for both the entropic trapping4 and Ogston-sieving regimes1 2. When we increase the electric field strength, molecules elute sooner and separation results are obtained faster, which is a favorable outcome. However, the separation resolution gets poorer with increasing field. Fu et al. measured and characterized the degradation in separation selectivity with increasing electric field, but it is not yet clear how the increased field will affect the dispersion of the bands. Potentially, less dispersion would result, since molecules spend less time in the device and therefore there have less time to diffuse. However, it is unclear whether the dispersion is purely caused by diffusion, considering the inherent barriers in the channel.
In this chapter we investigate the changes in separation resolution with increasing electric field strength. Specifically, we examine its effects on selectivity and dispersion, which directly affect resolution.
Experimental Setup
Please refer to the Materials and Methods chapter for generic information regarding the experiments. Table 5.1 summarizes experimental parameters specific to this set of experiments.
Device Dimensions
Shallow region depth (ds) Deep region depth (dd)
Buffer solution DNA Voltages 80 nm 320 nm TBE 5x (133 mM)
New England Biolabs 100 bp ladder Custom made voltage box connected to
Stanford Research Systems, Inc., High Voltage Power Supply, Model PS325/2500V-25W Table 5.1: Experimental setup for investigating electric-field effects on separation.
Reservoir # (See Figure 3.2 for reference)
I
0
0
15 20
0
0
320
0
15 4U
20x
Table 5.2: Voltage configurations. The voltages used to alter the electric field25, 30, 35, 40, 45, and 50 in these experiments.
are given by X, where X =
Results and Discussion
JUAJ
15v/cm 20 v/cm 25 v/cm 30 v/cmMa V
35 v/cm Sm Ps Ot4A~I
-1.517 4 -12000 -900 -60 - SMW17 -400 35 96 27 24 21 is 97 38 40 v/cm 0 1000 II.I*I* 2000 3000 4000 5000 800 Time (s) 7000 - 300 29 -200 25 - 10 48Figure 5.1: Left: Electropherograms illustrating the results obtained while altering the electric field. Note the convergence of the 500 to 1000 peaks as the field is increased, and hence the decrease in resolution. Additionally, note the faster elution times of all the peaks as the electric field is increased. Right: The manufacturer's specifications4 0of the DNA used.
Loading Injection Run
e
a, U, a, CI
2
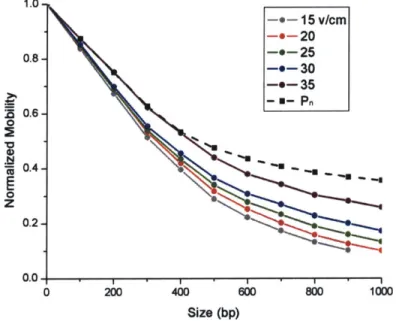
IAccording to the theory presented in Chapter 4, the velocity of the different DNA samples relative to an infinitesimally small DNA molecule is effectively given by the concentration ratio P,. Also, the relative mobilities are independent of the applied voltage.
The theoretical predictions and experimental results match qualitatively. However, the model does not predict the differences in relative mobility for different E-fields. Furthermore, significant differences exist, especially for DNA greater than 500 bp, and the predicted relative mobilities are in the high range of experimental values, Figure 5.2.
1.0--0-15 v/cm -e-20 0.8- -*-25 -9-30 -0-35 _~- U-Pn 0.6-0 cc 0.4--0 0.2-0.0. -0 200 400 600 800 1000 Size (bp)
Figure 5.2: Normalized mobility vs. size for different electric fields. The predicted mobility is
consistently at the top of the range of values.
As the electric field is increased, normalized DNA mobility in the entire size range increases. This increase is especially apparent for DNA larger than 500 bp. This increase in relative mobility may be caused by a reduction of the sieving properties of the constrictions: the higher electric field may be distorting the DNA shapes and forcefully dragging them through the constrictions. Less size-discrimination is the result.
Furthermore, the model, which is based on equilibrium partitioning models, may be limited in predicting the experimental results from an inherently dynamic (non-equilibrium) system. While it has been well-established that such equilibrium partitioning (free volume) models for electrophoresis work well, at least in the limit of low electric field, such a model is inherently an approximation and will break down with increasing electric field. One can give a simple scaling argument by comparing the timescales of diffusion vs. drift within the deep region. For a field value of 8.3 V/cm, the diffusion time and the drift time within the deep region of the channel are roughly the same'*. At this point, the assumptions of
Macrotransport Theory and the perfect mixing concept in particular start to fail.
1* The diffusivity of 1000 bp DNA is 7.45 x 10⁻⁸ cm2/s, according to Stellwagen et al.41 The "diffusion velocity"
over 0.5 pm is then 14.9 x 104 cm/s. The free solution mobility of DNA is 4.5 x 104 cm/s x cm/V, according to Stellwagen et al.3 For the two velocities to be equal, the electric field would be 3.3 V/cm in the deep region. Assuming a 1 to 4 ratio of shallow region depth to deep region depth, the electric field would be 13.2 V/cm in the shallow region. Assuming a 1:1 shallow region length to deep region length, the overall electric field would be 8.3
The relative mobility deviations for DNA greater than 500 bp can be partially explained by the
assumptions of the model. DNA was modeled as zero-diameter rods, whose length is determined by the
end-to-end distance derived from the Kratky-Porod worm-like chain model
38. The end-to-end length
increases sub-linearly with respect to the DNA contour length, so the rod diameter must grow. For this
reason, the partition coefficients for the longer DNA may be slightly inaccurate. A smaller partition
coefficient would result from a cylinder instead of rod model. Furthermore, the rods are modeled as rigid.
In practice, however, DNA with a contour length much greater than the persistence length is flexible.
Such flexibility will create an additional degree of freedom (e.g. conformational), which should be
considered to fully account for medium-sized DNA molecules.
More recently, Fu et al. demonstrated much better fitting using a model that separates the transit
time from the trapping time
41. The advantage of this theoretical model over Fu et al.'s model is the ability
of this macrotransport model to systematically model dispersion, at least to a first order approximation.
Since one of the primary goals of this work is to determine a model to analyze the dispersion behavior in
the system, we will use this model from this point on.
Standard Deviation and Dispersion in the Nanofilter Array
The theoretical standard deviations are calculated using the experimental elution times and fastest
velocities derived from experimental data. One assumption made in the theoretical standard deviation
calculation is that the peak width at the start of the separation region is a delta: the peak has zero width.
Impossible in practice, in our experiments the initial width is determined by the area of DNA we push
into the channel and the 10 s concentration procedure. Furthermore, some leaking occurs from the sides of
the injection T, as can be seen in Figure 7.3.
The injection T has a width of 40 pm, so a DNA profile of approximately this width goes into the
separation region when we start the run. Because the period of our traps is 1
im, this initial DNA
movement into the traps covers approximately 40 traps.
Rneroh 1 Rmurvor I
4 2 4 2
3 3
40 um
Figure
5.3:
Illustration of the DNA plug's finite width being injected into the separation region.
The 10-second concentration time before each experiment, which was used to increase the
fluorescence intensity level available for detection at the end of the channel, also increases the initial peak
width. The elution time is on the order of 1000 s, and we used 5000 traps in this experiment. Then the
velocity is on the order of
5
traps / s. Therefore, a 10 s load would inject molecules over approximately 50
traps.
Another effect is the leaking of DNA into the separation region upon application of separation
voltage conditions, as can be seen in Figure 7.3. Overall, the initial peak width is far from zero: referring
electrosmotic flow, the result is commonly seen in electrophoresis as well. From the data, the peak width
at the detector location is 300-400 filters wide. Therefore, the initial peak width is non-negligible.
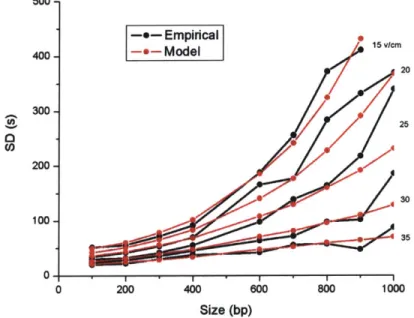
500--e- Empirical 400- Model 1" 20 300-25 200-30 100-35 0 200 400 800 800 1000 Size (bp)
Figure 5.4: Empirical and theoretical standard deviations vs. size. To account for the finite launch width,
we isolated the variance in position due to finite launch width for each data point by removing the
diffusion and trap residence variance from the empirical variance. For each voltage condition, we
averaged the finite launch width values and added this back to the theoretical diffusion and trap residence
variance. We then convert this variance in distance to the standard deviation in time by taking the square
root and dividing by the average velocity.
Resolution
The empirical resolution (in units of bp) was calculated from the elution time and standard
deviation data:
SDn+,time + SDme
R
=izep
n2 n+1,travel n,travel
To calculate the theoretical resolution, only the velocity of an infinitesimally small DNA for each electric
field was needed. All other parameters for the theoretical resolution were derived from this value,
specifically the elution time and standard deviation.
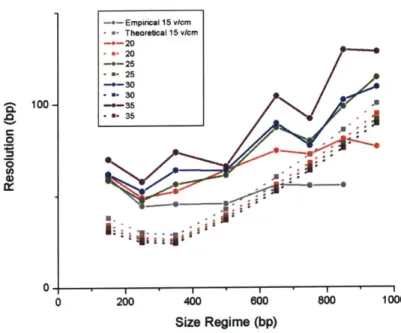
The theoretical resolution is approximately 15-25 bp smaller than the empirical resolution in the
range of 0-500 bp, Figure 5.5. This better predicted resolution is the result of assuming zero peak width at
the start of separation. One important conclusion from the theory is that resolution can increase
significantly by employing methods to decrease initial peak width.
In the range of 500-1000 bp, the theoretical resolution increases dramatically. This increase is a
result of the theoretical normalized mobility being inaccurate, as explained earlier.
-.- Empirical 15 vlcm - .- Theoretical15 4vcm --.- 20 - - 20 -.- 25 - .- 26 --- 30 - N- 30 a-U 35
'"i iiii
*1 * * I 0 200 400 800 Size Regime (bp) I I 800 1000Figure 5.5: Empirical and theoretical resolution vs. size.
Conclusion
In this section we characterized the selectivity and dispersion of a nanofilter array device
separating small DNA molecules. We applied a theoretical model based on Macrotransport Theory that roughly approximates these experimental results. The model predictions of normalized mobility match experimental data better for smaller-sized molecules. Since our goal is providing better separation for small biomolecules (such as proteins and carbohydrate) this model could provide useful insight.
Chapter 6
Characterization of Separation in Nanofilter
Arrays with Different Structural Parameters
One of the qualities of regular nanofilter arrays for molecular separation is their precisely constructed pore size, compared to the random pore sizes in a gel. We hypothesized that changing the depth of the deep region would provide a tradeoff between separation resolution and separation speed. In the extreme limit of the deep region being the same depth as the shallow region, theoretically no separation would occur (no entropic energy barrier), but all of the molecules would elute quickly. When the deep region depth is only slightly greater than the shallow region depth, some separation would occur, but resolution would be poor. On the other extreme, when the deep region is extremely deep, molecules that enter would have very little probability of exiting, resulting in very long elution times but potentially great separation, due to large differences in molecular free volume. Similarly, the ability to separate molecules in nanofilter devices depends critically on the constriction at the entrance of the shallow region. Intuitively, as the constriction is made smaller, the selectivity will increase and the resolution will improve.
In this chapter, we characterize the separation resolution and selectivity in devices which differ in terms of shallow and deep region depths. Such characterization has been previously done for entropic trapping separation of long DNA polymers4 2, but not for small molecule separation in the Ogston regime.