HAL Id: hal-00648976
https://hal.univ-brest.fr/hal-00648976
Submitted on 15 Dec 2011HAL is a multi-disciplinary open access
archive for the deposit and dissemination of sci-entific research documents, whether they are pub-lished or not. The documents may come from teaching and research institutions in France or abroad, or from public or private research centers.
L’archive ouverte pluridisciplinaire HAL, est destinée au dépôt et à la diffusion de documents scientifiques de niveau recherche, publiés ou non, émanant des établissements d’enseignement et de recherche français ou étrangers, des laboratoires publics ou privés.
of Pseudo-nitzschia multiseries, a toxic diatom
Aurélie Lelong, Helene Hegaret, Philippe Soudant
To cite this version:
Aurélie Lelong, Helene Hegaret, Philippe Soudant. Cell-based measurements to assess physiological status of Pseudo-nitzschia multiseries, a toxic diatom. Research in Microbiology, Elsevier, 2011, 162 (9), pp.969-981. �10.1016/j.resmic.2011.06.005�. �hal-00648976�
Cell-based measurements to assess physiological status of Pseudo-nitzschia multiseries, a 1
toxic diatom 2
3
Authors: Aurélie Lelonga, Hélène Hégareta, Philippe Soudanta* 4
5
a
LEMAR (UMR6539), IUEM, Place Nicolas Copernic, 29280 Plouzané, France 6 7 [email protected] 8 [email protected] 9
[email protected] *Correspondance and reprints 10
Abstract
11
Diatoms of the genus Pseudo-nitzschia are potentially toxic microalgae, which blooms can 12
trigger Amnesic Shellfish Poisoning. The purpose of this study was to test and adapt different 13
probes and procedures to assess the physiological status of Pseudo-nitzschia multiseries at the 14
cell-level, using flow cytometry. To perform these analyses, probes and procedures were first 15
optimized for concentration and incubation time. The percentage of dead Pseudo-nitzschia 16
cells, the metabolic activity of live cells and their intracellular lipid content were then 17
measured following a complete growth cycle. Additionally, chlorophyll autofluorescence and 18
efficiency of photosynthesis (quantum yield) were also monitored. The concentration and 19
viability of bacteria present in the medium were also assessed. Domoic acid (DA) was 20
quantified as well. Just before the exponential phase, cells exhibited a high metabolic activity, 21
but a low DA content. DA content per cell became most important at the beginning of the 22
exponential phase, when lipid storage was high, which provided a metabolic energy source, 23
and when they were surrounded with a high number of bacteria (high bacteria/P. multiseries 24
ratio). These physiological measurements tended to decrease during exponential phase and 25
until stationary phase, where P. multiseries cells did not content any DA nor stored any lipids 26
and started to die. 27
28
Keywords: flow cytometry; cell physiology; domoic acid; Pseudo-nitzschia multiseries; 29
bacteria; fluorescent probes 30
1.
Introduction31
Pseudo-nitzschia is a potentially toxic diatom genus with a worldwide distribution.
32
Some species are able to produce domoic acid (DA), an amnesic shellfish toxin leading to 33
food poisoning (Sierra-Beltrán et al., 1998) with a few cases of mortality to humans (Wright 34
et al., 1989), plus hundreds of sea bird (Sierra-Beltrán et al., 1997, Work et al., 1993) or 35
marine mammal mortalities (Scholin et al., 2000, Fire et al., 2009, de la Riva et al., 2009). 36
These poisonings often occurred following a bloom of Pseudo-nitzschia spp. The reasons 37
why these blooms occurred are poorly known. Some studies tried to create models to predict 38
there occurrence (Anderson et al., 2009, Lane et al., 2009), but the determinism of each 39
bloom seems different. Although factors enhancing or decreasing Pseudo-nitzschia cell 40
toxicity have been intensively studied, they still remain unclear. The study of Pseudo-41
nitzschia spp. physiology may help to understand why a bloom appears and becomes toxic.
42
Tools to assess the physiological status of microalgae are still fairly scarce. Photosynthetic 43
capacities of Pseudo-nitzschia spp. have been studied under different conditions (Ilyash et al., 44
2007, El-Sabaawi and Harrison, 2006) but do not provide enough information to assess cell 45
physiological status. Besides photosynthetic parameters and chlorophyll content, others 46
parameters have sometimes been studied in diatoms, e.g. silicification (Leblanc et al., 2005, 47
Kroger and Poulsen, 2008) or carbohydrate levels (De Philippis et al., 2002, Magaletti et al., 48
2004), but these are also insufficient to characterize the physiological processes occurring 49
inside the cell. It is therefore important to develop and then simultaneously measure several 50
different physiological parameters that may help to better understand the factors or status 51
associated with toxin production. 52
53
Assessment of cell physiology using fluorescent probes is a well-known subject in 54
medicine (Greenspan et al., 1985, Knot et al., 2005). Among the numerous fluorescent probes 55
available to assess cell physiology, some can be adapted to cultures of unicellular organisms. 56
They allow measurements of different physiological parameters such as metabolic activity 57
(with fluorescein diacetate, FDA), intracellular lipid content (Nile Red and BODIPY), total 58
DNA (SYBR Green) or mortality (SYTOX Green). Some of these probes have been used in 59
microalgal studies for several years but are often limited to microscopic observations or 60
spectrofluorimetric methods (Dempster and Sommerfeld, 1998, Okochi et al., 1999). The 61
latter allow measurement of an entire population, but differences between cells can not be 62
observed. Microscopic observations allow cell-by-cell analyses but are time consuming and 63
fluorescence quantification is difficult. On the other hand, flow cytometry (FCM) allows a 64
rapid analysis of the morphological and fluorescence characteristics of unicellular organisms 65
or individual cells. Even though FCM has a long history of routine use in medical analyses, 66
the first experiments to use FCM on microalgae were run only about thirty years ago (Olson 67
et al., 1983, Yentsch et al., 1983) and the approach still remains only a minor component for 68
measuring the physiology of phytoplankton. Some probes have already been tested on 69
microalgae using FCM, such as FDA (Dorsey et al., 1989, Brookes et al., 2000, Jochem, 70
1999), SYTOX Green (Veldhuis et al., 1997) or SYBR Green (Marie et al., 1997). Each of 71
these probes provides new insights for understanding how cells react under different 72
conditions, e.g. dark adaptation (Jochem, 1999), but they have never been applied 73
simultaneously to assess physiological status in a more comprehensive manner. 74
75
This study aims to assess the physiological status of Pseudo-nitzschia multiseries 76
using a set of cell-based measurements. To reach this objective, different measurements were 77
developed and adapted to this species (i) to better understand its physiology under culture 78
conditions and (ii) to seek the relationship between the production of DA and cell 79
physiological status. The morpho-functional characteristics of P. multiseries cells were 80
assessed by FCM, using different fluorescent probes (FDA, BODIPY 493/503, Nile Red, 81
SYTOX Green, SYBR Green and propidium iodide) and the measurement of chlorophyll 82
autofluorescence. Quantum yield (QY), which is a measurement of the efficiency of 83
photosynthesis, was measured using a pulse amplitude modulated (PAM) fluorometer. 84
Dissolved and particulate DA were measured on each culture using an ELISA assay. DA is a 85
secondary metabolite, thus supposed to be produced when cells have more energy than 86
necessary for the primary metabolism. Thus primary metabolism was assessed using FDA 87
and esterases activity. The availability of energy was assessed by measuring storage lipids, as 88
extra-energy is stored by microalgae under lipid form. The concentration of bacteria may 89
influence DA production by P. multiseries, as they are known to enhance DA production 90
(Bates et al., 1995). Chlorophyll and QY measurements allow knowing if the culture is 91
healthy and were completed by the measure of dead cells percentage. 92
2.
Materials and methods93
2.1. Cultures
94
Strain CCAP 1061/32 of Pseudo-nitzschia multiseries (isolated in 2007 in England) 95
was used for the experiments,. Cultures (n=6) were grown in sterilized f/2 medium (Guillard 96
and Hargraves, 1993) at 15.6°C (±0.2°C), and 131 ± 16 µmol photons m-2 s-1 (light:dark 97
photoperiod of 12:12 h). Seawater used for f/2 medium was first filtered at 0.22µm, to 98
eliminate any remaining bacteria (which was confirmed by flow cytometric measurements, as 99
described below) and then autoclaved. Cultures were xenic and grown without antibiotics. 100
Before each sampling, cultures were homogenized by gentle manual stirring. Almost all the 101
cells were present as single cells in our cultures; sometimes cells were forming 2 cells chains. 102
For the flow cytometry analysis, they were all considered as single cells. 103
104
2.2. Physiological measurements
105
Measurements were made with a FACScalibur flow cytometer (BD Biosciences, San 106
Jose, CA USA), using an argon blue laser (488 nm). Three fluorescence signals can be 107
detected by the flow cytometer: FL1 (green, 530 nm), FL2 (orange, 585 nm) and FL3 (red, 108
670 nm). Red fluorescence is linearly linked to the chlorophyll content of the cells and was 109
used as a discriminating characteristic to detect the microalgae (Fig. 1). Bacteria were 110
detected on the FL1 channel (Fig. 2), with different settings to those used for microalgae 111
analysis. Cell counts were estimated from the flow-rate measurement of the flow cytometer 112
(Marie et al., 1999) as all samples were run for 45 s. The flow rate from the FCM was 113
controlled every two days. Forward Scatter (FSC, light scattered less than 10 degrees) and 114
Side Scatter (SSC, light scattered at a 90 degree angle) were also measured. FSC is 115
commonly related to cell size and SSC to cell complexity. The same instrument settings were 116
used for the entire duration of the experiment to allow comparison between days. 117
118
Bacteria. Quantification of free-living bacteria in the P. multiseries culture and the
119
percentage of dead bacteria in the culture were assessed by adding SYBR Green I (Molecular 120
probes, Invitrogen, Eugene, Oregon, USA) at a final concentration of 1/10000 of the 121
commercial solution, and propidium iodide (PI, Sigma, St. Louis, MO, USA) at 10 µg ml-1 to 122
each sample. During analyses, aggregates of bacteria were taken into account with correction 123
according to aggregate size (Fig. 2). Bacterial counts were estimated as described for Pseudo-124
nitzschia cells, using FL1 as a discriminating characteristic (due to SYBR Green fluorescence
125
staining). 126
127
Mortality. To assess Pseudo-nitzschia cell mortality, we used a cell
membrane-128
impermeable dye, SYTOX Green (Molecular probes, Invitrogen, Eugene, Oregon, USA) 129
prepared at a working solution of 5 µM. A mix of live/dead cells was prepared to confirm 130
that SYTOX Green stained only dead cells (Veldhuis et al., 2001) and to calibrate the 131
measurement. Cells from a dead culture (killed by heating for 15 min at 100°C) were mixed 132
with those from a live culture to give a range of 0 to 100% dead cells (increments of 10%) 133
and stained with SYTOX Green at 0.1 µM (final concentration) for 30 min. The percentage 134
of measured dead cells (those stained with SYTOX Green) was then compared to the 135
theoretical percentage of dead cells present in the mixture. 136
137
Metabolic activity. To assess metabolic activity, esterase activity was measured using
138
fluorescein diacetate (FDA, Molecular probes, Invitrogen, Eugene, Oregon, USA). FDA is a 139
probe that is cleaved by esterases inside the cells, resulting in fluorescein accumulation over 140
time (Jochem, 1999). A 5 mg ml-1 stock solution of FDA was prepared by diluting the 141
commercial powder in DMSO. A fresh 300 µM working solution was prepared before each 142
experiment by adding stock solution directly into distilled water cooled on ice. The working 143
solution was kept in darkness and on ice during the experiment and was agitated to prevent 144
the formation of aggregates. 145
146
Lipids. To assess the intracellular lipid content, two probes were tested on P.
147
multiseries. A 10 mM stock solution of BODIPY 493/503
(4,4-difluoro-1,3,5,7,8-148
pentamethyl-4-bora-3a,4a-diaza-s-indacene, Molecular probes, Invitrogen, Eugene, Oregon, 149
USA) was made by diluting the commercial powder in DMSO. A 1 mM working solution 150
was then prepared by a 10-fold dilution of the stock solution in distilled water. A 1 mg ml-1 151
stock solution of Nile Red (NR, Sigma, St. Louis, MO, USA) was prepared by diluting 100-152
fold the commercial powder in acetone and then 10-fold in distilled water to obtain a working 153
solution of 0.1 mg ml-1. 154
155
Each of these measurements had to be optimized for P. multiseries. Thus, final probe 156
concentrations and incubation times were chosen following two rules: (i) the concentration 157
had to be as low as possible to avoid toxic effects of the probe itself (and of the DMSO 158
contained in stock solutions of the probes) and (ii) the staining had to be homogeneous (all of 159
the cells had to be stained or only the dead cells for SYTOX Green), relatively stable over 160
time and reproducible between analytical replicates. For each probe, fluorescence 161
measurements were performed every 5 min during 1 h on the FL1 (or FL2 for NR) channel of 162
the flow cytometer. Concentrations of 0.5, 1.0, 2.5 and 5.0 µg ml-1 were tested for NR; 1.0, 163
2.5, 5.0 and 10 µM for BODIPY; 0.75, 1.50 and 3.00 µM for FDA and 0.025, 0.05, 0.1 and 164
0.2 µM for SYTOX Green. 165
Quantum yield (QY), a measurement of the efficiency of photosynthesis, was 167
measured using an AquaPen-C AP-C 100 (Photo Systems Instruments,Czech Republic) pulse 168
amplitude modulated (PAM) fluorometer. QY = (Fm-F0)/Fm, where F0 and Fm are the
169
minimum and maximum fluorescence of cells, respectively, after 30 min of dark adaptation. 170
To ensure that there was no background fluorescence, P. multiseries supernatant and f/2 171
medium were used as blanks. 172
173
Domoic acid (DA) was quantified using the ASP ELISA kit (Biosense Laboratories, 174
Bergen, Norway), according to the manufacturer's protocol. Cultures (cells and supernatant) 175
were sonicated and filtered at 0.22 µm to measure total DA. Supernatant (culture filtered at 176
0.22 µm) was used to measure dissolved DA. Intracellular DA was measured by subtracting 177
dissolved DA to total DA. 178
179
2.3. Monitoring the physiology of P. multiseries over a growth cycle
180
Six P. multiseries cultures of the same strain were sampled every day from day 4 to 181
21. The following were assessed on each sampling day: P. multiseries morphology, 182
concentration and mortality, bacterial concentration and mortality, total and dissolved DA 183
concentrations, quantum yield, chlorophyll fluorescence, intracellular lipid content and 184
metabolic activity. Growth rate was measured during exponential phase following the 185
formula: µ (d-1) = ln(N1/N0)/Δt (in days). Fluorescence measurements were performed using 186
the optimal concentrations obtained in the previous experiments: 0.1 µM SYTOX Green, 3 187
µM FDA, 1 µg ml-1 Nile Red and 10 µM BODIPY. FDA measurements were performed 188
precisely after 6 min of incubation, and SYTOX Green and BODIPY measurements after 30 189
min. Bacteria were stained with SYBR Green and PI for 15 minutes. 190
191
2.4. Statistics
192
Results were analyzed statistically with simple regressions, One-Way ANOVA with 193
time as the main factor, as well as with principal component analysis (PCA) followed by a 194
factorial plan. For all statistical results, a probability of p<0.05 was considered significant. 195
Statistical analyses were performed using StatGraphics Plus (Manugistics, Inc, Rockville, 196
MD, USA). 197
3. Results
199
200
3.1. Optimization of probe concentration
201
Mortality. A 0.1 µM final concentration of SYTOX Green allowed a good distinction
202
between dead and live cells (Fig. 1). Incubation time was optimal at 30 min. The best 203
correlation (y=0.95x, R2 = 0.99, P<0.01) between the measured and theoretical percentages of 204
dead cells in the mixtures of dead/live P. multiseries was established at a SYTOX Green 205
concentration of 0.1 µM, which was therefore applied for the further analyses. 206
207
Bacteria. Free-living bacteria are able to form aggregates that can be distinguished
208
after SYBR Green staining (Fig. 2A). Each aggregates exhibited a fluorescence that was 209
equivalent to the fluorescence of one bacteria x number of bacteria in the aggregate. The 210
number of total free-living bacteria can thus be deduced and measurements of FSC and SSC 211
can be done for each aggregate size (Fig. 2B). 212
213
Metabolic activity. Concentrations of FDA lower than 3.0 µM exhibited a low
214
fluorescence, indicating that there was little accumulation of the probe (data not shown). At 215
3.0 µM, fluorescein accumulated within the cells (Fig. 3I), in a linear manner during the 15 216
first min (y=35.9x+133.1, R2 = 0.9964, p<0.001), and then reached a plateau (Fig. 4). For the 217
further analyses, fluorescein accumulation was measured after 6 min of staining within the 218
linear part of the curve. 219
220
Lipids. A final concentration of 10 µM BODIPY 493/503 and 1 µg ml-1 of Nile Red 221
(NR) allowed the best staining of all cells (one distinct population of cells, not a diffuse cloud 222
of cells, can be seen on the cytograms, data not shown). After 30 min, all cells were well 223
stained and the fluorescence was stable (Fig. 3B, C, E, F). 224
225
3.2. Monitoring of morpho-functional characteristics during P. multiseries growth
226
The exponential growth phase of P. multiseries started after a 7-d lag phase, giving a 227
growth rate of 0.24 ± 0.01 d-1, and then the stationary phase was reached after day 17 (Fig. 5). 228
A maximal concentration of ~8 x 10⁴ cells ml-1 was observed at days 17 and 19, after which 229
the cell concentration rapidly declined. 230
231
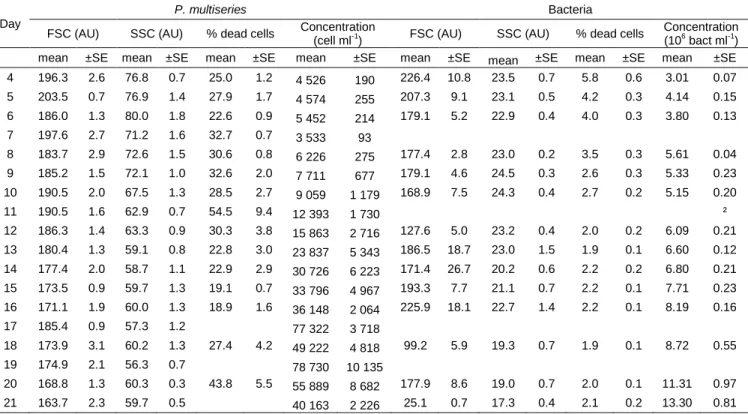
Bacteria within the P. multiseries culture started their exponential growth phase on 232
day 7 and were still growing steadily until the end of the experiment (Table 1), exhibiting a 233
growth rate of 0.07±0.01 d-1. The bacteria/P. multiseries cell ratio decreased during the 234
exponential phase of P. multiseries, remained stable between days 14 to 20, and then 235
increased again on the last day of the experiment, when P. multiseries numbers declined (Fig. 236
5, Table 1). Proportions of bacteria in aggregates of one, two or more cells did not change 237
with growth phases. The percentage of dead bacteria decreased between days 4 and 12 (from 238
5.8% ± 0.6 to 2.0% ± 0.2) and then remained stable between 1.9 and 2.5% until day 21 (Table 239
1). Values of FSC and SSC for the bacterial community (free-living bacteria that were not 240
forming aggregates) decreased steadily during the course of P. multiseries culture (Table 1). 241
242
The percentage of dead P. multiseries cells averaged 28% throughout the entire 243
experiment (Table 1) and decreased from 30.3% on day 12 to 18.9% at day 16, after which it 244
increased to 43.8% on day 20 (stationary phase). FSC values for P. multiseries continuously 245
decreased during the experiment, almost linearly with culture age (R2=0.76, p<0.01). SSC 246
values decreased until day 13 (mid-exponential phase) and became stable between day 13 and 247
the end of the experiment (Table 1). 248
249
Total DA in the P. multiseries culture, expressed as pg ml-1, increased steadily from 250
day 7 (200±21 pg ml-1) until day 14 (798±164 pg ml-1) during exponential growth. Total DA 251
in the culture then decreased sharply, reaching a concentration below 100 pg ml-1 on day 21. 252
Total DA content was highest on days 13 and 14, during the mid-exponential phase, and 253
decreased steadily after day 14, when it reached late-exponential phase and stationary phase 254
(Fig. 5). The amount of dissolved DA was low and remained constant throughout the culture, 255
from 41.3 (±2.9) pg ml-1 on day 6 to 103.0 (±7.3) pg ml-1 on day 12, representing 11 to 40 % 256
of total DA. 257
258
FL3 values (related to chlorophyll content) were measured on live cells, discriminated 259
from dead cells using SYTOX Green staining. FL3 values sharply decreased from day 4 to 6, 260
remained stable between days 6 (590±12) and 9 (593±10), and then slightly decreased from 261
day 9 to 20 (506±12), stationary phase, Fig. 6). Quantum yield (QY) values increased 262
between days 5 (0.46±0.01) and 8 (0.59±0.01), became relatively stable until day 14 263
(0.62±0.00), and then decreased in mid-exponential phase after day 14 (Fig. 6). Day 11 264
exhibited a significant decrease of both FL3 and QY. Supernatant and media did not exhibit 265
QY values or were below the detection threshold of the fluorometer. 266
267
The metabolic activity of the P. multiseries cells, as measured with the FDA assay 268
after 6 min of incubation, increased rapidly from day 6 to 7 and then just as rapidly decreased 269
after day 7, to values just below the initial level, on day 9 (Fig. 7). The percentage of stained 270
cells after 6 min of incubation increased between day 8 (72.5% ± 1.6) and 16 (87.9% ± 1.0) 271
and decreased on day 20 (74.7% ± 5.4). The percentages of live cells, as measured with the 272
SYTOX Green and FDA assays, were significantly correlated, even though the correlation 273
remained quite weak (R2=0.67 p<0.001, Fig. 7). 274
275
The amount of intracellular lipids, interpreted from BODIPY fluorescence, increased 276
between days 4 and 6, decreased from days 6 to 14 (during the exponential phase), stayed 277
stable until day 16, and finally increased during the stationary phase (Fig. 8). NR 278
fluorescence, the traditional indicator of lipid content, decreased between days 9 and 20, with 279
one higher fluorescence value on day 11 (Fig. 8). 280
281
PCA showed that DA content of cells (total DA) had coordinates really close to those 282
of Nile Red, SSC and bacteria/Pseudo-nitzschia ratio, knowing that components 1 and 2 283
explained 74 % of the variability (Fig. 9). FSC and BOPIDY uptake were also closely 284
correlated with these previous parameters, indicating that increased DA production was 285
associated with a higher intracellular lipid content. A factorial plan (Fig. 10) was developed 286
from the previous PCA, plotting the age of the P. multiseries culture, in exponential and 287
stationary phases from day 9 to 20. Days follow a consistent trend, from high component 1 288
and low component 2 (i.e. high lipid concentration, high DA content, high cell/bacteria ratio, 289
low esterases activity, ....) , towards lower component 1 and higher component 2 (i.e. high 290
esterases activity, low DA content and low lipid concentration, …). Day 20 was the only days 291
which did not follow this trend, on the extremities of the factorial plan (extremely low 292
components 1 and 2, i.e. driven mainly by the high P. multiseries mortality and high number 293
of bacteria). 294
4. Discussion
295
The first aim of this study was to test and optimize several methods and probes to 296
assess Pseudo-nitzschia physiological status. The percentage of cell mortality in the cultures 297
was determined using SYTOX Green, which only penetrates cells that have lost their 298
membrane integrity, and are thus considered as dead cells (Veldhuis et al., 1997). A final 299
concentration of 0.1 µM was optimal for staining P. multiseries dead cells and is in good 300
agreement with those found in the literature for other phytoplankton species (Veldhuis et al., 301
2001, Binet and Stauber, 2006, Ribalet et al., 2007, Miller-Morey and Van Dolah, 2004, 302
Lawrence et al., 2006). 303
304
Fluorescein diacetate (FDA) has previously been used to measure metabolic activity 305
(Jochem, 1999, Regel et al., 2002, Brookes et al., 2000) as well as viability of microalgae 306
(Lawrence et al., 2006, Dorsey et al., 1989, Jansen and Bathmann, 2007). It penetrates the 307
cells passively and once within the cell is hydrolyzed by non-specific esterases into 308
fluorescein and two acetate molecules. The more metabolically active the cells are, the more 309
esterases they produce, resulting in a greater amount of fluorescein accumulation within the 310
cells. The probe will not be cleaved within dead cells, as esterases are inactive. Moreover, if 311
the probe is hydrolyzed by any remaining esterases, the fluorescein will leak out of the cells, 312
as the membranes are permeable. Thus, unstained cells are considered as dead cells. In the 313
literature, measurement of fluorescein released from FDA inside the cells most often occurs 314
between 5 and 20 min of incubation (Jochem, 1999, Regel et al., 2002, Dorsey et al., 1989, 315
Jamers et al., 2009). FDA was only accumulated linearly during the first 15 to 20 min, as 316
previously observed by Gilbert et al. (1992). Accordingly, based on our results and supported 317
by the above publications, measurements were performed after 6 min of incubation. A final 318
concentration of 3 µM was optimal for this assay and is consistent with some publications 319
(Dorsey et al., 1989, Gilbert et al., 1992) but lower than others (Regel et al., 2002, Jamers et 320
al., 2009). Higher concentrations of FDA were not tested, as 3 µM provided satisfactory 321
staining and higher concentrations of FDA and DMSO may become toxic to the cells. 322
323
BODIPY 493/503 and Nile Red (NR) were tested to localize and quantify intracellular 324
lipids in P. multiseries cells. NR has been used traditionally to stain lipids of microalgae 325
(Cooksey et al., 1987), whereas this is the first time that BODIPY 493/503 has been used to 326
study microalgal lipids. NR fluorescence of microalgal lipids, measured by FCM, has been 327
shown to be linearly correlated to the lipid content of cells (de la Jara et al., 2003). Lipids of 328
P. multiseries, revealed by BODIPY and NR, were observed to form vacuoles inside the cells
329
(Fig. 3), and NR gave a lower fluorescence intensity than BODIPY. These vacuoles are likely 330
to contain reserve lipids, as BODIPY and NR are reported to stain neutral lipids (Gocze and 331
Freeman, 1994). Such vacuoles have previously been described within microalgae (Eltgroth 332
et al., 2005, Liu and Lin, 2001, Remias et al., 2009, Cooper et al., 2010), although lipid-333
staining BODIPY and NR did not reveal a specific distribution of these vesicles. Both 334
BODIPY and NR were used to quantify intracellular lipid contents by FCM, in the green 335
(FL1) and orange (FL2) channels respectively. In the present study, NR was used at a final 336
concentration of 1 µg ml-1, which is the same as used in previous studies on microalgae 337
(Chen et al., 2009, Chen et al., 2010, Liu et al., 2008, Huang et al., 2009, McGinnis et al., 338
1997). BODIPY was used at a final concentration of 10 µM. This concentration allowed the 339
detection of subtle variations in the intracellular lipid content of P. multiseries grown, for 340
example, in culture media with or without nitrate (data not shown), whereas lower 341
concentrations did not. Higher concentrations were not tested, as 10 µM provided satisfying 342
staining and higher concentrations of BODIPY and DMSO may become toxic to the cells. 343
The concentration used was 100 times higher than the one used for fungus (Saito et al., 2004) 344
but in agreement with those on human muscle (Wolins et al., 2001) and lower than the one 345
used on amoeba (Kosta et al., 2004). 346
347
The development of these methods allowed the physiological status of P. multiseries 348
cells to be monitored over a complete growth cycle. The lag phase of P. multiseries lasted 7 349
days, which is long compared to other studies on the same species, but not the same strain 350
(Thessen et al., 2009, Lundholm et al., 2004, Kudela et al., 2003, Kotaki et al., 1999, Bates et 351
al., 2000). The P. multiseries growth rate (0.24 ± 0.01 d-1) was lower than those previously 352
reported in the literature (Thessen et al., 2009, Lundholm et al., 2004, Kudela et al., 2003, 353
Kotaki et al., 1999, Bates et al., 2000). This might be explained by the age of the isolate 354
(isolated in 2007, more than 2 years ago) and the short cell length (~20 µm); Amato et al. 355
(2005) reported a slight decrease in the growth rate of P. delicatissima with a decrease in 356
apical cell length. Culture conditions were the same or close to studies using Pseudo-357
nitzschia cultures (media, irradiance and temperature) and thus could not explain differences
358
in growth rates. 359
360
FSC and SSC values of P. multiseries decreased during the entire experiment, by 17% 361
and 22%, respectively. FSC and SSC result from the diffraction of the laser by the cell 362
surface. Their decrease in P. multiseries may be related to changes in external morphology, 363
cell size and internal cell complexity. During growth, cells undergo asexual reproduction and 364
thus decrease in cell length. FSC and SSC values were, however, similar to values measured 365
over the last year (data not shown) at both the beginning (during the lag phase) and end of 366
experiments. This indicates that FSC and SSC values changed very little over the last year, 367
possibly because this strain isolated in 2007 was already quite old. Inoculation of P. 368
multiseries into a new medium resulted in a return to high FSC and SSC values. Because
diatoms cannot increase their cell size, the changes in FSC and SSC values are more likely 370
related to both surface membrane and cytoplasmic modifications than cell size modifications, 371
thus modifying the diffraction of the laser. This hypothesis is based on the correlation 372
between SSC and both BODIPY and NR fluorescences (R2 = 0.77 and 0.64, respectively, at 373
p<0.01). It may possible that when cells had a lot of lipid vesicles within their cytoplasm, this 374
increased cell complexity was reflected by the changes in FSC and SSC values. 375
376
Bacterial community counts and morphological changes within Pseudo-nitzschia 377
cultures were estimated for the first time by FCM. In this microalgal culture, the growth rate 378
of the bacteria was 0.07 d-1, which remained constant over the course of the experiment; the 379
bacteria did not reach stationary phase during the 20 days of the experiment. This growth rate 380
is in the lower range of bacteria grown in adapted culture media, that can grow from 0.01 h-1 381
(Kemp et al., 1993) to 1.5 h-1 (Makino et al., 2003). These differences may be due to the 382
competition with P. multiseries for some nutrients or the fact that they may not have all the 383
nutrients they need and that are usually added in agar plates. The highest bacteria/P. 384
multiseries ratios were measured during the lag phase (day 4 to 7) and at the beginning of the
385
exponential phase (day 7 and 8). Bacteria measured are the free-living bacteria contained in 386
the medium; however, some bacteria can also be attached directly to P. multiseries cells 387
(Kaczmarska et al., 2005), these attached bacteria were not taken into account (their signal 388
was confounded within these of P. multiseries). The decrease in the number of bacteria per P. 389
multiseries cell during the exponential phase of P. multiseries (from 922 to 180) is explained
390
by a faster growth rate of P. multiseries compared to bacteria. The increase in the bacteria/P. 391
multiseries ratio during the senescent phase of P. multiseries may be a result of bacteria
392
taking advantage of organic materials released from dead P. multiseries cells (Kaczmarska et 393
al., 2005). Stewart et al. (1997) found between 7 and 10 bacteria per P. multiseries cell, 394
which is about 20 to 80 times lower than our values. This difference may be explained by (i) 395
a high residual percentage of dead P. multiseries cells present during the entire experiment, or 396
(ii) the age of our isolate, which provided sufficient time (two years) for the bacterial 397
community to adapt to the culture conditions of P. multiseries. Differences found in bacterial 398
communities over time in culture, for non-toxic Pseudo-nitzschia pungens support this 399
possibility (Sapp et al., 2007), but Wrabel and Rocap (2007) found no shifts in bacterial 400
assemblages in a Pseudo-nitzschia culture over its initial nine months (Wrabel and Rocap, 401
2007). Nevertheless, shift in the bacterial community may appear after 9 months in culture. 402
FSC and SSC values of the bacterial community decreased during the experiment. These 403
values are related to size and complexity of bacterial cells. This may reflect a shift in species 404
composition of the bacterial community to smaller bacteria or a decrease in bacterial cell size. 405
Between 1.9 and 5.8% of the bacteria in our cultures were dead, with the highest percentage 406
at day 4. The percentage of dead bacteria remained quite low (1.9-2.7%) until the end of the 407
experiment, as they were still in exponential phase. 408
409
Values of FL3 (related to the chlorophyll content) decreased slightly during the entire 410
experiment, with a greatest decrease between days 4 and 6. The chlorophyll content of P. 411
multiseries decreased only slightly during the exponential phase. Nevertheless, cells with
412
more chlorophyll may not necessarily have the most efficient photosynthesis. Indeed, QY, a 413
measure of the efficiency of photosynthesis, was not well correlated to FL3 values, as QY 414
decreased during the stationary phase when FL3 remained high. QY increased at the 415
beginning of the exponential phase and remained high during the remaining exponential 416
phase, with cells having an efficient photosynthesis with a lot of energy produced. Such an 417
increase of QY during the exponential phase has been shown for other microalgal species, 418
e.g. Symbiodinium sp. (Rodriguez-Roman and Iglesias-Prieto, 2005), and is currently used as 419
a measure of algal culture health. As the QY value is not affected by the percentage of dead 420
cells in the cultures (Franklin et al., 2009), it can be speculated that at the end of the 421
stationary phase, live P. multiseries cells still contained high amounts of chlorophyll, but with 422
a poor photosynthetic efficiency. 423
424
During the entire experiment, the percentage of dead P. multiseries cells was 425
relatively high, ranging from 19% to 54%. Nevertheless, our cultures reached a maximum 426
cell concentration of 8 x 10⁴ cells ml-1, which is consistent with some previous studies 427
(Mengelt and Prézelin, 2002, Bates and Richard, 1996, Lewis et al., 1993, Kotaki et al., 1999) 428
but lower than the results of the majority of the studies (Bates and Richard, 1996, Kotaki et 429
al., 1999, Mengelt and Prézelin, 2002), suggesting that our cultures were not in good health, 430
which also explains the low growth rate and the high percentage of dead cells. Generally, in 431
healthy and young cultures of Pseudo-nitzschia sp., the percentage of dead cells has been 432
described under 5% (Mengelt and Prézelin, 2002). The increase in dead cells at the end of the 433
experiment may be due to the limitations in nutrients and associated with the beginning of the 434
stationary phase. Such a consistently high percentage of dead cells in the culture may be 435
explained by the age of the isolate. The percentage of dead cells assessed with FDA was 436
significantly but not perfectly correlated (R2 = 0.67, p<0.01) to those obtained with SYTOX 437
Green and appeared slightly lower than when measured with SYTOX Green. Cells can have a 438
compromised cell membrane, and be considered as dead when assessed with SYTOX Green, 439
but they may still have active esterases. These false-positive cells (dead but stained with 440
FDA) have been shown to represent 1.6% of total cells of Chlamydomonas reinhardtii 441
(Jamers et al., 2009). Such differences between SYTOX Green and FDA have also been 442
previously observed in Heterosigma akashiwo (Lawrence et al., 2006). Using these two 443
probes not only provides the percentage of dead versus live cells but also provides an 444
indication of the way cells are dying. In our cultures, cells most likely died by loss of 445
membrane integrity prior to inactivation of esterases, which was also observed by Lawrence 446
et al. (2006) in cultures of H. akashiwo. Thus, SYTOX Green and FDA provide useful 447
information and could both be used in physiological measurements. 448
449
Lipid-related fluorescence assessed with BODIPY was high during the lag phase, 450
indicating that the cells contained energy stored as neutral lipids. BODIPY fluorescence 451
decreased during the entire exponential phase, suggesting that cells were using these stored 452
lipids to grow, in addition to the energy produced by photosynthesis. Cells stopped growing 453
at the stationary phase, and energy was once again stored as lipids, as evidenced by the 454
increase in BODIPY fluorescence. Although no data are available between days 4 and 6, NR 455
fluorescence decreased during the remainder of the experiment, with the exception of a high 456
value on day 11. There was a weak correlation between BODIPY and NR fluorescence 457
during the exponential phase (between days 7 and 18; R2 = 0.65, p<0.01). During the 458
stationary phase, however, BODIPY fluorescence is higher than that of NR, which confirms 459
that these two probes may not actually stain the same compounds during that period. This 460
emphasises the importance of using both lipid probes. These differences may be explained by 461
the chemical properties of the two probes. BODIPY 493/503 stains intracellular lipids more 462
effectively than NR, with a higher sensitivity and lower background (Kacmar et al., 2006). 463
BODIPY 493/503 also stains intracellular lipid droplets more specifically than does NR 464
(Gocze and Freeman, 1994). NR is an uncharged hydrophobic molecule whose fluorescence 465
is strongly influenced by the polarity of its environment. As well as lipids, NR interacts with 466
many, but not all, native proteins (Sackett and Wolff, 1987) and can undergo changes in 467
fluorescence intensity when it binds to certain proteins (Brown et al., 1995). The fact that NR 468
binds proteins may explain its lower sensitivity to small variations in lipid content, as 469
measured by BODIPY. This is especially evident during the stationary phase, when 470
differences in lipid staining were observed between the two probes. Thus, the combined use 471
of BODIPY and NR probes is of interest as they may reflect different physiological changes. 472
473
The maximum of total DA per cell was observed on days 9 and 10, in early 474
exponential phase, and it decreased during the remainder of the exponential phase, and the 475
stationary phase. The same pattern of DA production has been observed for Pseudo-nitzschia 476
calliantha (Besiktepe et al., 2008) and Pseudo-nitzschia pseudodelicatissima (Pan et al.,
477
2001), where the maximum DA production was observed during the early exponential phase. 478
All studies of P. multiseries, however, have found a maximum DA production during the 479
stationary phase (Kotaki et al., 1999, Bates et al., 2000, Lewis et al., 1993, Osada and 480
Stewart, 1997). Maybe old cultures of P. multiseries exhibit a shift of DA production from 481
stationary phase to early exponential phase, which is difficult to prove, as one strain has 482
never been studied throughout its lifetime in laboratory. Moreover, strains exhibiting DA 483
production during early exponential phase seem to have a lower DA content per cell 484
(Besiktepe et al., 2008, Pan et al., 2001). In our study, total cellular DA varied between 0 and 485
192 fg cell-1, which is low compared to previous studies on P. multiseries, where DA attained 486
1.2 to 45 pg cell-1 (Bates et al., 2000, Thessen et al., 2009). Our values are more consistent 487
with those of P. calliantha (Álvarez et al., 2009) or P. pseudodelicatissima (Pan et al., 2001), 488
which had a maximum toxicity of 10 and 36 fg cell-1, respectively, but these species have a 489
smaller cell volume. Our strain of P. multiseries was really short (around 20 µm length here, 490
whereas cells can be 100 µm long just after sexual reproduction, which may explain the low 491
values of DA it produced. DA intracellular content started to decrease from day 11 to the end 492
of the stationary phase. This decrease of DA may also coincide with a physiological stress. 493
Unfortunately, bacteria were not measured that day. Nevertheless, day 11 exhibited surprising 494
values of NR, FL3 and QY (i.e. out of the trend). Cells might have undergone a stress, with 495
loss of chlorophyll and thus decreased QY, thus energy was stored under lipid form and DA 496
production was stopped. Dissolved DA was particularly low but remained constant over time, 497
with cells excreting 11 to 40 % of their total DA. This low DA release may be due to the age 498
of the strain, isolated in 2007, and its consequent smaller size. 499
500
DA is a secondary metabolite and is thus believed to be produced when cells have 501
excess energy that is not used for primary metabolism (Bates, 1998). Meanwhile, extra 502
energy is stored as lipids when cells are not able to use it for primary metabolism. In this 503
study, the measure of FDA provided information regarding primary metabolism and QY 504
(photosynthetic efficiency) was measured to estimate the production of energy. There was no 505
clear relationship between DA production (total or dissolved) and QY or FDA hydrolysis. 506
Conversely, a positive correlation was observed between total DA content and NR after PCA 507
analysis (Fig. 9). Cells of P. multiseries seemed to produce more DA when they had more 508
lipids, thus more available stored energy, which is in agreement with some studies (Whyte et 509
al., 1995) but not all (Pan et al., 1996). Indeed, Pan et al. (1996) made the hypothesis that DA 510
and lipid synthesis shared some precursors as Acetyl-CoA, so when DA is produced, lipids 511
can not be stored. Bacteria are also known to play a role in DA production, by enhancing DA 512
production through unknown mechanisms (Bates et al., 1995, Stewart et al., 1997). In this 513
study, the ratio of bacteria per P. multiseries cell was also weakly correlated to DA content, 514
as the variable coordinates are quite close in the PCA analysis (R²=0.49, p<0.001, Fig. 9). 515
Cells seemed to produce more DA when more bacteria per P. multiseries cell were present in 516
the culture, possibly indicating that more DA was produced either when competition with 517
bacteria was greater or if bacteria produced toxin-enhancing compounds. FSC and BOPIDY 518
uptake were also closely correlated with DA content, SSC, NR and ratio bacteria/Pseudo-519
nitzschia, indicating that increased DA content is associated with a higher intracellular lipid
content. This lipid increase can cause an increase in the amount and/or the size of lipid 521
vacuoles within the cells, which could also explain the increase observed in FSC and SSC of 522
the P. multiseries cells. A factorial plan (Fig. 10) was developed from the previous PCA, 523
which plots the incubation time of the P. multiseries culture, from day 9 to 20 (values 524
included in the previous PCA). The position of the days included on this factorial plan clearly 525
demonstrates and summarizes our findings: the gradual and continuous shift of the culture 526
from low algal concentration, high bacteria/algal ratio, large SSC, high lipid and DA content 527
in early stationary phase, towards increasing concentrations, reaching a maximum at the end 528
of the exponential phase, to finally showing a high percentage of dead algal cells and bacteria 529
in late stationary phase. 530
531
FCM has been previously used on microalgae, mainly to cell count or measure of only 532
one physiological parameter per experiment. Here, we developed a set of physiological 533
measurements, which provides a more complete description of the physiological status of the 534
microalgae. This technique has been applied to one species of Pseudo-nitzschia but can be 535
broadened to other microalgal species, whether or not they are toxic or diatoms. Developing 536
cell-based physiological measurements with FCM will help to further our understanding of 537
phytoplankton physiology and its responses to environmental changes, both biotic and 538
abiotic. 539
Acknowledgements
541
The authors would like to thank S.S. Bates for his constructive comments and English 542
corrections. This work was supported by the national program EC2CO MicrobiEN, the 543
“Région Bretagne” and the French ministry of research (MENRT grant). 544
References
546
547
Álvarez, G., Uribe, E., Quijano-Scheggia, S., López-Rivera, A., Mariño, C., Blanco, J., 2009. 548
Domoic acid production by Pseudo-nitzschia australis and Pseudo-nitzschia calliantha 549
isolated from North Chile. Harmful Algae.8,938-945. 550
Anderson, C. R., Siegel, D. A., Kudela, R. M., Brzezinski, M. A., 2009. Empirical models of 551
toxigenic Pseudo-nitzschia blooms: Potential use as a remote detection tool in the Santa 552
Barbara Channel. Harmful Algae.8,478-492. 553
Bates, S. S., (1998) Ecophysiology and metabolism of ASP toxin production. In: 554
Physiological ecology of harmful algal blooms. D. M. Anderson, A. D. Cembella and G. M. 555
Hallegraeff (eds). Springer-Verlag, Heidelberg, pp. 405-426. 556
Bates, S. S., Douglas, D. J., Doucette, G. J., Leger, C., 1995. Enhancement of domoic acid 557
production by reintroducing bacteria to axenic cultures of the diatom Pseudo-nitzschia 558
multiseries. Natural Toxins.3,428-435.
559
Bates, S. S., Douglas, D. J., Doucette, G. J., Léger, C., 1995. Enhancement of domoic acid 560
production by reintroducing bacteria to axenic cultures of the diatom Pseudo-nitzschia 561
multiseries. Natural Toxins.3,428-435.
562
Bates, S. S., Leger, C., Satchwell, M., Boyer, G. L., (2000) The effects of iron on domoic 563
acid production by Pseudo-nitzschia multiseries. In: 9th International Conference on Harmful 564
Algal Blooms. G. A. Hallegraeff, S. I. Blackburn, C. J. Bolch and R. J. Lewis (eds). Hobart, 565
Tasmania: Intergov. Oceanogr. Comm., Paris, pp. 320–323. 566
Bates, S. S., Richard, J., (1996) Domoic acid production and cell division by P. multiseries in 567
relation to a light: dark cycle in silicate-limited chemostat culture. In: 5th Canadian 568
Workshop on Harmful Marine Algae. . Canadian Technical Report of Fisheries and Aquatic 569
Sciences, pp. 140-143. 570
Besiktepe, S., Ryabushko, L., Ediger, D., Yimaz, D., Zenginer, A., Ryabushko, V., Lee, R., 571
2008. Domoic acid production by Pseudo-nitzschia calliantha Lundholm, Moestrup et Hasle 572
(bacillariophyta) isolated from the Black Sea. Harmful Algae.7,438-442. 573
Binet, M. T., Stauber, J. L., 2006. Rapid flow cytometric method for the assessment of toxic 574
dinoflagellate cyst viability. Marine Environmental Research.62,247-260. 575
Brookes, J. D., Geary, S. M., Ganf, G. G., Burch, M. D., 2000. Use of FDA and flow 576
cytometry to assess metabolic activity as an indicator of nutrient status in phytoplankton. 577
Marine and Freshwater Research.51,817-823. 578
Brown, M. B., Miller, J. N., Seare, N. J., 1995. An investigation of the use of Nile Red as a 579
long-wavelength fluorescent probe for the study of alpha(1)-acid glycoprotein drug 580
interactions. Journal of Pharmaceutical and Biomedical Analysis.13,1011-1017. 581
Chen, W., Sommerfeld, M., Hu, Q., 2010. Microwave-assisted Nile red method for in vivo 582
quantification of neutral lipids in microalgae. Bioresource Technology.In Press, Corrected 583
Proof. 584
Chen, W., Zhang, C., Song, L., Sommerfeld, M., Hu, Q., 2009. A high throughput Nile red 585
method for quantitative measurement of neutral lipids in microalgae. Journal of 586
Microbiological Methods.77,41-47. 587
Cooksey, K. E., Guckert, J. B., Williams, S. A., Callis, P. R., 1987. Fluorometric 588
determination of the neutral lipid content of microalgal cells using Nile Red. Journal of 589
Microbiological Methods.6,333-345. 590
Cooper, M. S., Hardin, W. R., Petersen, T. W., Cattolico, R. A., 2010. Visualizing "green oil" 591
in live algal cells. Journal of Bioscience and Bioengineering.109,198-201. 592
de la Jara, A., Mendoza, H., Martel, A., Molina, C., Nordstron, L., de la Rosa, V., Diaz, R., 593
2003. Flow cytometric determination of lipid content in a marine dinoflagellate, 594
Crypthecodinium cohnii. Journal of Applied Phycology.15,433-438.
595
de la Riva, G. T., Johnson, C. K., Gulland, F. M. D., Langlois, G. W., Heyning, J. E., Rowles, 596
T. K., Mazet, J. A. K., 2009. Association of an unusual marine mammal mortality event with 597
Pseudo-nitzschia spp. blooms along the southern California coastline. Journal of Wildlife
598
Diseases.45,109-121. 599
De Philippis, R., Sili, C., Faraloni, C., Vincenzini, M., 2002. Occurrence and significance of 600
exopolysaccharide-producing cyanobacteria in the benthic mucilaginous aggregates of the 601
Tyrrhenian Sea (Tuscan Archipelago). Annals of Microbiology.52,1-11. 602
Dempster, T. A., Sommerfeld, M. R., 1998. Effects of environmental conditions on growth 603
and lipid accumulation in Nitzschia communis (Bacillariophyceae). Journal of 604
Phycology.34,712-721. 605
Dorsey, J., Yentsch, C. M., Mayo, S., McKenna, C., 1989. Rapid analytical technique for the 606
assessment of cell metabolic-activity in marine microalgae. Cytometry.10,622-628. 607
El-Sabaawi, R., Harrison, P. J., 2006. Interactive effects of irradiance and temperature on the 608
photosynthetic physiology of the pennate diatom Pseudo-nitzschia granii (Bacillariophyceae) 609
from the northeast subarctic Pacific. Journal of Phycology.42,778-785. 610
Eltgroth, M. L., Watwood, R. L., Wolfe, G. V., 2005. Production and cellular localization of 611
neutral long-chain lipids in the haptophyte algae Isochrysis galbana and Emiliania huxleyi. 612
Journal of Phycology.41,1000-1009. 613
Fire, S. E., Wang, Z., Leighfield, T. A., Morton, S. L., McFee, W. E., McLellan, W. A., 614
Litaker, R. W., Tester, P. A., et al., 2009. Domoic acid exposure in pygmy and dwarf sperm 615
whales (Kogia spp.) from southeastern and mid-Atlantic U.S. waters. Harmful Algae.8,658-616
664. 617
Franklin, D. J., Choi, C. J., Hughes, C., Malin, G., Berges, J. A., 2009. Effect of dead 618
phytoplankton cells on the apparent efficiency of photosystem II. Marine Ecology-Progress 619
Series.382,35-40. 620
Gilbert, F., Galgani, F., Cadiou, Y., 1992. Rapid assessment of metabolic activity in marine 621
microalgae - Application in ecotoxicological tests and evaluation of water quality. Marine 622
Biology.112,199-205. 623
Gocze, P. M., Freeman, D. A., 1994. Factors underlying the variability of lipid droplet 624
fluorescence in MA-10 leydig tumor cells. Cytometry.17,151-158. 625
Greenspan, P., Mayer, E. P., Fowler, S. D., 1985. Nile red: a selective fluorescent stain for 626
intracellular lipid droplets. Journal of Cell Biology.100,965-973. 627
Guillard, R. R. L., Hargraves, P. E., 1993. Stichochrysis immobilis is a diatom, not a 628
chrysophyte. Phycologia.32,234-236. 629
Huang, G.-H., Chen, G., Chen, F., 2009. Rapid screening method for lipid production in alga 630
based on Nile red fluorescence. Biomass and Bioenergy.33,1386-1392. 631
Ilyash, L. V., Belevich, T. A., Ulanova, A. Y., Matorin, D. N., 2007. Fluorescence parameters 632
of marine plankton algae at the assimilation of organic nitrogen. Moscow University 633
Biological Sciences Bulletin.62,111-116. 634
Jamers, A., Lenjou, M., Deraedt, P., Van Bockstaele, D., Blust, R., de Coen, W., 2009. Flow 635
cytometric analysis of the cadmium-exposed green alga Chlamydomonas reinhardtii 636
(Chlorophyceae). European Journal of Phycology.44,541-550. 637
Jansen, S., Bathmann, U., 2007. Algae viability within copepod faecal pellets: evidence from 638
microscopic examinations. Marine Ecology-Progress Series.337,145-153. 639
Jochem, F. J., 1999. Dark survival strategies in marine phytoplankton assessed by cytometric 640
measurement of metabolic activity with fluorescein diacetate. Marine Biology.135,721-728. 641
Kacmar, J., Carlson, R., Balogh, S. J., Srienc, F., 2006. Staining and quantification of poly-3-642
hydroxybutyrate in Saccharomyces cerevisiae and Cupriavidus necator cell populations 643
using automated flow cytometry. Cytometry Part A.69A,27-35. 644
Kaczmarska, I., Ehrman, J. M., Bates, S. S., Green, D. H., Léger, C., Harris, J., 2005. 645
Diversity and distribution of epibiotic bacteria on Pseudo-nitzschia multiseries 646
(Bacillariophyceae) in culture, and comparison with those on diatoms in native seawater. 647
Harmful Algae.4,725-741. 648
Kemp, P. F., Lee, S., Laroche, J., 1993. Estimating the growth rate of slowly growing marine 649
bacteria from Rna content. Applied and Environmental Microbiology.59,2594-2601. 650
Knot, H. J., Laher, I., Sobie, E. A., Guatimosim, S., Gomez-Viquez, L., Hartmann, H., Song, 651
L. S., Lederer, W. J., et al., 2005. Twenty years of calcium imaging: Cell physiology to dye 652
for. Molecular Interventions.5,112-127. 653
Kosta, A., Roisin-Bouffay, C., Luciani, M. F., Otto, G. P., Kessin, R. H., Golstein, P., 2004. 654
Autophagy gene disruption reveals a non-vacuolar cell death pathway in Dictyostelium. 655
Journal of Biological Chemistry.279,48404-48409. 656
Kotaki, Y., Koike, K., Sato, S., Ogata, T., Fukuyo, Y., Kodama, M., 1999. Confirmation of 657
domoic acid production of Pseudo-nitzschia multiseries isolated from Ofunato Bay, Japan. 658
Toxicon.37,677-682. 659
Kroger, N., Poulsen, N., 2008. Diatoms-From cell wall biogenesis to nanotechnology. Annual 660
Review of Genetics.42,83-107. 661
Kudela, R., Roberts, A., Armstrong, M., (2003) Laboratory analyses of nutrient stress and 662
toxin production in Pseudo-nitzschia spp. from Monterey Bay, California. In: Harmful Algae 663
2002. K. A. Steidinger, J. H. Landsberg, C. R. Tomas and V. G.A. (eds). Florida and Wildlife 664
Conservation Commission, Florida Institute of Oceanography, and Intergovernmental 665
Oceanographic Commission of UNESCO, pp. 136–138. 666
Lane, J. Q., Raimondi, P. T., Kudela, R. M., 2009. Development of a logistic regression 667
model for the prediction of toxigenic Pseudo-nitzschia blooms in Monterey Bay, California. 668
Marine Ecology-Progress Series.383,37-51. 669
Lawrence, J. E., Brussaard, C. P. D., Suttle, C. A., 2006. Virus-specific responses of 670
Heterosigma akashiwo to infection. Applied and Environmental Microbiology.72,7829-7834.
671
Leblanc, K., Hare, C. E., Boyd, P. W., Bruland, K. W., Sohst, B., Pickmere, S., Lohan, M. C., 672
Buck, K., et al., 2005. Fe and Zn effects on the Si cycle and diatom community structure in 673
two contrasting high and low-silicate HNLC areas. Deep-Sea Research Part I-Oceanographic 674
Research Papers.52,1842-1864. 675
Lewis, N. I., Bates, S. S., McLachlan, J. L., Smith, J. C., (1993) Temperature effects on 676
growth, domoic acid production, and morphology of the diatom Nitzschia pungens f. 677
multiseries. In: Toxic Phytoplankton Blooms in the Sea. T. J. Smayda and Y. Shimizu (eds).
678
Amsterdam (Netherlands): Elsevier Science Publishers B.V., pp. 601-606. 679
Liu, C. P., Lin, L. P., 2001. Ultrastructural study and lipid formation of Isochrysis sp 680
CCMP1324. Botanical Bulletin of Academia Sinica.42,207-214. 681
Liu, Z.-Y., Wang, G.-C., Zhou, B.-C., 2008. Effect of iron on growth and lipid accumulation 682
in Chlorella vulgaris. Bioresource Technology.99,4717-4722. 683
Lundholm, N., Hansen, P. J., Kotaki, Y., 2004. Effect of pH on growth and domoic acid 684
production by potentially toxic diatoms of the genera Pseudo-nitzschia and Nitzschia. Marine 685
Ecology-Progress Series.273,1-15. 686
Magaletti, E., Urbani, R., Sist, P., Ferrari, C. R., Cicero, A. M., 2004. Abundance and 687
chemical characterization of extracellular carbohydrates released by the marine diatom 688
Cylindrotheca fusiformis under N- and P-limitation. European Journal of
Phycology.39,133-689
142. 690
Makino, W., Cotner, J. B., Sterner, R. W., Elser, J. J., 2003. Are bacteria more like plants or 691
animals? Growth rate and resource dependence of bacterial C : N : P stoichiometry. 692
Functional Ecology.17,121-130. 693
Marie, D., Partensky, F., Jacquet, S., Vaulot, D., 1997. Enumeration and cell cycle analysis of 694
natural populations of marine picoplankton by flow cytometry using the nucleic acid stain 695
SYBR Green I. Applied and Environmental Microbiology.63,186. 696
Marie, D., Partensky, F., Vaulot, D., Brussaard, C., 1999. Enumeration of phytoplankton, 697
bacteria, and viruses in marine samples. Current Protocols in Cytometry.11.11.11-11.11.15. 698
McGinnis, K. M., Dempster, T. A., Sommerfeld, M. R., 1997. Characterization of the growth 699
and lipid content of the diatom Chaetoceros muelleri. Journal of Applied Phycology.9,19-24. 700
Mengelt, C., Prézelin, B. B., (2002) Dark survival and subsequent light recovery for Pseudo-701
nitzschia multiseries. In: Harmful Algae 2002. K. A. Steidinger, J. H. Landsberg, C. R.
702
Tomas and G. A. Vargo (eds). Florida Fish and Wildlife Conservation Commission, Florida 703
Institute of Oceanography, and Intergovernmental Oceanographic Commission of UNESCO, 704
Paris, pp. 388-390. 705
Miller-Morey, J. S., Van Dolah, F. M., 2004. Differential responses of stress proteins, 706
antioxidant enzymes, and photosynthetic efficiency to physiological stresses in the Florida 707
red tide dinoflagellate, Karenia brevis. Comparative biochemistry and physiology. 708
Toxicology & pharmacology : CBP.138,493-505. 709
Okochi, M., Taguchi, T., Tsuboi, M., Nakamura, N., Matsunaga, T., 1999. Fluorometric 710
observation of viable and dead adhering diatoms using TO-PRO-1 iodide and its application 711
to the estimation of electrochemical treatment. Applied Microbiology and 712
Biotechnology.51,364-369. 713
Olson, R. J., Frankel, S. L., Chisholm, S. W., Shapiro, H. M., 1983. An inexpensive flow 714
cytometer for the analysis of fluorescence signals in phytoplankton - chlorophyll and DNA 715
distributions. Journal of Experimental Marine Biology and Ecology.68,129-144. 716
Osada, M., Stewart, J. E., 1997. Gluconic acid/gluconolactone: physiological influences on 717
domoic acid production by bacteria associated with Pseudo-nitzschia multiseries. Aquatic 718
Microbial Ecology.12,203-209. 719
Pan, Y. L., Parsons, M. L., Busman, M., Moeller, P. D. R., Dortch, Q., Powell, C. L., 720
Doucette, G. J., 2001. Pseudo-nitzschia sp. cf. pseudodelicatissima - a confirmed producer of 721
domoic acid from the northern Gulf of Mexico. Marine Ecology-Progress Series.220,83-92. 722
Pan, Y. L., Subba Rao, D. V., Mann, K. H., 1996. Changes in domoic acid production and 723
cellular chemical composition of the toxigenic diatom Pseudo-nitzschia multiseries under 724
phosphate limitation. Journal of Phycology.32,371-381. 725
Regel, R. H., Ferris, J. M., Ganf, G. G., Brookes, J. D., 2002. Algal esterase activity as a 726
biomeasure of environmental degradation in a freshwater creek. Aquatic Toxicology.59,209-727
223. 728
Remias, D., Holzinger, A., Lutz, C., 2009. Physiology, ultrastructure and habitat of the ice 729
alga Mesotaenium berggrenii (Zygnemaphyceae, Chlorophyta) from glaciers in the European 730
Alps. Phycologia.48,302-312. 731
Ribalet, F., Berges, J. A., Ianora, A., Casotti, R., 2007. Growth inhibition of cultured marine 732
phytoplankton by toxic algal-derived polyunsaturated aldehydes. Aquatic Toxicology.85,219-733
227. 734
Rodriguez-Roman, A., Iglesias-Prieto, R., 2005. Regulation of photochemical activity in 735
cultured symbiotic dinoflagellates under nitrate limitation and deprivation. Marine 736
Biology.146,1063-1073. 737
Sackett, D. L., Wolff, J., 1987. Nile red as a polarity-sensitive fluorescent probe of 738
hydrophobic protein surfaces. Analytical Biochemistry.167,228-234. 739
Saito, K., Kuga-Uetake, Y., Saito, M., 2004. Acidic vesicles in living hyphae of an arbuscular 740
mycorrhizal fungus, Gigaspora margarita. Plant and Soil.261,231-237. 741
Sapp, M., Wichels, A., Gerdts, G., 2007. Impacts of cultivation of marine diatoms on the 742
associated bacterial community. Applied and Environmental Microbiology.73,3117-3120. 743
Scholin, C. A., Gulland, F., Doucette, G. J., Benson, S., Busman, M., Chavez, F. P., Cordaro, 744
J., DeLong, R., et al., 2000. Mortality of sea lions along the central California coast linked to 745
a toxic diatom bloom. Nature.403,80-84. 746
Sierra-Beltrán, A. P., Cruz, A., Nunez, E., Del Villar, L. M., Cerecero, J., Ochoa, J. L., 1998. 747
An overview of the marine food poisoning in Mexico. Toxicon.36,1493-1502. 748
Sierra-Beltrán, A. P., Palafox-Uribe, M., Grajales-Montiel, J., Cruz-Villacorta, A., Ochoa, J. 749
L., 1997. Sea bird mortality at Cabo San Lucas, Mexico: Evidence that toxic diatom blooms 750
are spreading. Toxicon.35,447-453. 751
Stewart, J. E., Marks, L. J., Wood, C. R., Risser, S. M., Gray, S., 1997. Symbiotic relations 752
between bacteria and the domoic acid producing diatom Pseudo-nitzschia multiseries and the 753
capacity of these bacteria for gluconic acid/gluconolactone formation. Aquatic Microbial 754
Ecology.12,211-221. 755
Thessen, A. E., Bowers, H. A., Stoecker, D. K., 2009. Intra- and interspecies differences in 756
growth and toxicity of Pseudo-nitzschia while using different nitrogen sources. Harmful 757
Algae.8,792-810. 758
Veldhuis, M. J. W., Cucci, T. L., Sieracki, M. E., 1997. Cellular DNA content of marine 759
phytoplankton using two new fluorochromes: Taxonomic and ecological implications. 760
Journal of Phycology.33,527-541. 761
Veldhuis, M. J. W., Kraay, G. W., Timmermans, K. R., 2001. Cell death in phytoplankton: 762
correlation between changes in membrane permeability, photosynthetic activity, pigmentation 763
and growth. European Journal of Phycology.36,167-177. 764
Whyte, J. N. C., Ginther, N. G., Townsend, L. D., 1995. Formation of domoic acid and fatty 765
acids in Pseudonitzschia pungens f multiseries with scale of culture. Journal of Applied 766
Phycology.7,199-205. 767
Wolins, N. E., Rubin, D., Brasaemle, D. L., 2001. TIP47 associates with lipid droplets. 768
Journal of Biological Chemistry.276,5101-5108. 769
Work, T. M., Barr, B., Beale, A. M., Fritz, L., Quilliam, M. A., Wright, J. L. C., 1993. 770
Epidemiology of domoic acid poisoning in brown pelicans (Pelecanus occidentalis) and 771
Brandt's cormorants (Phalacrocorax penicillatus) in California. Journal of Zoo and Wildlife 772
Medicine.24,54-62. 773
Wrabel, M. L., Rocap, G., (2007) Specificity of bacterial assemblages associated with the 774
toxin-producing diatom, Pseudo-nitzschia. In: 4th Symposium on Harmful Algae in the U.S. 775
Woods Hole, MA, pp. 191. 776
Wright, J. L. C., Boyd, R. K., de Freitas, A. S. W., Falk, M., Foxall, R. A., Jamieson, W. D., 777
Laycock, M. V., McCulloch, A. W., et al., 1989. Identification of domoic acid, a 778
neuroexcitatory amino-acid, in toxic mussels from eastern Prince Edward Island. Canadian 779
Journal of Chemistry.67,481-490. 780
Yentsch, C. M., Mague, F. C., Horan, P. K., Muirhead, K., 1983. Flow cytometric DNA 781
determinations on individual cells of the dinoflagellate Gonyaulax tamarensis var excavata. 782
Journal of Experimental Marine Biology and Ecology.67,175-183. 783
784 785
Legends to figures
786
Figure 1. Cytograms of 50/50 dead/live cells of Pseudo-nitzschia multiseries stained with 787
SYTOX Green. A. Cytogram of FSC and SSC (morphological parameters, expressed in 788
arbitrary units, AU) of P. multiseries. B. Cytogram of FL1 and FL3 fluorescence of P. 789
multiseries. FL1 is the green fluorescence due to SYTOX Green, FL3 is the red fluorescence
790
due to chlorophyll (AU). R1 are unstained cells (considered as live cells, in red) and R2 are 791
stained cells (considered as dead cells, in green). 792
Figure 2. Bacteria stained with SYBR Green and propidium iodide. A. Histogram of FL1 793
(green) fluorescence of bacteria; 1 to 7 representing aggregates of 1 to 7 or more bacteria. 794
FL1 is the green fluorescence due to SYBR Green. B. Cytograms of morphological 795
parameters of bacteria (FSC and SSC, expressed in arbitrary units, AU). Each colour 796
represents one aggregate size (light green=one bacteria, dark blue=2 bacteria, pink=3 797
bacteria, light blue=4 bacteria, yellow=5 bacteria, red=6 bacteria, dark green=7 or more 798
bacteria). 799
Figure 3. Photomicrographs of Pseudo-nitzschia multiseries cells in white light (A, D, G), 800
epifluorescence light with filter “BP 515/560 / BS 580 / LP 590” (B, E, H), and filter “BP 801
450-490 / BS 510 / LP 515” (C, F, I). A, B, C) Cells stained with BODIPY. D, E, F) Cells 802
stained with Nile Red. G, H, I) Cells stained with FDA. Scale bar=10 µm. 803
Figure 4. Green fluorescence of Pseudo-nitzschia multiseries cells (in arbitrary units, AU) 804
stained with 3.0 µM of fluorescein diacetate (FDA) and measured on FL1 detector of a flow 805
cytometer (n=3, mean ± SD). 806
Figure 5. A- Pseudo-nitzschia multiseries growth curve (y-axis) and bacteria/P. multiseries 807
ratio (z-axis, n=6, mean ± SE). The exponential growth phase of P. multiseries is framed with 808
a black-lined rectangle. B- Concentration of total and dissolved domoic acid (DA) in the 809
whole culture (y-axis, pg ml-1) and cellular DA in fg cell-1 (z-axis, n=6, mean ± SE). 810
Exponential growth phase of P. multiseries is framed with a black-lined rectangle. 811