HAL Id: hal-00835534
https://hal.sorbonne-universite.fr/hal-00835534
Submitted on 18 Jun 2013
HAL is a multi-disciplinary open access
archive for the deposit and dissemination of
sci-entific research documents, whether they are
pub-lished or not. The documents may come from
teaching and research institutions in France or
abroad, or from public or private research centers.
L’archive ouverte pluridisciplinaire HAL, est
destinée au dépôt et à la diffusion de documents
scientifiques de niveau recherche, publiés ou non,
émanant des établissements d’enseignement et de
recherche français ou étrangers, des laboratoires
publics ou privés.
Helping Users Shop for ISPs with Internet Nutrition
Labels
Srikanth Sundaresan, Nick Feamster, Renata Teixeira, Anthony Tang, W.
Keith Edwards, Rebecca E. Grinter, Marshini Chetty, Walter de Donato
To cite this version:
Srikanth Sundaresan, Nick Feamster, Renata Teixeira, Anthony Tang, W. Keith Edwards, et al..
Helping Users Shop for ISPs with Internet Nutrition Labels. HomeNets 2011 - ACM SIGCOMM
Workshop on Home Networks, Aug 2011, Toronto, Canada. pp.13-18, �10.1145/2018567.2018571�.
�hal-00835534�
Helping Users Shop for ISPs with Internet Nutrition Labels
Srikanth Sundaresan
Georgia Tech Atlanta, USA[email protected]
Nick Feamster
Georgia Tech Atlanta, USA[email protected]
Renata Teixeira
CNRS/Sorbonne Universités Paris, France[email protected]
Anthony Tang
Georgia Tech Atlanta, USA[email protected]
W. Keith Edwards
Georgia Tech Atlanta, USA[email protected]
Rebecca E. Grinter
Georgia Tech Atlanta, USA[email protected]
Marshini Chetty
Georgia Tech Atlanta, USA[email protected]
Walter de Donato
University of Napoli Federico II Napoli, Italy
[email protected]
ABSTRACT
When purchasing home broadband access from Internet service providers (ISPs), users must decide which service plans are most appropriate for their needs. Today, ISPs advertise their available service plans using only generic upload and download speeds. Un-fortunately, these metrics do not always accurately reflect the vary-ing performance that home users will experience for a wide range of applications. In this paper, we propose that each ISP service plan carry a “nutrition label” that conveys more comprehensive informa-tion about network metrics along many dimensions, including vari-ous aspects of throughput, latency, loss rate, and jitter. We first jus-tify why these metrics should form the basis of a network nutrition label. Then, we demonstrate that current plans that are superficially similar with respect to advertised download rates may have differ-ent performance according to the label metrics. We close with a discussion of the challenges involved in presenting a nutrition label to users in a way that is both accurate and easy to understand.
Categories and Subject Descriptors
C.2.3 [Computer-Communication Networks]: Network Opera-tions—Network Management; C.2.3 [Computer-Communication Networks]: Network Operations—Network Operations
General Terms
Management, Measurement, Performance
Keywords
access networks, broadband networks, BISMark, benchmarking
Permission to make digital or hard copies of all or part of this work for personal or classroom use is granted without fee provided that copies are not made or distributed for profit or commercial advantage and that copies bear this notice and the full citation on the first page. To copy otherwise, to republish, to post on servers or to redistribute to lists, requires prior specific permission and/or a fee.
HomeNets’11,August 15, 2011, Toronto, Ontario, Canada. Copyright 2011 ACM 978-1-4503-0798-7/11/08 ...$10.00.
1.
INTRODUCTION
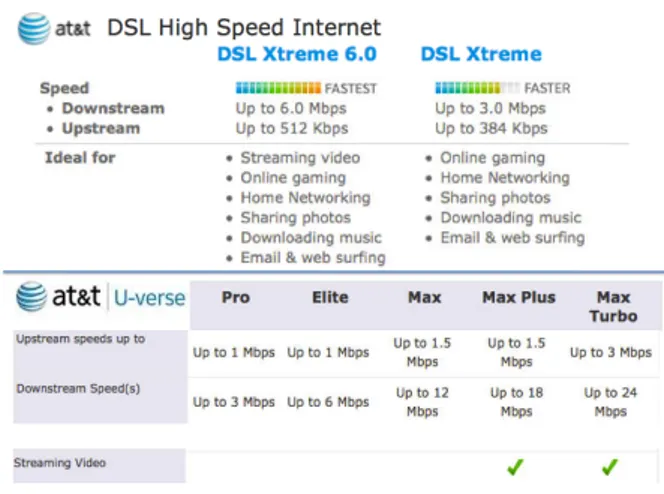
When shopping for Internet plans today, home users must select their ISP primarily based on the upstream and downstream speeds it advertises. The problem with relying solely on throughput in advertisements is that this metric alone does not accurately reflect the actual performance users will receive for certain applications. Some ISPs try to make the throughput metric more accessible, by suggesting which applications require certain throughput levels, as shown in Figure 1. Unfortunately, this information is often inac-curate or, worse, misleading. Although the inconsistencies in these advertisements are troublesome, the underlying problem is that ad-vertising a service plan based only on throughput does not capture many aspects of network performance that can affect applications that users care about.
We envision that users might ultimately purchase ISP service plans based on their usage patterns, perhaps from a portal that could recommend the appropriate service plan for a user based on applications that are important to that user and the performance characteristics of each plan. Realizing this vision first requires a more precise characterization of the performance associated with any given ISP service plan. To inform our design, we draw an analogy with nutrition labels, which are used in many countries to indicate the nutrients in a particular food item, so that users might satisfy their dietary requirements. Network performance also has many dimensions that affect various applications differently. For example, a gamer might be more concerned with latency and jitter than with throughput, while a user who primarily browses the Web would be more concerned with higher throughput. Service plan ad-vertisements should reflect these dimensions. Drawing inspiration from recent opinions in technical policy [3], we develop an Inter-net nutrition labelfor home broadband service plans. Just as food nutrition labels identify the fundamental nutrients that consumers need, we identify and justify the fundamental network properties that consumers should be concerned about when shopping for ISPs. The primary contribution of this paper is to initiate the debate re-garding how users should shop for (and evaluate) their ISP service plans. Although an Internet nutrition label touches on facets that relate to technology, policy, and usability, the first step naturally involves laying the groundwork for such a label. In this paper, we focus on the important first step for designing such a label: identi-fying the underlying network metrics that should go into an Inter-net nutrition label, as well as how they might map to higher-level
Figure 1: Excerpts from service advertisements for AT&T DSL and U-Verse. Intriguingly, 6 Mbits/s is sufficient for streaming video on DSL, but for U-Verse, 18 Mbits/s is required for the same application. Full snapshots are at: http://gtnoise.net/bismark/adverts.html.
and customer comprehensible metrics. At a minimum, such a label should have the following properties:
• Accurate. The label should accurately reflect the network performance that a user would experience from that service plan.
• Measurable. Both the ISP and the user should be able to measure the metrics associated with the label. This require-ment also implies that the ISP should be able to engineer its network both to measure the metric and to meet the perfor-mance metrics that it promises to users.
• Representative of application performance. The label should include the metrics that reflect the performance for applica-tions that are important to the user who is shopping for the service plan.
After proposing and justifying the underlying network metrics for an Internet nutrition label (Section 2), we use performance mea-surements from homes to show how such a label could provide more accurate information to a user than existing service plan ad-vertisements (Section 3).
This paper opens many avenues for future research, such as how such a label advertisement might be audited or enforced, and how the metrics in the label might evolve over time. One of the most important challenges is determining how to present the information from the label in terms and metrics that are easy for a typical user to understand. We discuss this challenge and other open questions in Section 4.
2.
AN INTERNET NUTRITION LABEL
This section describes and justifies the underlying metrics that form the basis of an Internet “nutrition label”. Table 1 summarizes these metrics. In this section, we justify each of these metrics by demonstrating that each metric contributes to the performance that an end user experiences for a certain application. We acknowledge that the metrics in the nutrition label may change over time as ac-cess technologies, applications, and their associated requirements evolve, and as our understanding of how these metrics affect appli-cation performance changes.
Metric Why it matters
Sustainable throughput Throughput for long transfers Short-term throughput Throughput for short transfers Minimum throughput Captures network load Baseline last-mile latency Interactive applications Maximum last-mile latency Captures network load Maximum jitter Real-time/multimedia Loss rate TCP throughput/multimedia Loss burst length TCP throughput/multimedia Availability Basic reachability
Table 1:Performance metrics for the network nutrition label.
ThroughputThroughput is a primary factor in determining the per-formance that an ISP can deliver to users. It indicates the amount of data that a user can send or receive in a particular time inter-val and thus directly determines the speed of a user’s downloads and uploads. The throughput that a user receives can vary over time due to various factors such as network congestion. Previous studies have shown that users of some ISPs have lower throughput during peak hours [8], either due to congestion or deliberate throt-tling [9]. Additionally, mechanisms such as PowerBoost [17, 18] allow users to achieve more throughput during the initial part of a transfer, followed by a lower sustained throughput. If a user has an ISP that offers PowerBoost, the throughput for a short download (e.g., a Web page) might depend primarily on the throughput dur-ing the initial interval. For long file transfers, on the other hand, the user’s throughput will depend on the sustained throughput.
Due to these inherent sources of variability, the single through-put metric that ISPs advertise today does not accurately reflect the throughput that a user will receive for all types of transfers. To better capture throughput variations, we introduce three met-rics. Short-term throughput is the average throughput that a user will receive during the initial period of a transfer, and sustain-able throughputis the long-term expected throughput that a user should receive after an initial period of higher throughput. Mini-mum throughputcaptures degradation in throughput that might re-sult from congestion, throttling, or high network utilization. Last-mile latencyThe performance of most interactive applica-tions depends on end-to-end latency [7]. Access ISPs cannot con-trol end-to-end latency, but they can guarantee the latency between the home and the first border router in their network, which we call the last-mile latency. We also define baseline last-mile latency as the minimum latency to the border router in the ISP network. Be-cause recent studies have shown that most modems have extremely large buffers, which cause last-mile latencies as high as a few sec-onds under heavy load [12], we also define the maximum last-mile latency, which is the largest value of last-mile latency a user would expect, even during periods of congestion.
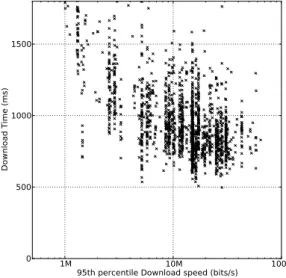
To illustrate the importance of last-mile latency for the per-formance of some applications, we show how last-mile latency can sometimes be the dominant factor that affects Web page download times. Figure 2 shows the average download time for www.facebook.comfor about 4,000 users across eight differ-ent ISPs in the United States, according to data collected by Sam-Knows and the FCC [19]. Figure 2a plots the the average time it takes to download all objects from www.facebook.com as a function of the 95th
percentile of each user’s achieved down-stream throughput. The average size of the download is 1 MByte.
1M95th percentile Download speed (bits/s)10M 100M 0 500 1000 1500 Download Time (ms)
(a)Fetch time stabilizes above 6Mbits/s.
5 10Baseline latency (ms)20 30 40 50 0 500 1000 1500 Download Time (ms)
(b)Latency affects fetch times.
Figure 2:Effect of downstream throughput and baseline latency on fetch time from facebook.com. (Data from SamKnows/FCC study.)
Although download times decrease as throughput increases, users see negligible improvement once the throughput exceeds 6 Mbits/s: page download time is never faster than about 500 milliseconds, re-gardless of the user’s downstream throughput. On the other hand, Figure 2b plots the download time for each user versus the base-line last-mile latency for all users whose downstream throughput (95th
percentile) exceeds 6 Mbits/s. The users’ minimum expected download times increase by about 50% when baseline latency in-creases from 10 ms to 40 ms. In other words, for download rates that exceed about 6 Mbits/s, baseline last-mile latency can be the dominant factor in determining a user’s experience when browsing some Web pages.
JitterMultimedia and interactive applications are sensitive to the
difference in latency between consecutive packets, which is often called jitter [5] and is measured as the IP packet delay variation [6]. We define maximum jitter as the largest value of jitter that users should experience. Maximum jitter has units of milliseconds and directly represents the amount of buffering (or delay) that a stream-ing UDP application must introduce in order to provide “smooth” playback to a user. Based on the ITU-T recommendation that trans-mission time for interactive applications should typically not ex-ceed 200 ms [13], the maximum jitter metric can help users deter-mine whether that plan will be suitable for interactive applications they may wish to run.
Loss Packet loss affects the performance of all applications. Achievable TCP throughput varies inversely with the square root of the loss rate [15], and even modest packet loss rates can also result in TCP timeouts, resulting in much worse performance. Pre-vious work has shown that the loss of even a single packet can severely degrade streaming video quality [11] (for UDP streams); in addition, bursty packet loss can also reduce streaming video per-formance [21]. To capture these effects, we define the loss rate to capture the average loss over a sustained period, and the loss burst lengthto represent the average duration of a packet loss episode. AvailabilityPerformance metrics are meaningless if a user cannot even obtain connectivity to the Internet in the first place. Thus, we also define availability as the fraction of time that home users have IP connectivity to their access ISP. Although studies continu-ally evaluate the availability of end-to-end Internet paths [1,10,16], there has been much less focus of the availability of the access link itself.
Usage Caps, Throttling, and Other PoliciesISPs may give higher priority to some application traffic (e.g., traffic from the ISP’s VoIP or IPTV service) and discriminate against others (e.g., some ISPs have been found to throttle peer-to-peer traffic). Some ISPs also impose usage caps, where the performance or price of the network access changes after a user transfers more than a certain volume of traffic in a month. The Internet nutrition label should make these policies transparent to users. The metrics in Table 1 do not directly capture these types of policies, but we argue that an ISP could (and should) expose these policies by advertising multiple separate nu-trition labels for conditions where performance would vary drasti-cally (e.g., for a certain application, after a cap has been imposed).
3.
APPLYING THE LABEL IN PRACTICE
The Internet nutrition label has two purposes. First, when users shop for Internet service plans, the label informs them about the performance they can expect to receive. After a user subscribes to a given plan, the label could also be used for auditing. For this pur-pose, a benchmarking suite could be installed on the user’s home gateway. Auditing has its own set of challenges, which we discuss briefly in Section 4 but do not address in this paper. We focus on how ISPs obtain values for the Internet nutrition label before users subscribe by applying the label to performance data from six house-holds across three different ISPs. We highlight, in particular, that two homes with the same advertised service plan can, in fact, see very different performance with respect to the metrics associated with the Internet nutrition label.
Before a user purchases a service plan, ISPs must estimate the metrics in the Internet nutrition label, based on the user’s address or phone number. Unfortunately, it is difficult for an ISP to pre-dict precisely the performance a user will receive, since the perfor-mance can be affected by the quality of the local loop, wiring in the home, and even the user’s home network equipment. To
ac-count for these uncertainties, we propose that the ISP advertise an expected range of values for each metric. A potential customer will typically have the local loop tested before buying a plan; in many countries, ISPs already perform simple tests in the local loop to determine which plans are available to a user. To construct the In-ternet nutrition labels, ISPs would have to run more comprehensive tests and expose the results to the user. A simple test is sufficient to estimate the latency and throughput that the customer can expect to achieve, but other factors such as loss and jitter are more difficult to predict. ISPs might be able to estimate such metrics based on measurements from other subscribers in the same neighborhood.
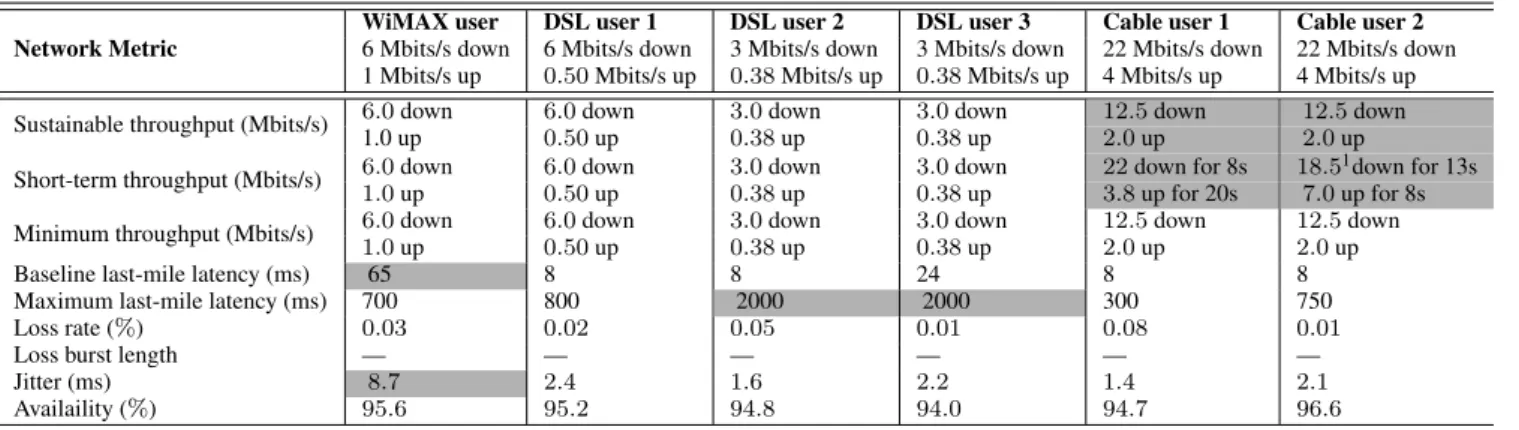
We now show examples of Internet nutrition labels for six house-holds across three different ISPs. Table 2 shows most metrics for the network nutrition label experienced by each user over the course of one month, using data that we collected from an instru-mented router at each home. In particular, we show sustainable and short-term throughput, minimum throughput, baseline and maxi-mum last-mile latency, loss rate, and an approximation of jitter. We have redacted the identities of the ISPs for this example, since these numbers are not intended to be conclusive performance re-ports from each ISP; rather, these data points serve as an illustra-tive example of how different aspects of performance can vary, even within the same service plan.
The first row of Table 2 shows that the sustainable through-putfor the WiMAX and DSL users roughly matches the adver-tised upstream and downstream throughput values, but sustainable throughput for the cable users is significantly less than the adver-tised values, since the cable ISP advertises the throughput associ-ated with PowerBoost. The cable users experience higher short-term throughputthan sustainable throughput, also due to Power-Boost. The DSL and WiMAX ISPs do not offer PowerBoost-like technology, so in these cases users do not experience higher short-term throughput. Figure 3 shows the throughput profiles for two cable users with PowerBoost; the graph shows a transient period where users achieve higher download and upload throughput. In-terestingly, the peak rates during this initial transient period differ significantly, even between these the two users, suggesting that a nutrition label could provide useful information about differences that exist within a single advertised service plan. Some previous studies have shown that a user’s upload and download throughput may degrade during periods of peak load or congestion [8], so we believe that including this metric is important. For the users we studied, there was no discernible degradation due to time of day, so we assume that the minimum throughput is the same as the adver-tised throughput. This may not hold in practice.
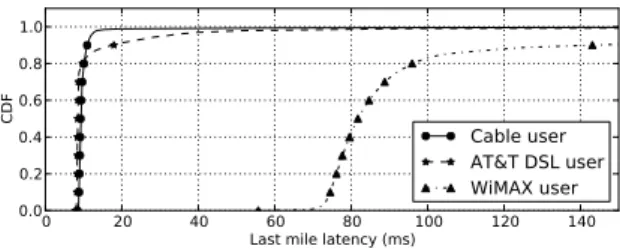
Figure 4 shows that the DSL and cable users experience rela-tively low baseline latencies compared to the WiMAX user. The latency profile that we observe for the WiMax user also agrees with an independent study conducted in a different market [22]. Because we did not capture packet-level round-trip times for the measure-ments we conducted in our deployment, we approximate the jitter in Table 2 as the standard deviation of the last mile latency; again, we see that the WiMAX user experiences jitter that is significantly higher than users with other access technologies.
Loss rates do not appear to correlate with access ISP, technol-ogy, or service plan. Rather, the most important factor for affecting loss rates appears to be the quality of the local loop: a noisy lo-cal loop may have higher loss. For DSL, lolo-cal-loop “interleaving” is sometimes enabled to reduce the effect of line noise, which can sometimes increase the baseline last-mile latency by a factor of two or more. For example, consider DSL users 2 and 3: user 2 has low
1
This user actually gets 22 Mbits/s for 3s and 18.5 Mbits/s for 10s. We label this as 18.5 Mbits/s for 13s for visual ease of reading.
0 5 10 15 20 25 Time (seconds) 8000 12000 16000 20000 24000 Throughput (Kbits/s) Cable User 1 Cable User 2
(a)PowerBoost for download.
0 10 20 30 40 Time (seconds) 0 2000 4000 6000 8000 Throughput (Kbits/s) Cable User 1 Cable User 2
(b)PowerBoost for upload.
Figure 3:PowerBoost effects across four distinct Comcast users. The du-ration and rates vary across users.
0 20 40 60 80 100 120 140 Last mile latency (ms)
0.0 0.2 0.4 0.6 0.8 1.0 CDF Cable user AT&T DSL user WiMAX user
Figure 4:Latency profile for Cable, DSL and WiMAX.
baseline latency (8 ms), but much higher loss (0.5%) compared to user 3, who has low loss (0.1%), but higher latency (24 ms).
Table 2 shows that all users experience a maximum last-mile latency that is significantly higher than the baseline last-mile la-tency. For these users, the latency is a direct function of the modem buffer size (which depends on the manufacturer), and the through-put (which affects how quickly the buffer drains). DSL users 2 and 3 see latencies of about two seconds (extremely high, especially for interactive traffic). Although ISPs are not directly responsible the modem that a user installs in the home, ISPs in many coun-tries (including in the United States and in Europe) do sell or rent modems directly to users. In light of the significant effect that a user’s choice of modem has on overall performance, it may ulti-mately make sense for an ISP to include information about how different modems might affect this metric.
4.
FUTURE DIRECTIONS
We have identified several metrics that we believe should com-prise an Internet nutrition label, but identifying these metrics is only a starting point. In this section, we outline several avenues for fu-ture research that touch on technology, policy, and usability. Presenting information to usersAn Internet nutrition label should allow users to understand what the label means. To reconcile the tension between the low-level metrics (such as those in Table 1) and concepts more meaningful to users, we envision that network
Network Metric
WiMAX user DSL user 1 DSL user 2 DSL user 3 Cable user 1 Cable user 2 6 Mbits/s down 6 Mbits/s down 3 Mbits/s down 3 Mbits/s down 22 Mbits/s down 22 Mbits/s down 1 Mbits/s up 0
.50 Mbits/s up 0.38 Mbits/s up 0.38 Mbits/s up 4 Mbits/s up 4 Mbits/s up Sustainable throughput (Mbits/s) 6.0 down 6.0 down 3.0 down 3.0 down 12.5 down 12.5 down
1.0 up 0
.50 up 0.38 up 0.38 up 2.0 up 2.0 up Short-term throughput (Mbits/s) 6.0 down 6.0 down 3.0 down 3.0 down 22 down for 8s 18.5
1down for 13s 1
.0 up 0.50 up 0.38 up 0.38 up 3.8 up for 20s 7.0 up for 8s Minimum throughput (Mbits/s) 61.0 down 6.0 down 3.0 down 3.0 down 12.5 down 12.5 down
.0 up 0.50 up 0.38 up 0.38 up 2.0 up 2.0 up Baseline last-mile latency (ms) 65 8 8 24 8 8 Maximum last-mile latency (ms) 700 800 2000 2000 300 750 Loss rate (%) 0
.03 0.02 0.05 0.01 0.08 0.01
Loss burst length — — — — — —
Jitter (ms) 8
.7 2.4 1.6 2.2 1.4 2.1 Availaility (%) 95.6 95.2 94.8 94.0 94.7 96.6
Table 2:Labels for users from different ISPs and service plans. The highlighted columns indicate metric values that simpler advertising models would not capture. The measurements we take in our deployment do not allow us to compute loss burst length.
Application (Port) User Upstream (MBytes) Downstream (MBytes) HTTP (80) 1 150.8 11,465 2 550.4 81,314 SSH (22) 1 488.1 230.6 2 34.9 2.36 S-IMAP (993) 12 43.75.6 428.965.7 VoIP/Gaming (10k-20k; UDP) 1 219.3 185.9 2 170.0 239.1 Total 1 6,724.8 23,295.7 2 14,183.6 88,702.9
Table 3:Different users exhibit different usage profiles. The table shows traffic volumes from February 6–20, 2011 for two users in our testbed. User 1 has more ssh and secure IMAP traffic, whereas User 2 has con-siderably more HTTP traffic and higher overall traffic volumes.
metrics could be communicated to users in raw or interpreted form depending on the circumstance. Raw metrics, such as those defined in Table 1, could be used to specify network-level requirements for applications (much as electronic devices expose electrical “in-put” requirements in standardized formats on adapter labels (e.g., “AC100-240V, 50-60Hz 1A”)). While raw metrics may not be im-mediately meaningful to typical consumers, a user can easily un-derstand that finding an electricity source that matches the ranges required by the device will ensure performance. In such cases, a single baseline or range requirement for the metrics would be suf-ficient.
Interpreted metrics are analogous to the FDA’s mandate of a “Daily Recommended Intake” column for each nutrient, based on a typical individual’s daily nutritional needs. Applying this approach directly to the network scenario is challenging, since users have dif-ferent requirements and expectations for application performance. In practice, though, a user may more easily understand interpre-tations such as how long a song download will take (in terms of time), or what the quality of a streaming movie of a streaming movie would be (in terms of frame rate). An important area for future research will be to generalize a mapping from the low-level elements of the network nutrition label to metrics and characteris-tics that are meaningful to users.
Accounting for user profiles and preferencesAnother approach is to hide metrics from users altogether and instead focus on users’ actual networking needs and expectations. User needs could be captured by asking each home about their application usage or
ac-tivity levels, thereby building user profiles unique to each individ-ual or household. These profiles would allow users to better un-derstand and describe themselves and their needs to others. ISPs could directly map these needs to existing offerings without having to expose users to actual metrics.
Our deployment study in Atlanta shows that households exhibit very different usage profiles. Table 3 shows the traffic usage break-down by network port for two households. For User 1, about 10% of the total downstream traffic is ssh traffic, whereas User 2 has almost no ssh traffic. User 1 is also a considerably heavier email user, with nearly half a gigabyte of downstream traffic for secure IMAP. On the other hand, User 2 has higher overall usage and downloads much more traffic via HTTP.
Although usage patterns for the two households in Table 3 in-dicate that the households use applications differently, traffic vol-ume does not suggest the importance of different applications to each household. Given the opportunity, users might prioritize ap-plications differently (e.g., a high-quality voice and video calls to a loved one might be more important than the ability to quickly download a large file). Ultimately, the nutrition label should cap-ture these priorities, and potentially even resolve the priorities of multiple members from a single household. Taking into account these priorities will help users understand their own home Inter-net requirements, identify suitable service plans, and evaluate the performance of any particular ISP service plan.
DynamicsAlthough the phrase “nutrition label” implies a static representation of performance, network conditions are dynamic (i.e., performance is affected by many factors such as time of day and congestion), and users’ requirements may also change over time. Thus, a “label” that reflects ISP performance may be best represented as an interactive application that allows users to view performance for multiple applications over different time intervals (e.g., an hour, a week, or a month). Designing the label to represent these dynamic conditions is an open area for future work. AuditingAdvertising the characteristics of ISPs’ available service plans are, of course, only one side of the story: users will also want to know whether ISPs actually meet the performance met-rics that they advertise. In fact, the metmet-rics in the label bear some resemblance to service level agreements (SLAs) for backbone net-works [14], which are binding contracts that guarantee bounds on latency, packet loss, and availability [20]. Due to the inherent vari-ability introduced by different access technologies, network condi-tions, usage patterns, and cases where the access link might be the bottleneck, Internet nutrition labels cannot currently be tight
con-tracts. Indeed, the question of how an Internet nutrition label might be audited raises many questions, such as who should perform the auditing, how it should be conducted, and what conditions would deem an ISP in violation of its advertised nutrition label. Regu-latory agencies across the world are already grappling with these issues with varying degrees of success [2, 4].
Household “network usage personas”A community-oriented ap-proach to sharing the Internet nutrition labels might help users learn about different ISP service plans in a geographic area. For exam-ple, households might contribute “network usage personas” that de-scribe the profile of network use in a household. Other households could then use these personas to find similar users for each service plan. Currently, end-users are typically limited to discussions of plan costs, the quality of customer support, and network outages, which are important factors but may not completely represent the level of service that they might expect. Being able to understand the details of the service they are purchasing in terms of an Internet nutrition label would allow users to rate and compare their service plans in more meaningful ways.
Application-specific labelsAlthough the totality of home network usage drives plan selection, some applications may warrant their own labels. For example, by giving applications that are partic-ularly intensive on the home network their own label, customers may become more aware of how competing applications affect per-formance. A significant challenge for end-users is understanding the consequences of making changes to their networks. The addi-tion of a new device or service can have significant effects on the network performance, which can be difficult for non-specialists to deduce. These users see a change in performance but are not sure why it has happened or whether they can do anything about it after the point of purchase. Having labels that let end-users ask ques-tions about whether their current service plan can handle the costs of a particular application could empower people to make changes to their network that are commensurate with their ISP service plan.
Acknowledgments
We thank the participants in the SamKnows and BISMark studies, and to Sam Crawford at SamKnows and Walter Johnston at the FCC for help and access to the data from the SamKnows study. We are grateful to Dave Täht for his continuing support of the BIS-Mark platform. This project is supported by the the National Sci-ence Foundation through awards CNS-1059350, CNS-0643974, a generous Google Focus Grant, the European Community’s Seventh Framework Programme (FP7/2007-2013) no. 258378 (FIGARO), and the ANR project C’MON.
REFERENCES
[1] D. G. Andersen, H. Balakrishnan, M. F. Kaashoek, and R. Morris. Resilient Overlay Networks. In Proc. 18th ACM Symposium on Operating Systems Principles (SOSP), pages 131–145, Banff, Canada, Oct. 2001.
[2] N. Anderson. What if ISPs had to advertise minimum speeds? In Hungary, they do. http://arstechnica.com/tech-policy/news/2010/08/ the-federal-communications-commission-reported.ars. Ars Technica.
[3] N. Anderson. Does Broadband Need Its Own Government Nutrition Label? http://arstechnica.com/tech-policy/news/2009/10/
does-broadband-needs-its-own-government-nutrition-label. ars, Oct. 2010. Ars Technica.
[4] Ofcom wants to ban misleading broadband speed ads.
http://www.bbc.co.uk/news/technology-12611315. BBC. [5] K.-T. Chen, P. Huang, and C.-L. Lei. How sensitive are online gamers to
network quality? Commun. ACM, 49:34–38, November 2006. [6] C. Demichelis and P. Chimento. IP Packet Delay Variation Metric for IP
Performance Metrics (IPPM). Internet Engineering Task Force, Nov. 2002. RFC 3393.
[7] M. Dick, O. Wellnitz, and L. Wolf. Analysis of factors affecting players’ performance and perception in multiplayer games. In Proceedings of 4th ACM SIGCOMM workshop on Network and system support for games, NetGames ’05, pages 1–7, New York, NY, USA, 2005. ACM.
[8] M. Dischinger, A. Haeberlen, K. P. Gummadi, and S. Saroiu. Characterizing residential broadband networks. In Proc. ACM SIGCOMM Internet Measurement Conference, San Diego, CA, USA, Oct. 2007.
[9] M. Dischinger, A. Mislove, A. Haeberlen, and K. P. Gummadi. Detecting bittorrent blocking. In Proc. Internet Measurement Conference, Vouliagmeni, Greece, Oct. 2008.
[10] N. Feamster, D. Andersen, H. Balakrishnan, and M. F. Kaashoek. Measuring the effects of Internet path faults on reactive routing. In Proc. ACM SIGMETRICS, San Diego, CA, June 2003.
[11] N. Feamster and H. Balakrishnan. Packet loss recovery for streaming video. In Proc. 12th International Packet Video Workshop (PV 2002), Pittsburgh, PA, Apr. 2002.
[12] J. Gettys. Bufferbloat. http://www.bufferbloat.net/. [13] One-way transmission time recommendation, 2003.
[14] J. Martin and A. Nilsson. On service level agreements for ip networks. In Proceedings, IEEE INFOCOM, 2002.
[15] J. Padhye, V. Firoiu, D. Towsley, and J. Kurose. Modeling TCP Throughput: A Simple Model and its Empirical Validation. In Proc. ACM SIGCOMM, pages 303–323, Vancouver, British Columbia, Canada, Sept. 1998.
[16] V. Paxson. End-to-End Routing Behavior in the Internet. IEEE/ACM Transactions on Networking, 5(5):601–615, 1997.
[17] PowerBoost FAQs - Charter. http://myaccount.charter.com/ customers/Support.aspx?SupportArticleID=2338.
[18] PowerBoost FAQs - Comcast. http://www.comcast.com/Customers/ FAQ/FaqCategory.ashx?CatId=377.
[19] SamKnows. Measure Your Broadband Accurately. http://testmyisp.com/.
[20] Sprint SLA. https://www.sprint.net/sla_performance.php. [21] S. Tao, J. Apostolopoulos, and R. Guerin. Real-time monitoring of video
quality in ip networks. Networking, IEEE/ACM Transactions on, 16(5):1052 –1065, 2008.
[22] K. Yap, S. Katti, G. Parulkar, and N. McKeown. Deciphering a Commercial WiMAX Deployment using COTS Equipments. Technical report, Stanford University.