Alfvénic velocity spikes and rotational
flows in the near-Sun solar wind
The MIT Faculty has made this article openly available.
Please share
how this access benefits you. Your story matters.
Citation
Kasper, J.C. et al. "Alfvénic velocity spikes and rotational flows in the
near-Sun solar wind." Nature 576, 7786 (December 2019): 228–231
© 2019 The Author(s)
As Published
http://dx.doi.org/10.1038/s41586-019-1813-z
Publisher
Springer Science and Business Media LLC
Version
Author's final manuscript
Citable link
https://hdl.handle.net/1721.1/127221
Terms of Use
Article is made available in accordance with the publisher's
policy and may be subject to US copyright law. Please refer to the
publisher's site for terms of use.
Alfv ´enic Velocity Spikes and Rotational Flows in the
1
Near-Sun Solar Wind
2
J. C. Kasper
1,2*, S. D. Bale
3,4,5, J. W. Belcher
6, M. Berthomier
7, A. W. Case
2, B. D. G.
3
Chandran
8,9, D. W. Curtis
4, D. Gallagher
10, S. P. Gary
11, L. Golub
2, J. S. Halekas
12, G. C.
4
Ho
13, T. S. Horbury
5, Q. Hu
14, J. Huang
1, K. G. Klein
15,16, K. E. Korreck
2, D. E. Larson
4, R.
5
Livi
4, B. Maruca
17,18, B. Lavraud
19, P. Louarn
19, M. Maksimovic
20, M. Martinovic
15, D.
6
McGinnis
12, N. V. Pogorelov
14, J. D. Richardson
6, R. M. Skoug
11, J. T. Steinberg
11, M. L.
7
Stevens
2, A. Szabo
19, M. Velli
21, P. L. Whittlesey
4, K. H. Wright
25, G. P. Zank
14, R. J.
8
MacDowall
19, D. J. McComas
22, R. L. McNutt, Jr.
13, M. Pulupa
4, N. E. Raouafi
13, and N. A.
9
Schwadron
8,910
1Climate and Space Sciences and Engineering, University of Michigan, Ann Arbor, MI 48109, USA
11
2Smithsonian Astrophysical Observatory, Cambridge, MA 02138, USA
12
3Physics Department, University of California, Berkeley, CA 94720-7300, USA
13
4Space Sciences Laboratory, University of California, Berkeley, CA 94720-7450, USA
14
5The Blackett Laboratory, Imperial College London, London, SW7 2AZ, UK
15
6Kavli Center for Astrophysics and Space Sciences, Massachusetts Institute of Technology, 77 Massachusetts
16
Avenue Cambridge, MA 02139-4307, USA 17
7Laboratoire de Physique des Plasmas, CNRS, Sorbonne Universite, Ecole Polytechnique, Observatoire de Paris,
18
Universite Paris-Saclay, Paris, 75005, France 19
8Department of Physics and Astronomy, University of New Hampshire, Durham, NH 03824, USA
20
9Space Science Center, University of New Hampshire, Durham, NH 03824, USA
21
10Heliophysics and Planetary Science Branch ST13, Marshall Space Flight Center, Huntsville, AL 35812, USA
22
11Los Alamos National Laboratory P.O. Box 1663 Los Alamos, NM 87545, USA
23
12Department of Physics and Astronomy, University of Iowa, IA 52242, USA
24
13Johns Hopkins University Applied Physics Laboratory 11100 Johns Hopkins Road, Laurel, MD 20723-6099, USA
25
14Department of Space Science and Center for Space Plasma and Aeronomic Research, University of Alabama in
26
Huntsville, Huntsville, AL 35805, USA 27
15Lunar and Planetary Laboratory, University of Arizona, Tucson, AZ 85721, USA
28
16Department of Planetary Sciences, University of Arizona, Tucson, AZ 85719, USA
29
17Department of Physics and Astronomy, University of Delaware, Newark, DE 19716, USA
30
18Bartol Research Institute, University of Delaware, Newark, DE 19716, USA
31
19NASA/Goddard Space Flight Center, Greenbelt, MD 20771, USA
32
20LESIA, Observatoire de Paris, Universite PSL, CNRS, Sorbonne Universite, Universite de Paris, 5 place Jules
33
Janssen, 92195 Meudon, France 34
21Department of Earth, Planetary & Space Sciences, University of California, Los Angeles CA 90095, USA
35
22Department of Astrophysical Sciences, Princeton University, Princeton, NJ 08544, USA
36
24Institut de Recherche en Astrophysique et Plan ´etologie, CNRS, UPS, CNES, Universit ´e de Toulouse, Toulouse,
37
France 38
25Universities Space Research Association, Science and Technology Institute, Huntsville AL 35805, USA
39
*jckasper@umich.edu
40
ABSTRACT
Figure 1. An overview of the first encounter with the Sun by Parker Solar Probe. (a) relative occurrence rate of proton radial
speed VpRin one hour intervals. Red triangles are the start and end of the high-rate data collection below 54RSand the green
triangle indicates perihelion at 35.7Rs. (b) same for transverse component VpT of proton velocity in solar equatorial plane, (c)
proton number density np, (d) proton temperature Tp, (e) radial component of magnetic field BR, (f) electron pitch-angle
distribution, and (g) 20 − 200 keV proton rate. The date, distance r, and latitude λ relative to the solar equator are indicated at daily intervals.
The prediction of a supersonic solar wind1was first confirmed by spacecraft near Earth2,3and later by spacecraft at heliocentric distances r as small as 62 solar radii (RS)4. These missions showed that plasma accelerates as it emerges from the corona,
aided by unidentified processes that transport energy outward from the Sun before depositing it in the wind. Alfv ´enic fluctuations are a promising candidate for such a process because they are seen in the corona and solar wind and contain significant energy5–7. Magnetic tension forces the corona to co-rotate with the Sun, but to date any residual rotation reported far from the Sun has been much smaller than the amplitude of waves and deflections from interacting wind streams8. Here we report observations of solar-wind plasma at r ' 35RS9–11, well inside the radius at which stream interactions become important. We
find that the Alfv ´en waves organize into structured velocity spikes up to minutes long that are associated with propagating S-like bends in the magnetic-field lines. We detect an increasing azimuthal flow velocity of the solar wind around the Sun, peaking at 35 − 50 km s−1, significantly above the amplitude of waves. These flows exceed classical predictions of a few km s−1, challenging models of circulation in the corona and calling into question our understanding of how stars lose angular momentum and spin down as they age12–14.
42
Parker Solar Probe (PSP) launched in August 2018 on a Delta IV Heavy rocket. The high energy of the launch combined 43
with a gravitational assist from Venus in September 2018, placed PSP into an eccentric orbit with a period of 147 days and 44
a perihelion at r = 35.7RS, nearly a factor of two closer to the Sun than any previous mission4. This letter makes use of
45
observations collected by instruments on the spacecraft during the first two encounters with the Sun in November 2018 and 46
April 2019. While the instruments collect observations at a low rate far from the Sun, the primary science collection at high 47
rate occurs during the encounter phase of each orbit at r < 54RS(0.25 au). Encounter one (E1) lasted from 31 October to 12
48
November 2018, with the first perihelion occurring at 03:27 UT on 6 November. During these two encounters the longitude of 49
PSP relative to the rotating surface of the Sun barely changed; PSP essentially dove down into, and then rose straight up from, a 50
single narrow region above the Sun. E1 and E2 data thus describe a handful of specific solar-wind streams. 51
Nearly two million thermal energy distribution functions of the solar-wind protons were recorded during E1, and more than 52
three times that during E2 (Fig.1, Extended Data Figure 1). From these distribution functions solar wind proton bulk properties 53
such as velocity, density, and temperature are derived. Within any hour interval, the distribution of radial solar-wind speed 54
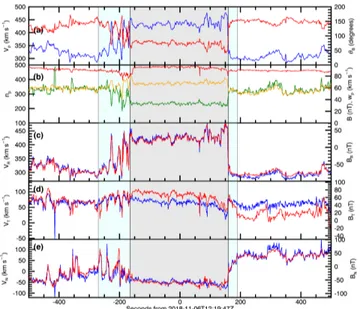
Figure 2. Solar wind fluctuations near closest approach. Near-Sun fluctuations meet Alfv´enic criteria, but are organized into
structures and contain density enhancements. (a) magnitude of VpR(blue) and angle θBRof B from radial outwards, (b)
magnitudes of np(green), B (red), and proton thermal speed wp(yellow); (c-e) variation of each vector component of velocity
(blue) and magnetic field (red) in the R, T , and N directions. There is a baseline solar wind speed with ≈ 300km/s and jets where Vpjumps by ≈ 100km/s. The fluctuations are highly Alfv´enic, with equal energy in field and flow, but organized into
structures instead of randomly distributed, and there is evidence of compressions.
VpRwas strongly peaked at a minimum value, with a one-sided tail extending to larger VpR. VpRreached its minimum value of
55
200 km/s about a quarter of the way though E1 and then steadily rose to about 600 km/s. Numerical simulations and simple 56
extrapolations of the observed photospheric magnetic field suggest that PSP spent all of E1 south of the global heliospheric 57
current sheet (HCS), in a region with inward magnetic polarity (BR< 0)15. Near the start and end of E1 PSP sampled slow
58
wind from near the HCS. Closer to the Sun PSP observed first very slow wind and then fast wind, both of which are thought 59
to emerge from a low-latitude coronal hole15. Below 40 RS, VpThas a net positive value, which peaks at closest approach.
60
This flow may be the long-sought signature of plasma co-rotation in the corona. The density peaks in the slowest wind, at 61
a value of approximately 400 cm−3, about 50 times higher than typical values at 1 au, as expected from mass conservation 62
and spherical expansion. The proton temperature Tpand VpRremain positively correlated16. At perihelion the protons are ≈ 4
63
times hotter than protons with similar VpRat 1 au, consistent with radial scalings reported from earlier missions4. The radial
64
component of the magnetic field, BR, increases in magnitude with proximity to the Sun but unexpectedly changes sign many
65
times. The pitch-angle (θ ) distribution (PAD) for electrons, or the number of electrons at a given energy as a function of their 66
angle relative to B, is a valuable diagnostic of these changes in the direction of B. Here we show the PAD in a 22-eV-wide 67
energy channel centered on 314 eV, well above the electron thermal energy. The sharp peak near 180◦corresponds to the strahl, 68
a beam of super-thermal electrons that travel away from the Sun along magnetic-field lines. Near the Sun strahl evolves towards 69
small sin θ because of magnetic-moment conservation17. If the reversals in B
Rseen by PSP result from PSP’s crossing between
70
open field lines (connected to the Sun at only one end) with different signs of BRback at the Sun, then the strahl would flip
71
between 180◦and 0◦each time BRchanged sign. Instead, every time BRflips, the strahl maintains its 180◦orientation, clearly
72
indicating that the reversals in BRare due to S-like bends in the magnetic-field lines (Extended Data Figure 2). Closed field
73
lines with both ends connected to the Sun and strahl traveling both parallel and anti-parallel to BBBare seen during the arrival of a 74
coronal mass ejection on 12 November, following an enhancement in energetic particles18. 75
Fig.2shows a timeseries of 80 minutes of observations several hours after perihelion illustrating typical velocity and 76
magnetic-field fluctuations. About half the time B points radially inward towards the Sun and V sits at a relatively constant 77
300km/s. The remaining time includes seven distinct intervals in which B rotates away from its radial-inwards orientation 78
Figure 3. A closer look at a velocity spike. The same formatting is used as in Figure 2, but focused on a single 1,000 second
interval. The left blue region indicates the 105 s period when PSP moved from the ambient plasma into the spike. The central core of the spike is indicated by the grey region and lasted for 325s, characterized by steady but disturbed flow and field with a large rotation in B to θB∼ 70◦, a jump in flow to 343 km s−1. Return from the core spike into ambient solar wind is marked by
the second blue region and took 30s.
and VpRsimultaneously jumps and V also rotates, linking the one-sided tail in VpRand the reversals in polarity seen in the E1
79
overview. These jumps in flow associated with rotations in B and V are similar to one-sided Alfv´enic structures first seen farther 80
from the Sun6,7. The spikes seen by PSP are different in that they have larger amplitudes and are often associated with an 81
increase in density, np, indicating that the spikes have a non-Alfv´enic component. The correlated variations in the components
82
of B and V , their relative amplitudes, and the constant value of |B| are consistent with large-amplitude, spherically polarized 83
Alfv´en waves propagating through the plasma in the anti-Sunward direction, similar to earlier observations5,19. We can classify 84
this wind stream (and indeed much of E1) as Alfv´enic slow solar wind20. 85
About 1,000 long-duration (> 10 s) and isolated velocity spikes with large rotations in B were identified in E1. (About half 86
as many were seen in E2.) Often the spikes can be separated chronologically into a core region with plasma conditions that are 87
very different from the ambient solar wind but relatively constant, a comparatively short transition region on one side of the 88
core, and a longer transition region on the other side containing large-amplitude fluctuations (See Fig.3). During the 105s 89
transition at the beginning of this spike the flow underwent seven large oscillations of amplitude 150kms−1, possibly resulting 90
from Kelvin-Helmoltz instability. 91
Equally unexpected as the spikes and BRreversals are the large-amplitude and sustained positive rotational velocities seen
92
below 40Rsfor E1 and 50RSfor E2 (Fig.4). Net rotation has been reported farther from the Sun, but it was on the same order
93
as instrument error and much smaller than the standard deviation in flow due to fluctuations and stream interactions8,21. Here 94
VpTrises to 35 km s−1(E1) and 50 km s−1(E2). This is much greater than the variance from fluctuations including the velocity
95
spikes, there is no evidence of stream interactions, and the values are much greater than the precision in averaged flows of less 96
than 0.5 km s−1and an absolute error in flow due to a pointing error of less than 3 km s−1(See Methods). These are the first in 97
situ observations of net rotational flow in the solar wind significantly above fluctuations and uncertainty. 98
Some level of rotational flow has always been expected in the solar wind near the Sun, as magnetic tension in the corona 99
should force the plasma to rotate as the Sun spins. However, the large rotational velocities measured greatly exceed the value 100
in the axisymmetric Weber-Davis model13, posing a major challenge to our understanding of the dynamics of the near-Sun 101
solar wind. Determining the origin of these tangential flows will be essential for understanding how the Sun loses angular 102
momentum and spins down as it ages12,14,22. Further studies of the angular momentum should include magnetic fields, waves, 103
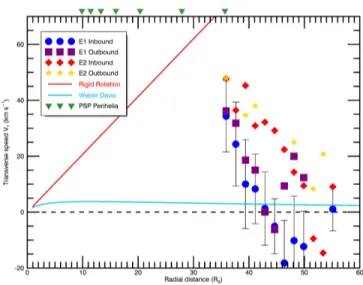
Figure 4. Large circulation of solar wind seen near Sun. Averaged rotational flow, VpT, over 1.75RSintervals during E1
(inbound in blue with error bars indicating standard deviation representative of all observations, outbound in purple) and E2 (inbound in red, outbound in yellow) as a function of radial distance. Each symbol is an average over at least 10,000 observations and the values closest to perihelion are averaged over 60,000-230,000 observations. Error bars for E1 inbound show one s.d. of the individual observations and are representative of the variation for the other 3 phases. The uncertainty in the mean of VpT is much smaller than the symbols. Current and upcoming perihelia are shown with green triangles. Lines indicate
no rotation (dashed), rigid co-rotation everywhere (red), and the axisymmetric Weber-Davis model (blue).
and other ions. Future PSP orbits will clarify the extent to which these large rotational flows characterize other solar-wind 104
streams. These orbits will also provide critical additional diagnostics of the state of the plasma, including turbulence, velocity 105
spikes, temperature anisotropy, and particle velocity-distribution functions, at heliocentric distances as small as 9.86RS.
106
References
107
1. Parker, E. N. Dynamics of the Interplanetary Gas and Magnetic Fields. Astrophys. J. 128, 664–676 (1958). 108
2. Gringauz, K. I., Bezrokikh, V. V., Ozerov, V. D. & Rybchinskii, R. E. A Study of the Interplanetary Ionized Gas, High-109
Energy Electrons and Corpuscular Radiation from the Sun by Means of the Three-Electrode Trap for Charged Particles on 110
the Second Soviet Cosmic Rocket. Soviet Physics Doklady 5, 361–364 (1960). 111
3. Bonetti, A., Bridge, H. S., Lazarus, A. J., Rossi, B. & Scherb, F. Explorer 10 Plasma Measurements. J. Geophys. Res. 68, 112
4017–4063 (1963). 113
4. Marsch, E. et al. Solar wind protons - Three-dimensional velocity distributions and derived plasma parameters measured 114
between 0.3 and 1 AU. J. Geophys. Res. 87, 52–72 (1982). 115
5. Belcher, J. W. & Davis, J., Leverett. Large-amplitude Alfv´en waves in the interplanetary medium, 2. J. Geophys. Res. 76, 116
3534–3563 (1971). 117
6. Gosling, J. T., McComas, D. J., Roberts, D. A. & Skoug, R. M. A One-Sided Aspect of Alfvenic Fluctuations in the Solar 118
Wind. Astrophys. J. Lett. 695, L213–L216 (2009). 119
7. Horbury, T. S., Matteini, L. & Stansby, D. Short, large-amplitude speed enhancements in the near-Sunfast solar wind. 120
Mon. Not. Roy. Astron. Soc.478, 1980–1986 (2018). 121
8. Pizzo, V. et al. Determination of the solar wind angular momentum flux from the HELIOS data - an observational test of 122
the Weber and Davis theory. apj 271, 335–354 (1983). 123
9. Fox, N. J. et al. The Solar Probe Plus Mission: Humanity’s First Visit to Our Star. Space Sci. Rev. 204, 7–48 (2016). 124
10. Kasper, J. C. et al. Solar Wind Electrons Alphas and Protons (SWEAP) Investigation: Design of the Solar Wind and 125
Coronal Plasma Instrument Suite for Solar Probe Plus. Space Sci. Rev. 204, 131–186 (2016). 126
11. Bale, S. D. et al. The FIELDS Instrument Suite for Solar Probe Plus. Measuring the Coronal Plasma and Magnetic Field, 127
Plasma Waves and Turbulence, and Radio Signatures of Solar Transients. Space Sci. Rev. 204, 49–82 (2016). 128
12. Schatzman, E. A theory of the role of magnetic activity during star formation. Annales d’Astrophysique 25, 18–29 (1962). 129
13. Weber, E. J. & Davis, J., Leverett. The Angular Momentum of the Solar Wind. Astrophys. J. 148, 217–227 (1967). 130
14. Finley, A. J., Matt, S. P. & See, V. The Effect of Magnetic Variability on Stellar Angular Momentum Loss. I. The Solar 131
Wind Torque during Sunspot Cycles 23 and 24. Astrophys. J. 864, 125 (2018). 132
15. Bale, S. D. et al. The magnetic structure and electrodynamics of the emerging solar wind. Nature (Submitted). 133
16. Elliott, H. A., Henney, C. J., McComas, D. J., Smith, C. W. & Vasquez, B. J. Temporal and radial variation of the solar 134
wind temperature-speed relationship. Journal Geophysical Research: Space Physics 117 A09102 (2012). 135
17. Pilipp, W. G. et al. Characteristics of electron velocity distribution functions in the solar wind derived from the helios 136
plasma experiment. jgr 92, 1075–1092 (1987). 137
18. McComas, D. M. et al. Energetic Particle Environment near the Sun from Parker Solar Probe. Nature (Submitted). 138
19. Vasquez, B. J. & Hollweg, J. V. Formation of arc-shaped Alfv´en waves and rotational discontinuities from oblique linearly 139
polarized wave trains. J. Geophys. Res. 101, 13527–13540 (1996). 140
20. Bruno, R. & Carbone, V. The Solar Wind as a Turbulence Laboratory. Living Reviews Solar Physics 10, 2 (2013). 141
21. Richardson, I. G. Solar wind stream interaction regions throughout the heliosphere. Living Reviews Solar Physics 15, 1 142
(2018). 143
22. Axford, W. I. The Solar Wind. Solar Physics 100, 575–586 (1985). 144
Figure Legends
145
Figure 1: An overview of the first encounter with the Sun by Parker Solar Probe. 146
(a) relative occurrence rate of proton radial speed VpRin one hour intervals. Red triangles are the start and end of the
147
high-rate data collection below 54RSand the green triangle indicates perihelion at 35.7Rs. (b) same for transverse component
148
VpTof proton velocity in solar equatorial plane, (c) proton number density np, (d) proton temperature Tp, (e) radial component
149
of magnetic field BR, (f) electron pitch-angle distribution, and (g) 20 − 200 keV proton rate. The date, distance r, and latitude λ
150
relative to the solar equator are indicated at daily intervals. 151
Figure 2: Solar wind fluctuations near closest approach. 152
Near-Sun fluctuations meet Alfv´enic criteria, but are organized into structures and contain density enhancements. (a) 153
magnitude of VpR(blue) and angle θBRof B from radial outwards, (b) magnitudes of np(green), B (red), and proton thermal
154
speed wp(yellow); (c-e) variation of each vector component of velocity (blue) and magnetic field (red) in the R, T , and N
155
directions. There is a baseline solar wind speed with ≈ 300km/s and jets where Vpjumps by ≈ 100km/s. The fluctuations are
156
highly Alfv´enic, with equal energy in field and flow, but organized into structures instead of randomly distributed, and there is 157
evidence of compressions. 158
Figure 3: A closer look at a velocity spike. 159
The same formatting is used as in Figure 2, but focused on a single 1,000 second interval. The left blue region indicates the 160
105 s period when PSP moved from the ambient plasma into the spike. The central core of the spike is indicated by the grey 161
region and lasted for 325s, characterized by steady but disturbed flow and field with a large rotation in B to θB∼ 70◦, a jump in
162
flow to 343 km s−1. Return from the core spike into ambient solar wind is marked by the second blue region and took 30s. 163
Figure 4: Large circulation of solar wind seen near Sun. 164
Averaged rotational flow, VpT, over 1.75RSintervals during E1 (inbound in blue with error bars indicating standard deviation
165
representative of all observations, outbound in purple) and E2 (inbound in red, outbound in yellow) as a function of radial 166
distance. Each symbol is an average over at least 10,000 observations and the values closest to perihelion are averaged over 167
60,000-230,000 observations. Error bars for E1 inbound show one s.d. of the individual observations and are representative 168
of the variation for the other 3 phases. The uncertainty in the mean of VpT is much smaller than the symbols. Current and
169
upcoming perihelia are shown with green triangles. Lines indicate no rotation (dashed), rigid co-rotation everywhere (red), and 170
the axisymmetric Weber-Davis model (blue). 171
Extended Data Figure 1: An overview of the second encounter with the Sun by Parker Solar Probe. 172
In the same format as Fig.1. Spikes in the velocity are again seen coincident with the magnetic field reversals, but the jump 173
in speed is smaller, likely because the Alfv´en speed was slower in E2 than E1. The density at perihelion is substantially lower. 174
Extended Data Figure 2: Schematic of an ”S-shaped” magnetic structure creating a field reversal, heat flux reversal, and 175
spike in velocity. 176
This figure illustrates the possible geometry of an ”S-shaped” propagating Alfv´enic disturbance (gray box) and how it 177
would appear to the spacecraft (black square) as it flew through the spike on the green trajectory. The light lines with arrows 178
indicate the configuration of the magnetic field, with all field lines ultimately pointed back to the Sun. Arrows at each black 179
square indicate the vector velocity (blue), electron strahl (orange), and magnetic field (red) seen by the spacecraft. If this was a 180
purely Alfv´enic structure then the spike would move away from the Sun anti-parallel to B at the local Alfv´en speed, CA. In the
181
frame of the spike the shape of the structure would be static, with plasma flowing in along field lines on the upper left and 182
through the spike, emerging at the lower right, always flowing at CA. In the frame of the spacecraft, the constant flow along
183
field lines in the propagating spike frame would translate into a radial increase of V by CAwhen B was perpendicular to R, and
184
a maximum jump of 2CAwhen B was completely inverted. Since the heat flux escapes away from the Sun, it would rotate so as
185
to always be anti-parallel to B and appear to be flowing back to the Sun at the center of this disturbance. 186
Methods
187
Data Collection and Analysis The data presented in this letter were collected over the course of the first two encounters of 188
the Sun by Parker Solar Probe in November 2018 and April 2019. This study makes use of all of the in situ instruments on 189
the spacecraft. Thermal plasma properties are measured by the PSP SWEAP instrument suite10, including the Solar Probe 190
(SPC) Cup, SPAN electron, and SPAN ion plasma data. Magnetic field data from the outboard FIELDS magnetometer was also 191
used11,15, along with energetic particle rates as seen by IS IS18. SPC measures the reduced distribution function of ionized 192
hydrogen and helium and the two dimensional flow angles of the ions as a function of energy/charge. These measurements are 193
performed at least once per second and typically more than four times per second throughout the encounter phase of each orbit 194
(below 0.25 au or 54 Rs). This paper uses moments of the entire SPC proton distribution function to calculate a total effective
195
proton velocity, density, and radial component of the temperature. While the SPAN ion sensor generally did not view the peak 196
of the proton velocity distribution, the overlapping region seen by SPAN and SPC has been compared to confirm that there are 197
no gross offsets in calibration or derived plasma properties such as velocity, but this technique will be more accurate when the 198
solar wind flows into SPAN closer to the Sun. Observations of electrons with a center energy of 314 eV and width of 22 eV by 199
the two SPAN electron sensors were combined, along with the FIELDS determination of the magnetic field direction, to create 200
the electron pitch angle distributions. 201
All underlying data are being archived and will be available for download at the NASA Space Physics Data Facility in 202
November 201923. Additional SWEAP data and information are available at the SWEAP web page24. Data were analyzed and 203
graphics developed in the Interactive Data Language (IDL). 204
Statistics The distributions of plasma properties in Fig. 1and Extended Data Figure 1 were produced with one hour 205
time resolution. During the encounters the time resolution of the plasma instrument ranged from slightly more than one 206
measurement per second to more than four measurements per second, so each column in those panels represents the distribution 207
of approximately 3,600-14,400 measurements. All error bars indicate one standard deviation (s.d.) of the measurements from 208
the mean. At least 10,000 and generally more than 80,000 observations are used in calculating the mean transverse flow VpTin
209
Figure 4. 210
Estimates of Uncertainty The absolute accuracy of the Solar Probe Cup (SPC) ion measurements are summarized here. 211
As verified in ground testing, the absolute accuracy for VpRis less than 0.01% over a measurable range of approximately 119
212
km/s to 1065 km/s. The absolute accuracy in temperature is similarly negligible over a measurable range of approximately 213
7.3 kK to 21.1 MK (i.e. thermal speeds of 11 km/s to 600 km/s). Speeds and temperatures at the extremes of these ranges 214
are subject to systematic considerations, but no such measurements have been presented here. The accuracy of the density 215
measurement is determined by comparison with the plasma frequency as observed by FIELDS11. Thus the absolute accuracy 216
of the SPC density measurement is estimated at ≈ 1% and is no worse than 3%. The absolute accuracy for off-radial flow 217
components are verified via spacecraft roll maneuvers about the SPC symmetry axis. For solar wind fluxes typical of the first 218
two encounters, the uncertainty associated with this calibration corresponds to a typical absolute accuracy of ≈0.5 degrees. 219
For 400 km s−1solar wind this corresponds to an expected error in VpT of 3 − 4 km s−1, which is much smaller than the net
220
rotational flow observed. 221
Signatures of Alfv´enic Fluctuations In discussing Fig.2we stated that the correlation of fluctuations in components 222
of B and V were generally indicative of outward propagating Alfv´en waves. Consider vector waves or fluctuations ∆V and 223
∆B superimposed on a steady background B◦and V◦. In the long wavelength fluid magnetohydrodynamic (MHD) limit
224
Alfv´en waves propagate exactly parallel or anti-parallel to B◦, are dispersionless and do not compress the plasma, and there
225
is a simple linear relationship ∆B = ±DA∆V, where DA= (np+ 4nα)0.5Θ/21.8 (nT km−1s), densities are in units of cm−3,
226
and Θ = (1 − βk+ β⊥)−0.55. Here Θ is a correction for thermal pressure anisotropy where βkis the ratio of parallel plasma
227
pressure to magnetic pressure and β⊥is the ratio of perpendicular plasma pressure to B. For this period we find that on average
228
np= 220 cm−3, βk= 0.202, and β⊥= 0.315. SPC and SPAN were not configured optimally to measure the ionized helium
229
abundance nα, so assuming the typical range 0.5 < nα/np< 4.5% we expect DA= 0.68 − 0.74 (nT km−1s). We find DAfor
230
each of the RT N components to be 0.71, 1.09, 0.70 (nT km−1s), so the R and N components are exactly within the expected 231
range and the fluctuations in the T direction are about 33% higher. It is common for the DAto be different for each component 232
of the velocity5. We then used the calculated value of D
Ato rescale the range of the vector components of B so they should
233
overlap with V if the fluctuations were purely Alfv´enic. The sign of the relation between ∆B and ∆V is given by the sign of 234
−k · B◦, where k is the wavevector and gives the direction of propagation, and B is an average direction of the field over a long
235
time scale. Since the ambient direction of the magnetic field outside the large amplitude fluctuations points towards the Sun and 236
the correlations are overwhelmingly positive this means we are seeing outward waves. 237
Identification of velocity spikes. Isolated velocity spikes were identified by looking for all intervals in each encounter 238
where the orientation of the magnetic field started in the quiet configuration pointed nearly towards the Sun, rotated more than 239
45◦away from the quiet configuration for at least 10 seconds, and then returned back to the original direction. Candidate events 240
were then examined manually to identify starting and ending times. 241
Methods References
242
23. NASA’s Space Physics Data Facilityhttps://spdf.gsfc.nasa.gov/. 243
244
24. The SWEAP Suite on Paker Solar Probehttps://www.cfa.harvard.edu/sweap. 245
Acknowledgements
246
The SWEAP Investigation and this publication are supported by the PSP mission under NASA contract NNN06AA01C. The 247
SWEAP team expresses its gratitude to the scientists, engineers, and administrators who have made this project a success, 248
both within the SWEAP institutions and from NASA and the project team at JHU/APL. J.C.K. acknowledges support of the 249
2019 Summer School at the Center for Computational Astrophysics, Flatiron Institute. The Flatiron Institute is supported by 250
the Simons Foundation. S.D.B. acknowledges the support of the Leverhulme Trust Visiting Professorship program. TH was 251
supported by UK STFC ST/S0003641/1. 252
Author contributions statement
253
J.C.K. is the SWEAP Principal Investigator and led the data analysis and writing of this letter. S.D.B. is the FIELDS PI and a 254
SWEAP Co-Investigator and provided the magnetic field observations. J.W.B. leads the US group where the solar wind Faraday 255
cup was developed and provided guidance on identifying Alfv´enic fluctuations. M.B. provided a pre-amplifier ASIC used 256
within the SPAN electron instruments. A.W.C. is the Solar Probe Cup instrument scientist and ensured that the instrument met 257
its performance requirements and was calibrated. B.D.G.C. contributed theoretical calculations and writing to the manuscript. 258
D.W.C. D.G. was the institutional lead at NASA MSFC responsible for materials testing and calibration of SPC. S.P.G. provided 259
recommendations on measurement requirements in order to detect instabilities. L.G. provided related solar observations and 260
results. J. H. contributed to the analysis of the electron observations and to the manuscript. G.H. provided a time of flight 261
ASIC to reduce the size and power of the SPAN ion instrument. T.H. participated in the analysis of the Alfv´enic spikes. 262
Q.H. identified magnetic flux ropes. K.G.K. contributed to writing the manuscript and provided warm plasma growth rate 263
calculations. K.E.K. led the SWEAP Science Operations Center and coordinated observing plans between the instruments 264
and the project. M.V. contributed to writing the manuscript and discussing the relationship between Alfv´enic fluctuations and 265
angular momentum. D.L. is the institutional lead at Berkeley responsible for the implementation of the SPAN instruments and 266
the SWEAP Electronics Module suite-wide computer. R.L. is the SPAN ion instrument scientist. B.A.M. performed simulations 267
of the fields of view of the SWEAP ion instruments and their probabilities of detecting the solar wind. B.L. identified flux 268
ropes and other signatures of coronal mass ejections in the data. P.L. coordinated solar furnace testing of the Solar Probe Cup 269
materials before launch. M.M. absolute calibration, quality of vdfs. N.P. Numerical simulations. J.D.R. FC design, radial 270
variation. R.K.S. Electron PADs. J.T.S. field rotation causes. M.L.S. Overall data pipeline for SWEAP, SPC high level data 271
products. A.S. estimated the location of the heliospheric current sheet. P.W. set up the SPC calibration at MSFC and then 272
became SPAN electron instrument scientist at Berkeley . K.W. arranged the SPC calibration at MSFC. G.P.Z. leads the SWEAP 273
theory team. R.J.M. leads the FIELDS fluxgate magnetometer. D.J.M. is the IS IS PI. He provided the energetic particle data. 274
R.M. Lead for the EPI-Lo energetic particle instrument. M.P. FIELDS SOC lead. N.R. PSP Project Scientist and reviewed 275
jets and similar coronal transients. N.A.S. runs the IS IS Science Operations Center. All authors participated in planning 276
the observations and data collection, reviewed and discussed the observations, and read, provided feedback, and accepted the 277
contents of the manuscript. 278
Author Information
279
Correspondence and requests for materials should be addressed to Justin Kasper (jckasper@umich.edu). Reprints and 280
permissions information is available at www.nature.com/reprints. The authors declare no competing financial interests. Readers 281
are welcome to comment on the online version of the paper. Publisher’s note: Springer Nature remains neutral with regard to 282
jurisdictional claims in published maps and institutional affiliations. None of the authors has a competing financial interest in 283
this work. 284
Extended Data – Online Supporting Materials
285
286
Extended Data Figure 1: An overview of the second encounter with the Sun by Parker Solar Probe. 287
In the same format as Fig.1. Spikes in the velocity are again seen coincident with the magnetic field reversals. A net 288
positive VpT is seen at the second perihelion.
289
290
Extended Data Figure 2: Schematic of an “S-shaped” magnetic structure creating a field reversal, heat flux reversal, and 291
spike in velocity. 292
This figure illustrates the possible geometry of an ”S-shaped” propagating Alfv´enic disturbance (gray box) and how it 293
would appear to the spacecraft (black square) as it flew through the spike on the green trajectory. The light lines with arrows 294
indicate the configuration of the magnetic field, with all field lines ultimately pointed back to the Sun. Arrows at each black 295
square indicate the vector velocity (blue), electron strahl (orange), and magnetic field (red) seen by the spacecraft. If this was a 296
purely Alfv´enic structure then the spike would move away from the Sun anti-parallel to B at the local Alfv´en speed, CA. In the
297
frame of the spike the shape of the structure would be static, with plasma flowing in along field lines on the upper left and 298
through the spike, emerging at the lower right, always flowing at CA. In the frame of the spacecraft, the constant flow along
299
field lines in the propagating spike frame would translate into a radial increase of V by CAwhen B was perpendicular to R, and
300
a maximum jump of 2CAwhen B was completely inverted. Since the heat flux flows away from the Sun, it would rotate so as to
301
always be anti-parallel to B and appear to be flowing back to the Sun at the center of this disturbance. 302