HAL Id: hal-00577004
https://hal.archives-ouvertes.fr/hal-00577004
Submitted on 16 Mar 2011HAL is a multi-disciplinary open access
archive for the deposit and dissemination of sci-entific research documents, whether they are pub-lished or not. The documents may come from teaching and research institutions in France or abroad, or from public or private research centers.
L’archive ouverte pluridisciplinaire HAL, est destinée au dépôt et à la diffusion de documents scientifiques de niveau recherche, publiés ou non, émanant des établissements d’enseignement et de recherche français ou étrangers, des laboratoires publics ou privés.
disease
Abderrahim Oussalah, Valérie Laurent, Olivier Bruot, Jean-Louis Gueant,
Denis Régent, Marc-André Bigard, Laurent Peyrin-Biroulet
To cite this version:
Abderrahim Oussalah, Valérie Laurent, Olivier Bruot, Jean-Louis Gueant, Denis Régent, et al.. Addi-tional benefit of procalcitonin to C-reactive protein for assessing disease activity and severity in Crohn’s disease: Procalcitonin in inflammatory bowel diseases. Alimentary Pharmacology and Therapeutics, Wiley, 2010, 32 (9), pp.1135. �10.1111/j.1365-2036.2010.04459.x�. �hal-00577004�
For Peer Review
Additional benefit of procalcitonin to C-reactive protein for assessing disease activity and severity in Crohn's disease
Journal: Alimentary Pharmacology & Therapeutics Manuscript ID: APT-0611-2010.R1
Wiley - Manuscript type: Original Scientific Paper Date Submitted by the
Author: 26-Aug-2010
Complete List of Authors: Oussalah, Abderrahim; University Hospital of Nancy, Inserm, U954 and Department of Hepato-Gastroenterology
LAURENT, Valérie; University Hospital of Nancy, Departement of Radiology
BRUOT, Olivier; University Hospital of Nancy, Departement of Radiology
GUEANT, Jean-Louis; INSERM U954
Régent, Denis; University Hospital of Nancy, Departement of Radiology
BIGARD, Marc-André; UNIVERSITY HOSPITAL BRABOIS, Gastroenterology
Peyrin-Biroulet, Laurent; University Hospital of Nancy, Hepato-gastroenterology
Keywords:
Crohn’s disease < Disease-based, Inflammatory bowel disease < Disease-based, Ulcerative colitis < Disease-based, Inflammation < Topics
For Peer Review
Page 1 sur 23
Additional benefit of procalcitonin to C-reactive protein for assessing
disease activity and severity in Crohn's disease
Running title: Procalcitonin in inflammatory bowel diseases
Abderrahim Oussalah1, Valérie Laurent2, Olivier Bruot2, Jean-Louis Guéant3, Denis Régent2, Marc-André Bigard1, Laurent Peyrin-Biroulet1
1
Inserm U954 and Department of Hepato-Gastroenterology, University Hospital of Nancy, Vandoeuvre-lès-Nancy;
2
Departement of Radiology, University Hospital of Nancy, Vandoeuvre-lès-Nancy, 3
Inserm U954, Nutrition, Genetics, and Environmental Risk Exposure, Faculty of Medicine of Nancy, Vandoeuvre-lès-Nancy, France.
Keywords: serum procalcitonin level; Crohn’s disease; ulcerative colitis; inflammatory bowel diseases.
Correspondence: Prof. Laurent Peyrin-Biroulet, MD, PhD Department of Hepato-Gastroenterology, University Hospital of Nancy-Brabois,
Allée du Morvan, 54511, Vandoeuvre-lès-Nancy, FRANCE Phone: + 33 3 83 15 36 31 Fax: + 33 3 83 15 36 33 E-mail: peyrinbiroulet@gmail.com 3 4 5 6 7 8 9 10 11 12 13 14 15 16 17 18 19 20 21 22 23 24 25 26 27 28 29 30 31 32 33 34 35 36 37 38 39 40 41 42 43 44 45 46 47 48 49 50 51 52 53 54 55 56 57 58 59 60
For Peer Review
Page 2 sur 23 ABSTRACT
Background:
Serum procalcitonin level (SPL) may reflect non-infectious inflammation. Aim:
To assess the correlation of SPL with clinical, biological, endoscopic and radiological markers of disease activity in inflammatory bowel diseases (IBD) and to evaluate the additional diagnostic benefit of measuring SPL to that of C-reactive protein (CRP) for disease
activity appraisal.
Methods:
We performed a prospective observational study. Spearman’s rank correlation and receiver
operating characteristic analysis were used to evaluate correlation and diagnostic accuracy,
respectively.
Results:
In Crohn’s disease (CD) (n=30), SPL was strongly correlated with clinical, biological, endoscopic and radiological disease activity markers. In CD, a SPL >0.14 µg/L demonstrated a high accuracy for detecting severe disease (Sensitivity=100%; Specificity=96%; AUROC=0.963; P=0.0001). The diagnostic accuracy of the ‘SPL-CRP strategy’ (CRP >5 mg/L and SPL >0.05 µg/L) was significantly superior to that of CRP alone for diagnosing
severe CD (AUROC=0.783 versus 0.674; P=0.01). In ulcerative colitis (UC) (n=27), SPL was correlated with CRP and with endoscopic and radiological disease activity markers.
Conclusions:
In CD, the SPL was correlated with all disease activity markers and a cut-off of 0.14 µg/L could distinguish severe forms of the disease. The ‘SPL-CRP strategy’ was superior to CRP alone for diagnosing active or severe CD.
3 4 5 6 7 8 9 10 11 12 13 14 15 16 17 18 19 20 21 22 23 24 25 26 27 28 29 30 31 32 33 34 35 36 37 38 39 40 41 42 43 44 45 46 47 48 49 50 51 52 53 54 55 56 57 58 59 60
For Peer Review
Page 3 sur 23 INTRODUCTION
Procalcitonin, a prohormone of 116 amino acids is the precursor for the calcium homeostasis hormone, calcitonin, which is found in the thyroid C cells and the pulmonary endocrine cells.1 It has been found to circulate at very low concentrations in normal serum and is presumably produced by the neuroendocrine cells in the thyroid gland and in the lungs.1 Procalcitonin plays a major role in systemic inflammation and induces a dose-dependent increase in TNFα secretion.2 In a study on blood of normal human volunteers, recombinant human procalcitonin had an inhibitory effect on leukocyte migration with marked malfunction of neutrophils that is known to occur during sepsis.2 Data from experimental models demonstrated that human recombinant procalcitonin induced a dose-dependent increase in leukocyte-derived tumour
necrosis factor alpha (TNFα) secretion from isolated lymphocytes.2 Current evidences indicate that mediators such as TNFα, as well as interleukin (IL)-1b and IL-6, comprise the
specific proximate stimuli to hyperprocalcitonaemia.3, 4 TNFα is a potent stimulant of procalcitonin production and may further reinforce the procalcitonin levels in a
self-perpetuating cascade fashion.3, 4
Multiple studies have demonstrated that serum levels of procalcitonin are markedly increased in humans with severe infection.5 Procalcitonin has also evaluated in chronic inflammatory and autoimmune conditions as a marker of disease activity.6-8 Interestingly, in patients with Wegener's granulomatosis serum procalcitonin level (SPL) was markedly elevated in patients with highly active disease in comparison with those with inactive disease.6 In children with active autoimmune processes, slight elevation of procalcitonin concentration was observed without any evidence of bacterial infection.7
In patients with inflammatory bowel diseases (IBD), the association of procalcitonin with disease activity remains poorly investigated. Two studies in IBD patients demonstrated that procalcitonin had good diagnostic value for differentiating flares of IBD from self-limited
3 4 5 6 7 8 9 10 11 12 13 14 15 16 17 18 19 20 21 22 23 24 25 26 27 28 29 30 31 32 33 34 35 36 37 38 39 40 41 42 43 44 45 46 47 48 49 50 51 52 53 54 55 56 57 58 59 60
For Peer Review
Page 4 sur 23
colitis, but found conflicting results when evaluating procalcitonin as a biological marker of disease activity.9, 10 Only one study evaluated the diagnostic value of SPL in determining disease activity in IBD, but included a relative small number of patients with Crohn’s disease (CD), which prevents to draw conclusions.11 Furthermore, none of the aforementioned studies evaluated the correlation of procalcitonin with endoscopic and radiological markers of IBD activity.9-11 Finally, the additional diagnostic benefit of SPL evaluation to that of C-reactive protein (CRP) has never been evaluated in IBD.
The aims of this study was therefore to assess for the first time the correlation of SPL with clinical, biological, endoscopic and radiological markers of disease activity in patients with IBD and to evaluate the additional diagnostic benefit of measuring SPL to that of CRP in the assessment of disease activity in IBD.
MATERIALS AND METHODS Study design
We performed an observational study of a single-centre cohort. Data were retrieved from a prospectively maintained database.
Population studied
All consecutive patients seen between January 15, 2008 and June 1, 2010 who had concomitant clinical, biological, and radiological evaluation with or without concomitant colonoscopy during an IBD flare or to rule out active disease were included in the study. All investigations were prescribed at the discretion of the physician. Patients were included in the analysis if an intercurrent infection was ruled out by stool analysis for enteric pathogens and
Clostridium difficile toxin, and quantitative real-time polymerase chain reaction in colonic biopsies for the detection of active cytomegalovirus infection in patients with severe or
3 4 5 6 7 8 9 10 11 12 13 14 15 16 17 18 19 20 21 22 23 24 25 26 27 28 29 30 31 32 33 34 35 36 37 38 39 40 41 42 43 44 45 46 47 48 49 50 51 52 53 54 55 56 57 58 59 60
For Peer Review
Page 5 sur 23
steroid-refractory colitis. Our cohort of IBD patients is reported to The Commission Nationale
de l’Informatique et des Libertés (N°1404720) which supervises the implementation of the January 6, 1978 Act on data processing, data files, and individual liberties as amended by the August 6, 2004 Act relating to protection of individuals with regard to the processing of personal data.
Clinical and biological markers of disease activity
Clinical disease activity scores were calculated using data collected on the day of patient’s morphological evaluation: the simple clinical colitis activity index (SCCAI)12 and Truelove and Witts severity index13 in ulcerative colitis (UC) patients, and the Crohn's Disease Activity Index (CDAI)14 in CD patients. The following biological parameters were collected from electronic patients’ records: serum procalcitonin, CRP, haemoglobin, hematocrit, leukocytes, platelets, albumin, and serum iron. Of note, procalcitonin is routinely used in our department to rule out superimposed infection in all hospitalized patients with IBD. SPL are measured using automated immunofluorescent assays of procalcitonin in human serum or plasma (EDTA, heparin) samples (Brahms PCT sensitive KRYPTOR kit for Brahms KRYPTOR, Hennigsdorf, Germany) according to the supplier’s protocol. Normal SPL was defined as <0.05 µg/L according to supplier’s reference values and normal CRP level was defined as <5
mg/L.
Endoscopy
All colonic lesions were rated according to standardized scoring systems for UC and CD as routinely used in the department. In patients with UC, the severity and extent of endoscopic lesions were assessed by the Modified Baron score.15 Five endoscopic segments were defined: rectum, sigmoid, left colon, transverse colon, and right colon. The Modified Baron score was
3 4 5 6 7 8 9 10 11 12 13 14 15 16 17 18 19 20 21 22 23 24 25 26 27 28 29 30 31 32 33 34 35 36 37 38 39 40 41 42 43 44 45 46 47 48 49 50 51 52 53 54 55 56 57 58 59 60
For Peer Review
Page 6 sur 23
applied to each segment to obtain a segmental Modified Baron score. A total score was calculated from the sum of the segmental scores to obtain the total Modified Baron score. In patients with CD, the severity of endoscopic lesions was assessed by the Simplified Endoscopic Activity Score for Crohn’s Disease (SES-CD).16 Colonoscopy was considered concomitant to MR-DWI-colonography if it was performed within 48 hours after the radiological examination, without any therapeutic intervention during this interval.
Magnetic resonance colonography
The morphological evaluation of IBD patients consisted of a magnetic resonance diffusion-weighted imaging colonography (MR-DWI-colonography) without oral or rectal preparation and with or without concomitant colonoscopy as described previously.17 Radiological evaluation of disease activity was evaluated by the 6-items Magnetic resonance score (MR-score).17 The MR-score includes six radiological signs: 1) DWI hyperintensity, 2) rapid gadolinium enhancement after intravenous contrast medium administration, 3) differentiation between the mucosa-submucosa complex and the muscularis propria, 4) bowel wall thickening, 5) parietal oedema, and 6) the presence of ulceration(s). The definition of each radiological sign of the MR-score is provided as supplementary material (Supplemental Table 1 online). The presence and absence of a radiological sign in a given segment were rated ‘1’ and ‘0’, respectively. The segmental MR-score (MR-score-S) was calculated as the sum of the numerical values obtained for the six radiological signs for a given segment. The total MR-score (MR-MR-score-T) was calculated as the sum of the MR-MR-score-S in a patient, with values ranging from 0 to 30 in the case of UC and from 0 to 36 in the case of CD.
3 4 5 6 7 8 9 10 11 12 13 14 15 16 17 18 19 20 21 22 23 24 25 26 27 28 29 30 31 32 33 34 35 36 37 38 39 40 41 42 43 44 45 46 47 48 49 50 51 52 53 54 55 56 57 58 59 60
For Peer Review
Page 7 sur 23 Definition of active and severe disease
In order to achieve a pooled analysis, IBD patients were considered to have an active disease if they had a CDAI ≥150 in case of CD and in case of UC if they had ‘mild’, ‘moderate’ or ‘severe’ UC according to Truelove and Witts severity index13, and a SCCAI >5.18 Patients were considered to have severe disease if they have a CDAI ≥300 or a ‘severe’ UC according to Truelove and Witts severity index.13
Statistical analyses
Quantitative variables are described as means and standard deviation (S.D.) or as medians and percentiles (I.Q.R. for Inter Quartile Range: 25-75th) in the case of an abnormal distribution. Proportions are expressed as percentages and 95% confidence intervals. All correlations were studied using Spearman’s nonparametric correlation coefficients. The diagnostic accuracy of serum procalcitonin (µg/L) for detecting severe forms of IBD was evaluated using receiver operating characteristic (ROC) analysis according to DeLong et al19 to calculate the sensitivity, specificity, positive, and negative predictive values, and area under the receiver
operating characteristic curve (AUROC) with the associated P-value. The comparison of
AUROCs was carried out using the procedure proposed by Delong et al.19 The comparison of serum procalcitonin values between different groups of disease activity was performed using the Kruskal-Wallis test. All the reported P-values were two-sided, and P-values of <0.05 were considered statistically significant. Statistical analyses were performed using MedCalc software, version 11.3.3.0 (MedCalc Software, Mariakerke, Belgium).
3 4 5 6 7 8 9 10 11 12 13 14 15 16 17 18 19 20 21 22 23 24 25 26 27 28 29 30 31 32 33 34 35 36 37 38 39 40 41 42 43 44 45 46 47 48 49 50 51 52 53 54 55 56 57 58 59 60
For Peer Review
Page 8 sur 23 RESULTS
Between January 15, 2008 and June 1, 2010, 57 patients with a diagnosis of IBD underwent clinical, biological, endoscopic, histological and/or radiologic evaluation and could be included in the analysis. The baseline characteristics of included patients with CD (n=30) or UC (n=27) are shown in Tables 1 and 2, respectively.
Whole IBD cohort (n=57)
Comparison of serum procalcitonin levels between active and inactive inflammatory bowel diseases
The median value of SPL was significantly higher in patients with active IBD (0.10 µg/L; IQR 25-75th, 0.07 to 0.21) in comparison to those with inactive disease (0.07 µg/L; IQR 25-75th, 0.06 to 0.08) (P = 0.02) (Figure 1A). Consistently, patients with CRP level >5 mg/L exhibited significantly higher SPL (0.11 µg/L; IQR 25-75th, 0.07 to 0.21) when compared with patients with a CRP level ≤5 mg/L (0.06 µg/L; IQR 25-75th, 0.06 to 0.07) (P = 0.002) (Figure 1B).
Correlation of serum procalcitonin level with biological and radiological markers of disease activity
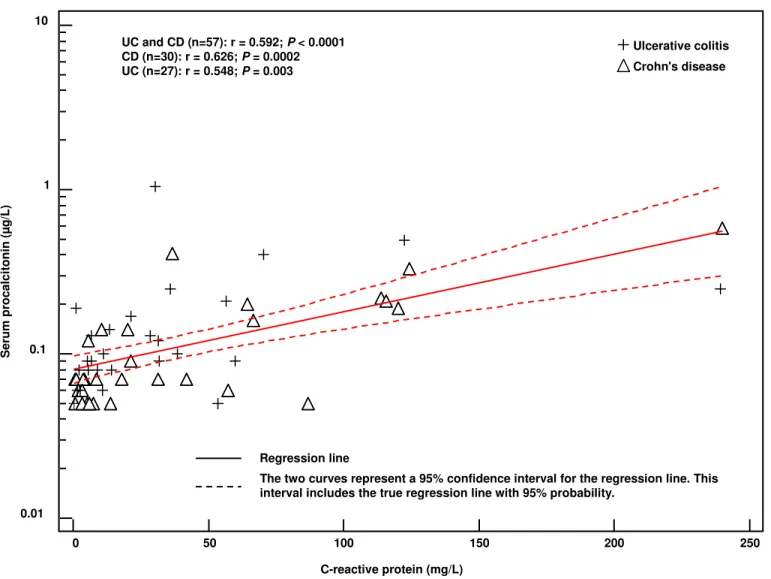
SPL was strongly correlated with CRP (r=0.592, P < 0.001) (Figure 2), albumin (r=-0.609, P < 0.001), haemoglobin (r=-0.500, P < 0.001), and MR-score (r=0.552, P < 0.001) and was significantly correlated with serum iron (r=-0.283; P = 0.03) and platelets (r=0.393, P = 0.003). SPL was not correlated with leukocytes (r=0.1, P = 0.5).
In the whole group of IBD patients, SPL was significantly correlated with CRP in patients
with active disease (Supplemental Table 2 online). In patients with inactive IBD, SPL and
3 4 5 6 7 8 9 10 11 12 13 14 15 16 17 18 19 20 21 22 23 24 25 26 27 28 29 30 31 32 33 34 35 36 37 38 39 40 41 42 43 44 45 46 47 48 49 50 51 52 53 54 55 56 57 58 59 60
For Peer Review
Page 9 sur 23
CRP were not significantly correlated; however, this result is not reliable due to the risk of
type II error related to the small sample size (n=13).
Crohn’s disease
Correlation of serum procalcitonin level with clinical, biological, endoscopic and radiological markers of activity
In patients with CD (n=30), SPL was strongly correlated with all disease activity markers namely, CDAI (r=0.545, P = 0.002), CRP (r=0.626, P = 0.0002) (Figure 2), albumin (r-0.813,
P < 0.0001), haemoglobin (r=-0.709, P < 0.0001), SES-CD (r=0.797, P = 0.0006), and MR-score (r=0.599, P = 0.0005) (Table 3). SPL was significantly correlated with CRP in patients with active CD as opposed to patients in remission (Supplemental Table 2 online).
Diagnostic accuracy of serum procalcitonin for detecting disease activity
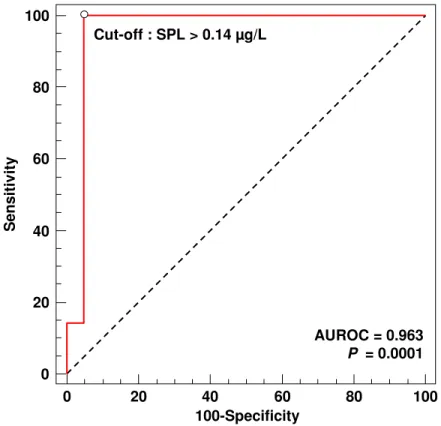
In patients with CD, using ROC analysis, a SPL >0.14 µg/L demonstrated a high accuracy for detecting severe disease as defined by a CDAI ≥300 with a sensitivity of 100%, a specificity of 96%, positive and negative predictive values of 88% and 100%, respectively, and an AUROC of 0.963 (95% Confidence Interval (CI), 0.822 to 0.999; P = 0.0001) (Table 4 and Figure 3). In CD patients, SPL >0.14 µg/L had a sensitivity of 67%, a specificity of 100%, and an AUROC of 0.815 (95% CI, 0.631 to 0.932; P = 0.0005) for detecting patients with a CRP >30mg/L (Table 4). Consistently, the median SPL was significantly higher in patients with a CDAI ≥300 (0.21 µg/L; IQR 25-75th, 0.19 to 0.30) compared with those with a CDAI <300 (0.07 µg/L; IQR 25-75th, 0.05 to 0.07) (P = 0.0002).
In comparison with a CRP cut-off of 5 mg/L, a SPL cut-off of 0.05 µg/L had the same
diagnostic accuracy (AUROC) for detecting active or severe CD (P = 0.90 and P = 0.77,
respectively). However, the combination of CRP cut-off of 5 mg/L with a SPL cut-off of 0.05
3 4 5 6 7 8 9 10 11 12 13 14 15 16 17 18 19 20 21 22 23 24 25 26 27 28 29 30 31 32 33 34 35 36 37 38 39 40 41 42 43 44 45 46 47 48 49 50 51 52 53 54 55 56 57 58 59 60
For Peer Review
Page 10 sur 23
µg/L, called the ‘SPL-CRP strategy’, yielded a better specificity for diagnosing active or
severe CD (Table 5). Moreover, the diagnostic accuracy of the SPL-CRP strategy was
significantly superior to that of CRP alone for diagnosing severe CD with an AUROC of
0.783 versus 0.674 (P = 0.01) (Table 5 and Figure 4).
Ulcerative colitis
Correlation of serum procalcitonin level with clinical, biological, endoscopic and radiological markers of activity
In patients with UC (n=27), SPL was correlated with the SCCAI (r=0.423, P = 0.03), CRP level (r=0.548, P = 0.003) and MR-score (r=0.536, P = 0.004). By contrast, SPL were not correlated with albumin, haemoglobin, and the total modified Baron score (Table 3). SPL was significantly correlated with CRP in patients with active UC as opposed to patients with
inactive UC (Supplemental Table 2 online).
Diagnostic accuracy of serum procalcitonin for detecting disease activity
In patients with UC, ROC analysis did not reveal any significant threshold of SPL for the detection of active or severe disease (P = 0.08 and P = 0.2, respectively) (Table 6). The SPL-CRP strategy did not yield a better accuracy for diagnosing active or severe UC in
comparison with CRP alone (Table 5).
DISCUSSION
This is the first study showing that SPL is correlated with clinical, biological, endoscopic and/or radiological disease activity in patients with IBD. To date three studies have evaluated procalcitonin in IBD.9-11 By pooling UC and CD patients, we found that SPL was significantly higher in patients with active IBD. These results are in line with those of a
3 4 5 6 7 8 9 10 11 12 13 14 15 16 17 18 19 20 21 22 23 24 25 26 27 28 29 30 31 32 33 34 35 36 37 38 39 40 41 42 43 44 45 46 47 48 49 50 51 52 53 54 55 56 57 58 59 60
For Peer Review
Page 11 sur 23
previously reported study.9 Consistently, by pooling UC and CD patients, SPL was significantly higher in patients with a CRP >5 mg/L and was correlated with CRP levels. This finding is also in line with the study by Oruc et al. that demonstrated a significant correlation between SPL and CRP in patients with IBD.11
When considering only patients with CD, Herrlinger et al. demonstrated that SPL were significantly correlated with the CDAI, while no correlation was found with CRP level.9 By contrast, in the study by Thia et al., SPL showed no correlation with CD activity using the Harvey-Bradshaw index (HBI).10 This discrepancy may be partly explained by the fact that CD activity has been scored with the HBI in the study by Thia et al.,10 conversely to our study and that of Herrlinger et al.9 that used the CDAI as CD activity score. In the study by Oruc et al., SPL was not correlated with CDAI.11 However, this study included only nine CD patients, which prevents any conclusion. It is noteworthy that none of the three studies9-11 had evaluated endoscopic or radiological markers of disease activity.
Our study showed that in patients with UC, SPL was correlated with the SCCAI, CRP, and the MR-score score, whereas no correlation was found with endoscopic disease activity scores. Among the three studies that evaluated SPL in IBD patients,9-11 only one has specifically evaluated the SPL in the subgroup of patients with UC, and did not show any correlation between SPL and clinical disease activity.10 This difference may be partly explained by the fact that UC activity has been scored with the Physician Global Assessment20 in the study by Thia et al.,10 conversely to our study that used the SCCAI which is a well validated disease activity index for UC.21, 22
In the study by Oruc et al. a procalcitonin cut-off value of 0.05 µg/L, found in ROC analysis, had a poor accuracy (sensitivity, 67%; specificity 42%) for detecting active IBD as defined by a CDAI >150 or a ‘moderate’ or ‘severe’ UC according to Truelove and Witts severity index.13 Importantly, by using ROC analysis, we were able to identify a SPL cut-off of 0.14
3 4 5 6 7 8 9 10 11 12 13 14 15 16 17 18 19 20 21 22 23 24 25 26 27 28 29 30 31 32 33 34 35 36 37 38 39 40 41 42 43 44 45 46 47 48 49 50 51 52 53 54 55 56 57 58 59 60
For Peer Review
Page 12 sur 23
µg/L as having a high accuracy (sensitivity, 100%; specificity, 95%) for detecting severe forms of CD as defined by a CDAI ≥300. Interestingly, by adding SPL measurement to routine CRP evaluation (The SPL-CRP strategy), we were able to double the specificity of the
SPL-CRP strategy for diagnosing active or severe forms of CD when compared to a ‘CRP
alone’-based strategy.
Overall, we found that the performance of procalcitonin for evaluating disease activity was weaker in UC compared with CD. Consistently, there was no cut-off value for SPL capable of detecting severe forms of UC in our study. This is in line with previous reports.9, 10
From a mechanistic point of view one can speculate that the best correlation of procalcitonin with the degree of activity of CD is linked to the fact that TNFα plays a central role in the pathogenesis of this disease.
In conclusion, our results indicate that procalcitonin might be useful in clinical practice to assess disease activity in patients with CD. Notably, we demonstrated for the first time that SPL was correlated with endoscopic and radiological markers of activity in CD, and with radiological activity in UC. In patients with CD, a threshold of 0.14 µg/L for procalcitonin may detect the most severe forms of the disease. The combination of procalcitonin with CRP would be more efficient than CRP alone for the diagnosis of active or severe CD. Our results need to be confirmed in independent studies.
3 4 5 6 7 8 9 10 11 12 13 14 15 16 17 18 19 20 21 22 23 24 25 26 27 28 29 30 31 32 33 34 35 36 37 38 39 40 41 42 43 44 45 46 47 48 49 50 51 52 53 54 55 56 57 58 59 60
For Peer Review
Page 13 sur 23 ACKNOWLEDGEMENTS
1. Authors' declaration of personal interests: AO, VL, OB, JLG, DR, MAB, and LPB declare no conflict of interest.
2. Declaration of funding interests: This work did not receive any financial support.
3 4 5 6 7 8 9 10 11 12 13 14 15 16 17 18 19 20 21 22 23 24 25 26 27 28 29 30 31 32 33 34 35 36 37 38 39 40 41 42 43 44 45 46 47 48 49 50 51 52 53 54 55 56 57 58 59 60
For Peer Review
Page 14 sur 23
Table 1. Baseline characteristics of patients in the Crohn’s disease group (n=30)
Crohn’s disease (n=30) n %
Montreal classification
A1 (below 16 years) 3 10
A2 (between 17 and 40 years) 20 67
A3 (above 40 years) 7 23
B1 (non-stricturing, non penetrating) 18 60
B2 (stricturing) 7 23
B3 (penetrating) 5 17
L1 (isolated ileal disease) 8 27
L2 (isolated colonic disease) 14 47
L3 (ileocolonic disease) 8 27
L4 (concomitant upper gastrointestinal disease) 2 7
P (concomitant perianal disease) 12 40
Concomitant medication(s)a
Mesalamine 8 27
Oral or intravenous corticosteroids 11 37
Azathioprine 10 33
Methotrexate 1 3
Tumour Necrosis Factor antagonists 5 17
Male gender 11 37
Tobacco use 9 30
Previous abdominal IBD-related surgery 10 33
Mean Standard deviation
Patient age at IBD diagnosis (years) 32 15
Patient age at inclusion (years) 38 16
Haemoglobin (g/dL) 12.0 2.0
Hematocrit (g/dL) 35.8 5.5
Platelets (x 109/L) 402 129
Albumin (g/L) (n=18) 34.8 8.9
Serum iron (mg/L) 0.54 0.39
Crohn’s disease activity indexb 213 138
SES-CDc (n=14) 12 11
Median IQR 25-75th
Disease duration at inclusion (months) 40 19 to 109
C-reactive protein (mg/L) 15.9 4.3 to 64.4
Leukocytes (x 109/L) 9.510 7.720to 12.030
Magnetic-Resonance score (0-36)d 10 6 to 15
NOTE. IBD: Inflammatory bowel diseases; SES-CD: Simplified Endoscopic Activity Score for Crohn’s Disease; IQR: Interquartile range 25-75th percentile.
a
A patient may receive more than one concomitant medication b
Clinical evaluation of disease activity c
Endoscopic evaluation of disease activity d
Radiological evaluation of disease activity
3 4 5 6 7 8 9 10 11 12 13 14 15 16 17 18 19 20 21 22 23 24 25 26 27 28 29 30 31 32 33 34 35 36 37 38 39 40 41 42 43 44 45 46 47 48 49 50 51 52 53 54 55 56 57 58 59 60
For Peer Review
Page 15 sur 23
Table 2. Baseline characteristics of patients in the ulcerative colitis group (n=27)
Ulcerative colitis (n=27) n %
Ulcerative colitis topography according to Montreal classification
E1 (Ulcerative proctitis) 1 4
E2 (Left sided ulcerative colitis) 7 26 E3 (Extensive ulcerative colitis) 19 70 Concomitant medication(s)a
Mesalamine 10 37
Oral or intravenous corticosteroids 10 37
Azathioprine 7 26
Methotrexate 0 –
Cyclosporine 4 15
Tumour Necrosis Factor antagonists 6 22
Male gender 14 52
Tobacco use 2 7
Previous abdominal IBD-related surgery 0 –
Mean Standard deviation
Patient age at inclusion (years) 37 14
Haemoglobin (g/dL) 11.3 2.1
Hematocrit (g/dL) 34.0 5.9
Leukocytes (x 109/L) 9.200 3.708
Platelets (x 109/L) 430 151
Albumin (g/L) (n=24) 32.3 8.0
Simple clinical colitis activity indexb 7 4 Total modified Baron scorec (n=15) 8 5 Magnetic-Resonance score (0-30)d 18 8
Median IQR 25-75th
Patient age at IBD diagnosis (years) 28 23 to 36 Disease duration at inclusion (months) 58 19 to 127 C-reactive protein (mg/L) 14.2 6.0 to 38.0
Serum iron (mg/L) 0.33 0.21 to 0.64
NOTE. IBD: Inflammatory bowel diseases; IQR: Interquartile range 25-75th percentile. a
A patient may receive more than one concomitant medication b
Clinical evaluation of disease activity c
Endoscopic evaluation of disease activity d
Radiological evaluation of disease activity
3 4 5 6 7 8 9 10 11 12 13 14 15 16 17 18 19 20 21 22 23 24 25 26 27 28 29 30 31 32 33 34 35 36 37 38 39 40 41 42 43 44 45 46 47 48 49 50 51 52 53 54 55 56 57 58 59 60
For Peer Review
Page 16 of 23
Table 3. Correlation of serum procalcitonin concentration (µg/L) with clinical, biological, endoscopic and radiological markers of disease
activity in patients with inflammatory bowel disease
CD group (n=30) UC group (n=27)
rhoa 95% CI P-valuea rhoa 95% CI P-valuea
Clinical marker of disease activity
Crohn’s disease activity index 0.545 0.230 to 0.757 0.002 – – –
Simple clinical colitis activity index – – – 0.423 0.051 to 0.692 0.03
Biological markers of disease activity
C-reactive protein (mg/L) 0.626 0.343 to 0.805 0.0002 0.548 0.212 to 0.768 0.003
Albumin (g/L) -0.813 -0.928 to -0.557 < 0.0001 -0.333 -0.649 to 0.081 0.1
Haemoglobin (g/dL) -0.709 -0.852 to -0.469 < 0.0001 -0.137 -0.492 to 0.256 0.5
Endoscopic markers of disease activity
SES-CD 0.797 0.462 to 0.933 0.0006 – – –
Total modified Baron score – – – 0.454 -0.076 to 0.784 0.09
Radiological marker of disease activity
MR-score 0.599 0.304 to 0.789 0.0005 0.536 0.195 to 0.761 0.004
NOTE. SES-CD: Simplified Endoscopic Activity Score for Crohn’s Disease; MR-score: Magnetic-Resonance score.
a
Spearman's rho rank correlation coefficient.
3 4 5 6 7 8 9 10 11 12 13 14 15 16 17 18 19 20 21 22 23 24 25 26 27 28 29 30 31 32 33 34 35 36 37 38 39 40 41 42 43 44 45 46 47 48 49 50 51 52 53 54 55 56 57 58 59 60
For Peer Review
Page 17 of 23
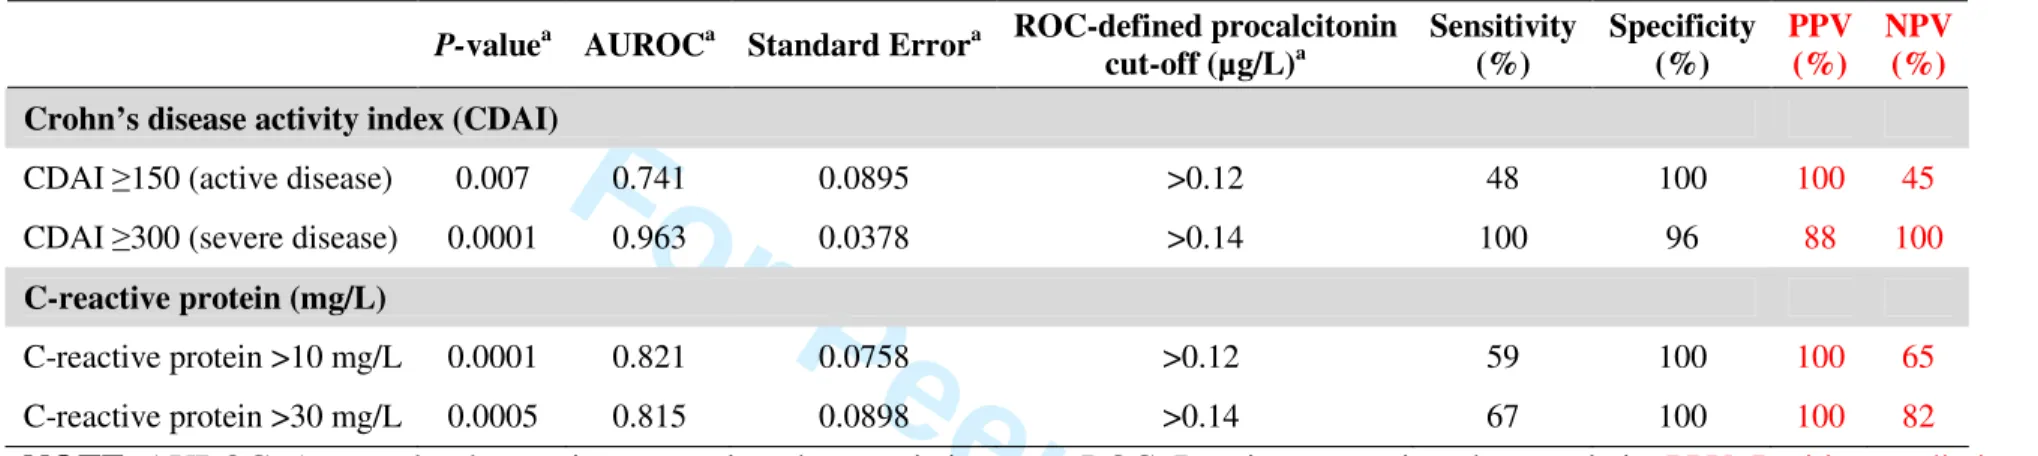
Table 4. Diagnostic accuracy of serum procalcitonin (µg/L) according to ‘a priori’ defined cut-offs for disease activity in patients with
Crohn’s disease
P-valuea AUROCa Standard Errora ROC-defined procalcitonin cut-off (µg/L)a Sensitivity (%) Specificity (%) PPV (%) NPV (%) Crohn’s disease activity index (CDAI)
CDAI ≥150 (active disease) 0.007 0.741 0.0895 >0.12 48 100 100 45
CDAI ≥300 (severe disease) 0.0001 0.963 0.0378 >0.14 100 96 88 100
C-reactive protein (mg/L)
C-reactive protein >10 mg/L 0.0001 0.821 0.0758 >0.12 59 100 100 65
C-reactive protein >30 mg/L 0.0005 0.815 0.0898 >0.14 67 100 100 82
NOTE. AUROC: Area under the receiver operating characteristic curve; ROC: Receiver operating characteristic; PPV: Positive predictive value;
NPV: Negative predictive value. a
According to DeLong, et al.19
3 4 5 6 7 8 9 10 11 12 13 14 15 16 17 18 19 20 21 22 23 24 25 26 27 28 29 30 31 32 33 34 35 36 37 38 39 40 41 42 43 44 45 46 47 48 49 50 51 52 53 54 55 56 57 58 59 60
For Peer Review
Page 18 of 23
Table 5. Diagnostic accuracy of serum procalcitonin level >0.05 µg/L, C-reactive protein >5 mg/L, and their combination for detecting active or severe Crohn’s disease and ulcerative colitis CRPa SPLb CRP a and SPLb CRPa and SPLb versus CRPa
Active Crohn’s disease P-valuec
AUROC 0.574 0.597 0.716 Standard Error 0.102 0.101 0.0963 95% CI, AUROC 0.381 to 0.752 0.403 to 0.771 0.523 to 0.865 0.14 Sensitivity (%) 77 82 68 Specificity (%) 38 38 75 PPV (%) 77 78 88 NPV (%) 38 43 46
Severe Crohn’s disease P-valuec
AUROC 0.674 0.652 0.783 Standard Error 0.0508 0.0491 0.0528 95% CI, AUROC 0.479 to 0.833 0.457 to 0.816 0.595 to 0.911 0.01 Sensitivity (%) 100 100 100 Specificity (%) 35 30 57 PPV (%) 32 30 41 NPV (%) 100 100 100
Active ulcerative colitis P-valuec
AUROC 0.877 0.545 0.855 Standard Error 0.103 0.0314 0.105 95% CI, AUROC 0.694 to 0.971 0.344 to 0.737 0.666 to 0.960 0.32 Sensitivity (%) 96 9 91 Specificity (%) 80 100 80 PPV (%) 96 100 95 NPV (%) 80 20 67
Severe ulcerative colitis P-valuec
AUROC 0.692 0.503 0.657 Standard Error 0.0702 0.0525 0.0788 95% CI, AUROC 0.486 to 0.854 0.305 to 0.699 0.450 to 0.827 0.32 Sensitivity (%) 100 93 93 Specificity (%) 39 8 39 PPV (%) 64 52 62 NPV (%) 100 50 83
NOTE. AUROC: Area under the receiver operating characteristic curve; CI: Confidence
interval; PPV: Positive predictive value; NPV: Negative predictive value.
a
C-reactive protein >5 mg/L
b
Serum procalcitonin level >0.05 µg/L
c
Comparison of AUROCs according to Delong et al.19
3 4 5 6 7 8 9 10 11 12 13 14 15 16 17 18 19 20 21 22 23 24 25 26 27 28 29 30 31 32 33 34 35 36 37 38 39 40 41 42 43 44 45 46 47 48 49 50 51 52 53 54 55 56 57 58 59 60
For Peer Review
Page 19 of 23
Table 6. Diagnostic accuracy of serum procalcitonin (µg/L) according to ‘a priori’ defined cut-offs for disease activity in patients with
ulcerative colitis
P-valuea AUROCa Standard Errora ROC-defined procalcitonin cut-off (µg/L)a Sensitivity (%) Specificity (%) PPV (%) NPV (%) Ulcerative colitis activity
Active ulcerative colitisb 0.08 0.736 0.133 – – – – –
Severe ulcerative colitisc 0.2 0.648 0.111 – – – – –
C-reactive protein (mg/L)
C-reactive protein >10 mg/L 0.003 0.774 0.093 >0.09 71 80 86 62
C-reactive protein >30 mg/L 0.008 0.773 0.103 >0.19 55 100 100 76
NOTE. AUROC: Area under the receiver operating characteristic curve; ROC: Receiver operating characteristic; PPV: Positive predictive value;
NPV: Negative predictive value. a
According to DeLong, et al.19 b
‘Mild’, ‘moderate’ or ‘severe’ ulcerative colitis according to Truelove and Witts severity index13 and a SCCAI18 >5 c
According to Truelove and Witts severity index13
3 4 5 6 7 8 9 10 11 12 13 14 15 16 17 18 19 20 21 22 23 24 25 26 27 28 29 30 31 32 33 34 35 36 37 38 39 40 41 42 43 44 45 46 47 48 49 50 51 52 53 54 55 56 57 58 59 60
For Peer Review
Page 20 of 23 FIGURES LEGENDS
Figure 1. (a) Serum procalcitonin levels in patients with active or inactive inflammatory bowel disease (Patients were considered to have an active disease if they had a Crohn’s disease activity index ≥150 or a ‘mild’, ‘moderate’ or ‘severe’ ulcerative colitis according to Truelove and Witts severity index with a SCCAI >5). (b) Serum procalcitonin levels in patients with C-reactive protein level >5 mg/L or ≤5 mg/L.
Figure 2. Correlation of serum procalcitonin level (µg/L) with C-reactive protein (mg/L) in patients with inflammatory bowel diseases.
Figure 3. Accuracy of serum procalcitonin level (SPL) >0.14 µg/L for detecting severe Crohn’s disease defined as CDAI ≥300.
Figure 4. Diagnostic accuracy of serum procalcitonin level >0.05 µg/L, C-reactive protein >5 mg/L, and their combination (the SPL-CRP strategy) for detecting active or severe forms of
Crohn’s disease. 3 4 5 6 7 8 9 10 11 12 13 14 15 16 17 18 19 20 21 22 23 24 25 26 27 28 29 30 31 32 33 34 35 36 37 38 39 40 41 42 43 44 45 46 47 48 49 50 51 52 53 54 55 56 57 58 59 60
For Peer Review
Page 21 of 23 REFERENCES
1. Becker KL, Snider R, Nylen ES. Procalcitonin in sepsis and systemic inflammation: a harmful biomarker and a therapeutic target. Br J Pharmacol 2010;159(2):253-64.
2. Liappis A, Snider RH, Nylén ES, Becker KL. Human leukocyte and whole blood cytokine response to exogenous procalcitonin. Endocrine Society, P1-367, p. 250, June 2–5, Toronto, Canada.
3. Whang KT, Vath SD, Becker KL, et al. Procalcitonin and proinflammatory cytokine interactions in sepsis. Shock 2000;14(1):73-8.
4. Redl H, Schiesser A, Togel E, Assicot M, Bohuon C. Possible role of TNF on procalcitonin release in a baboon model of sepsis. Shock 2001;16(1):25-7.
5. Simon L, Gauvin F, Amre DK, Saint-Louis P, Lacroix J. Serum procalcitonin and C-reactive protein levels as markers of bacterial infection: a systematic review and meta-analysis. Clin Infect Dis 2004;39(2):206-17.
6. Moosig F, Csernok E, Reinhold-Keller E, Schmitt W, Gross WL. Elevated procalcitonin levels in active Wegener's granulomatosis. J Rheumatol 1998;25(8):1531-3. 7. Korczowski B, Kowalczyk JR, Bijak M, Rusin J. [Concentration of procalcitonin and C-reactive protein in serum and erythrocyte sedimentation rate in active autoimmune diseases in children]. Pol Merkur Lekarski 2003;15(86):155-7.
8. Quintana G, Medina YF, Rojas C, et al. The use of procalcitonin determinations in evaluation of systemic lupus erythematosus. J Clin Rheumatol 2008;14(3):138-42.
9. Herrlinger KR, Dittmann R, Weitz G, et al. Serum procalcitonin differentiates inflammatory bowel disease and self-limited colitis. Inflamm Bowel Dis 2004;10(3):229-33. 10. Thia KT, Chan ES, Ling KL, Ng WY, Jacob E, Ooi CJ. Role of procalcitonin in infectious gastroenteritis and inflammatory bowel disease. Dig Dis Sci 2008;53(11):2960-8.
3 4 5 6 7 8 9 10 11 12 13 14 15 16 17 18 19 20 21 22 23 24 25 26 27 28 29 30 31 32 33 34 35 36 37 38 39 40 41 42 43 44 45 46 47 48 49 50 51 52 53 54 55 56 57 58 59 60
For Peer Review
Page 22 of 23
11. Oruc N, Ozutemiz O, Osmanoglu N, Ilter T. Diagnostic value of serum procalcitonin in determining the activity of inflammatory bowel disease. Turk J Gastroenterol 2009;20(1):9-12.
12. Walmsley RS, Ayres RC, Pounder RE, Allan RN. A simple clinical colitis activity index. Gut 1998;43(1):29-32.
13. Truelove SC, Witts LJ. Cortisone in ulcerative colitis; final report on a therapeutic trial. Br Med J 1955;2(4947):1041-8.
14. Best WR, Becktel JM, Singleton JW. Rederived values of the eight coefficients of the Crohn's Disease Activity Index (CDAI). Gastroenterology 1979;77(4 Pt 2):843-6.
15. Feagan BG, Greenberg GR, Wild G, et al. Treatment of ulcerative colitis with a humanized antibody to the alpha4beta7 integrin. The New England journal of medicine 2005;352(24):2499-507.
16. Daperno M, D'Haens G, Van Assche G, et al. Development and validation of a new, simplified endoscopic activity score for Crohn's disease: the SES-CD. Gastrointestinal
endoscopy 2004;60(4):505-12.
17. Oussalah A, Laurent V, Bruot O, et al. Diffusion-weighted magnetic resonance without bowel preparation for detecting colonic inflammation in inflammatory bowel disease.
Gut 2010;59(8):1056-65.
18. Jowett SL, Seal CJ, Phillips E, Gregory W, Barton JR, Welfare MR. Defining relapse of ulcerative colitis using a symptom-based activity index. Scand J Gastroenterol 2003;38(2):164-71.
19. DeLong ER, DeLong DM, Clarke-Pearson DL. Comparing the areas under two or more correlated receiver operating characteristic curves: a nonparametric approach.
Biometrics 1988;44(3):837-45. 3 4 5 6 7 8 9 10 11 12 13 14 15 16 17 18 19 20 21 22 23 24 25 26 27 28 29 30 31 32 33 34 35 36 37 38 39 40 41 42 43 44 45 46 47 48 49 50 51 52 53 54 55 56 57 58 59 60
For Peer Review
Page 23 of 23
20. Hanauer S, Schwartz J, Robinson M, et al. Mesalamine capsules for treatment of active ulcerative colitis: results of a controlled trial. Pentasa Study Group. Am J Gastroenterol 1993;88(8):1188-97.
21. Higgins PD, Leung J, Schwartz M, Mapili J, Wren PA, Zimmermann EM. The quantitative validation of non-endoscopic disease activity indices in ulcerative colitis. Aliment
Pharmacol Ther 2007;25(3):333-42.
22. Turner D, Seow CH, Greenberg GR, Griffiths AM, Silverberg MS, Steinhart AH. A systematic prospective comparison of noninvasive disease activity indices in ulcerative colitis. Clin Gastroenterol Hepatol 2009;7(10):1081-8.
3 4 5 6 7 8 9 10 11 12 13 14 15 16 17 18 19 20 21 22 23 24 25 26 27 28 29 30 31 32 33 34 35 36 37 38 39 40 41 42 43 44 45 46 47 48 49 50 51 52 53 54 55 56 57 58 59 60
For Peer Review
Figure 1a. Oussalah et al.
0.01 0.1 1 10 S e ru m p ro c a lc it o n in ( µ g /L ) active IBD inactive IBD Pa= 0.02 aKruskal-Wallis test 3 4 5 6 7 8 9 10 11 12 13 14 15 16 17 18 19 20 21 22 23 24 25 26 27 28 29 30 31 32 33 34 35 36 37 38 39 40 41 42 43 44 45 46 47 48 49 50 51 52 53 54 55 56 57 58 59 60
For Peer Review
0.01 0.1
1 10
C-reactive protein ≤ 5 mg/L C-reactive protein > 5 mg/L
S e ru m p ro c a lc it o n in ( µ g /L ) Pa= 0.002 aKruskal-Wallis test
Figure 1b. Oussalah et al.
3 4 5 6 7 8 9 10 11 12 13 14 15 16 17 18 19 20 21 22 23 24 25 26 27 28 29 30 31 32 33 34 35 36 37 38 39 40 41 42 43 44 45 46 47 48 49 50 51 52 53 54 55 56 57 58 59 60
For Peer Review
Figure 2. Oussalah et al.
0 50 100 150 200 250 0.01 0.1 1 10 S e ru m p ro c a lc it o n in ( µ g /L ) C-reactive protein (mg/L) Ulcerative colitis Crohn's disease UC and CD (n=57): r = 0.592; P < 0.0001 CD (n=30): r = 0.626; P = 0.0002 UC (n=27): r = 0.548; P = 0.003
The two curves represent a 95% confidence interval for the regression line. This interval includes the true regression line with 95% probability.
Regression line 3 4 5 6 7 8 9 10 11 12 13 14 15 16 17 18 19 20 21 22 23 24 25 26 27 28 29 30 31 32 33 34 35 36 37 38 39 40 41 42 43 44 45 46 47 48 49 50 51 52 53 54 55 56 57 58 59 60
For Peer Review
Figure 3. Oussalah et al.
0 20 40 60 80 100 0 20 40 60 80 100 100-Specificity S e n s it iv it y AUROC = 0.963 P = 0.0001 Cut-off : SPL > 0.14 µg/L 3 4 5 6 7 8 9 10 11 12 13 14 15 16 17 18 19 20 21 22 23 24 25 26 27 28 29 30 31 32 33 34 35 36 37 38 39 40 41 42 43 44 45 46 47 48 49 50 51 52 53 54 55 56 57 58 59 60
For Peer Review
0 20 40 60 80 100 0 20 40 60 80 100 100-Specificity S e n s it iv it y Procalcitonin > 0.05 µg/L C-reactive protein > 5 mg/LProcalcitonin > 0.05 µg/L and C-reactive protein > 5 mg/L
Figure 4. Oussalah et al.
3 4 5 6 7 8 9 10 11 12 13 14 15 16 17 18 19 20 21 22 23 24 25 26 27 28 29 30 31 32 33 34 35 36 37 38 39 40 41 42 43 44 45 46 47 48 49 50 51 52 53 54 55 56 57 58 59 60
For Peer Review
Supplemental Table 1. Definition of the 6 components of the Magnetic Resonance score
Radiological item of the
Magnetic resonance score Plane MR sequence Definition
Diffusion-weighted imaging
hyperintensity Axial Diffusion-weighted imaging
Presence of hyperintensity in the colonic wall segment in the DWI sequence.
Rapid gadolinium enhancement after intravenous contrast medium administration
Axial Gradient-echo T1-weighted, arterial phase Gadolinium enhancement in the arterial phase (20 to 25 seconds after gadolinium infusion)
Differentiation between the mucosa-submucosa complex and the muscularis propria
Axial Single shot fast spin echo short time echo without fat saturation
Distinction in the colonic wall between two layers: 1) mucosa-submucosa complex hyperintensity; 2) muscularis propria hypointensity.
Bowel wall thickening Axial and
coronal Gradient-echo T1-weighted, delayed phase Thickness of the colonic wall exceeding 5 mm. Parietal edema Axial and
coronal
Single shot fast spin echo, short time echo, without fat saturation
Thickness of the colonic wall exceeding 5 mm and hyperintensity of the mucosa-submucosa complex.
Ulceration Axial and
coronal
2D Steady-state, free precession imaging (Fast Imaging Employing Steady-state Acquisition, General Electric Company, US)
Loss of substance in the mucosa-submucosa complex. 3 4 5 6 7 8 9 10 11 12 13 14 15 16 17 18 19 20 21 22 23 24 25 26 27 28 29 30 31 32 33 34 35 36 37 38 39 40 41 42 43 44 45 46 47 48 49 50 51 52 53 54 55 56 57 58 59 60
For Peer Review
Supplemental Table 2. Correlation between serum procalcitonin concentration (µg/L) and C-reactive protein (mg/L) in each subgroup of
patients according to inflammatory bowel disease type and activity
Active diseasea Inactive disease
Sample size rhob 95% CI, rho P-valueb Sample size rhob 95% CI, rho P-valueb
IBD 44 0.613 0.386 to 0.770 < 0.0001 13 -0.329 -0.745 to 0.271 0.27 CD 22 0.704 0.401 to 0.868 0.0003 8 -0.378 -0.855 to 0.445 0.36 UC 22 0.514 0.118 to 0.769 0.02 5 -0.316 -0.937 to 0.785 0.60
NOTE. CI: confidence interval; IBD: Inflammatory bowel diseases; CD: Crohn’s disease; UC: Ulcerative colitis. a
Active Crohn’s disease: Crohn’s disease activity index ≥ 150; Active ulcerative colitis: ‘mild’, ‘moderate’ or ‘severe’ UC according to Truelove and Witts severity index13 and a SCCAI18 >5
b
Spearman's coefficient of rank correlation (rho)
3 4 5 6 7 8 9 10 11 12 13 14 15 16 17 18 19 20 21 22 23 24 25 26 27 28 29 30 31 32 33 34 35 36 37 38 39 40 41 42 43 44 45 46 47 48 49 50 51 52 53 54 55 56 57 58 59 60