EUROPEAN ORGANISATION FOR NUCLEAR RESEARCH (CERN)
CERN-PH-EP-2013-069
Submitted to: JHEP
Performance of jet substructure techniques for large-
R
jets in
proton–proton collisions at
√
s = 7
TeV using the ATLAS
detector
The ATLAS Collaboration
Abstract
This paper presents the application of a variety of techniques to study jet substructure. The perfor-mance of various modified jet algorithms, or jet grooming techniques, for several jet types and event topologies is investigated for jets with transverse momentum larger than 300 GeV. Properties of jets subjected to the mass-drop filtering, trimming, and pruning algorithms are found to have a reduced sensitivity to multiple proton–proton interactions, are more stable at high luminosity and improve the physics potential of searches for heavy boosted objects. Studies of the expected discrimination power of jet mass and jet substructure observables in searches for new physics are also presented. Event samples enriched in boosted W and Z bosons and top-quark pairs are used to study both the indi-vidual jet invariant mass scales and the efficacy of algorithms to tag boosted hadronic objects. The analyses presented use the full 2011 ATLAS dataset, corresponding to an integrated luminosity of 4.7± 0.1 fb−1 from proton–proton collisions produced by the Large Hadron Collider at a centre-of-mass energy of√s = 7 TeV.
Prepared for submission to JHEP
Performance of jet substructure techniques for
large-R jets in proton–proton collisions at
√
s = 7 TeV using the ATLAS detector
The ATLAS Collaboration
Abstract: This paper presents the application of a variety of techniques to study jet sub-structure. The performance of various modified jet algorithms, or jet grooming techniques, for several jet types and event topologies is investigated for jets with transverse momentum larger than 300 GeV. Properties of jets subjected to the mass-drop filtering, trimming, and pruning algorithms are found to have a reduced sensitivity to multiple proton–proton in-teractions, are more stable at high luminosity and improve the physics potential of searches for heavy boosted objects. Studies of the expected discrimination power of jet mass and jet substructure observables in searches for new physics are also presented. Event samples enriched in boosted W and Z bosons and top-quark pairs are used to study both the in-dividual jet invariant mass scales and the efficacy of algorithms to tag boosted hadronic objects. The analyses presented use the full 2011 ATLAS dataset, corresponding to an in-tegrated luminosity of 4.7± 0.1 fb−1 from proton–proton collisions produced by the Large Hadron Collider at a centre-of-mass energy of √s = 7 TeV.
Contents
1 Introduction 3
1.1 Motivation 4
1.2 Definitions 7
1.2.1 Jet algorithms 7
1.2.2 Jet properties and substructure observables 7
1.2.3 Jet grooming algorithms 8
1.2.4 HEPTopTagger 12
2 The ATLAS detector and data samples 15
2.1 The ATLAS detector 15
2.2 Data and Monte Carlo samples 15
3 Jet reconstruction and calibration 17
3.1 Inputs to jet reconstruction 17
3.2 Jet quality criteria and selection 17
3.3 Jet calibration and systematic uncertainties 18
3.3.1 Monte Carlo based calibration 18
3.3.2 Jet mass scale validation in inclusive jet events using track-jets 19 3.3.3 Jet mass scale validation using hadronic W decays in t¯t events 24
3.4 In situ validation of the subjet energy scale 27
3.5 Calibration of subjets 28
4 Jet substructure and grooming in the presence of pile-up 31
4.1 Impact of pile-up on the jet energy scale and the jet mass scale 31
4.2 Impact of pile-up on jet substructure properties 36
4.3 Impact of pile-up on signal and background in simulation 36
5 Jet substructure and grooming with boosted objects in data and
simu-lation 39
5.1 Expected performance of jet substructure and grooming in simulation 39
5.1.1 Jet mass resolution for background 39
5.1.2 Jet mass resolution for simulated signal events 41
5.1.3 Signal and background comparisons with and without grooming 43 5.2 Inclusive jet data compared to simulation with and without grooming 46
5.3 Performance of jet grooming in boosted top-quark events 54
5.3.1 Semi-leptonic t¯t selection 54
5.3.2 Performance of trimming in t¯t events 56
1 Introduction
The dominant feature of high-energy proton–proton (pp) collisions at the Large Hadron Collider (LHC) is the production of highly collimated sprays of energetic hadrons, called jets, that originate from the quarks and gluons in the primary collisions. The large centre-of-mass energy at the LHC enables the production of Lorentz-boosted heavy particles, whose decay products can be reconstructed as one large-area jet. The study of the internal structure of jets goes beyond the four-momentum description of a single parton and yields new approaches for testing Quantum Chromodynamics (QCD) and for searching for new physics in hadronic final states. However, many of the new tools developed for the study of jet substructure at the LHC have only recently been validated with data in a hadron–hadron collider environment. For example, the effect of multiple pp interactions on large-area jet measurements has not been extensively studied experimentally.
This paper presents a comprehensive set of studies designed to establish the efficacy, accuracy, and precision of several of the tools available for determining and analysing the internal structure of jets at the LHC. New jet algorithms and strategies, referred to as jet grooming, that refine the definition of a jet in a high-luminosity environment, are studied using data taken at a centre-of-mass energy of √s = 7 TeV during 2011. A variety of techniques and tagging algorithms intended to improve the mass resolution in the reconstruction of boosted objects that decay hadronically are studied in the data both in inclusive jet samples and in samples enriched in events containing boosted W /Z bosons and top quarks. Evaluations of the systematic uncertainties for jet mass measurements are presented for a variety of jet algorithms. Comparisons of the discrimination between signal and background provided by various observables are also evaluated for a selection of models of new physics containing boosted hadronic particle decays.
The organization of the paper is as follows. In this section, motivation for the use of new jet reconstruction techniques for Lorentz-boosted particles is given and the jet algorithms and jet substructure variables that are used in the analyses presented here are defined. Section 2 provides descriptions of the ATLAS detector and the Monte Carlo simulations, and section 3 defines the jet reconstruction and calibration procedures that are used throughout. The latter section includes a discussion of the jet mass scale and the subjet energy scale, which are important ingredients in the jet grooming algorithms. Section4describes studies of the effect of jet grooming on jet properties in the presence of pile-up, which represents a major experimental challenge at the present and future LHC machine.
Studies of the performance of the various jet algorithms are conducted with three classes of event samples in both data and Monte Carlo simulation in section 5: inclusive jet events, which are dominated by light-quark or gluon jets whose properties are defined primarily by soft gluon emission; boosted hadronically decaying W and Z bosons, which form jets that are dominated by two high-pT components; and top-quark decays, where the W boson decays hadronically, which form jets that have three prominent components (due to the b-quark in addition to the W ). In section 5.1, the effect on jet resolution of the various jet grooming algorithms is compared in simulated events separately for signal
(W , Z, and top jets) and background from light-quark and gluon jets. The discrimination between background and signal is then studied using a number of grooming configurations by comparing jet properties for the different types of events before and after grooming. This is followed in section 5.2 by a direct comparison of multiple Monte Carlo predictions and inclusive jet data. Lastly, section 5.3 presents jet grooming studies on boosted top-quark events. Finally, conclusions are drawn in section6.
1.1 Motivation
The centre-of-mass energy of the LHC has opened new kinematic regimes to experimental study. The new phase space available for the production of Standard Model (SM) par-ticles with significant Lorentz boosts, or even new massive parpar-ticles that decay to highly boosted SM particles, necessitates new techniques to conduct measurements in novel final states. For example, when sufficiently boosted, the decay products of W bosons [1], top quarks [2, 3], and Higgs bosons [4] can become collimated to the point that standard re-construction techniques begin to fail. When the separation of the quarks in these boosted topologies becomes smaller than the radius parameter of the jets, they often fail to be individually resolved by standard jet algorithms and configurations. Moreover, the high-luminosity conditions at the LHC can further degrade even the most complex procedures for reconstructing decays of boosted hadronic objects. Multiple pp interactions per bunch crossing (pile-up) produce soft particles unrelated to the hard scattering that can con-taminate jets in the detector considerably more than at previous hadron–hadron colliders. In events where boosted particle decays are fully contained within individual large-radius jets, a diminished mass resolution due to pile-up may dramatically weaken sensitivity to new physics processes. It is crucial that the above issues be addressed together, as the efficacy of a given technique for boosted object reconstruction may depend critically on its vulnerability to experimental conditions.
One example of a new physics process that may produce heavy objects with a sig-nificant Lorentz boost is the decay of a new heavy gauge boson, the Z0, to top-quark pairs. Figure1shows the angular separation between the W and b decay products of a top quark in simulated Z0→ t¯t (m
Z0 = 1.6 TeV) events, as well as the separation between the
light quarks of the subsequent hadronic decay of the W boson. In each case, the angular separation of the decay products is approximately
∆R≈ 2m
pT
, (1.1)
where ∆R =p(∆y)2+ (∆φ)2, and p
Tand m are the transverse momentum and the mass, respectively, of the decaying particle.1 For pW
T > 200 GeV, the ability to resolve the
1
The ATLAS coordinate system is a right-handed system with the x-axis pointing to the centre of the LHC ring and the y-axis pointing upwards. The polar angle θ is measured with respect to the LHC beam-line. The azimuthal angle φ is measured with respect to the x-axis. The rapidity is defined as
y = 0.5 × ln[(E + pz)/(E − pz)], where E denotes the energy and pz is the component of the momentum
along the beam direction. The pseudorapidity η is an approximation for rapidity y in the high-energy limit, and it is related to the polar angle θ by η = − ln tan(θ/2). Transverse momentum and energy are defined
[GeV] T t p 0 100 200 300 400 500 600 700 800 900 R (W ,b ) ∆ 0 0.2 0.4 0.6 0.8 1 1.2 1.4 1.6 1.8 2 2.2 0 20 40 60 80 100 120 140 160 180 200 Wb → , t t t → Pythia Z' ATLAS Simulation (a) t → W b [GeV] T W p 0 100 200 300 400 500 600 700 800 ) q R(q, ∆ 0 0.5 1 1.5 2 2.5 3 3.5 4 0 20 40 60 80 100 120 140 160 180 200 Wb → , t t t → Pythia Z' ATLAS Simulation (b) W → q ¯q
Figure 1. (a) The angular separation between the W boson and b-quark in top decays, t→ W b, as a function of the top-quark transverse momentum (ptT) in simulated PYTHIA [5] Z0 → t¯t (mZ0 = 1.6 TeV) events. (b)The angular distance between the light quark and anti-quark from t→ W b decays as a function of the pTof the W boson (pWT). Both distributions are at the generator level and do not include effects due to initial and final-state radiation, or the underlying event.
individual hadronic decay products using standard narrow-radius jet algorithms begins to degrade, and when pt
T is greater than 300 GeV, the decay products of the top quark tend to have a separation ∆R < 1.0. Techniques designed to recover sensitivity in such cases focus on large-R jets in order to maximize efficiency. In this paper, large-R refers to jets with a radius parameter R≥ 1.0. At√s = 7 TeV, nearly one thousand SM t¯t events per fb−1 are expected with pt
T greater than 300 GeV. New physics may appear in this region of phase space, the study of which was limited by integrated luminosity and available energy at previous colliders.
A single jet that contains all of the decay products of a massive particle has signifi-cantly different properties than a jet of the same pT originating from a light quark. The characteristic two-body or three-body decays of a high pTvector boson or top quark result in a hard substructure that is absent from typical high pTjets formed from gluons and light quarks. These subtle differences in substructure can be resolved more clearly by removing soft QCD radiation from jets. Such adaptive modification of the jet algorithm or selective removal of soft radiation during the process of iterative recombination in jet reconstruction is generally referred to as jet grooming [4,6,7].
Recently many jet grooming algorithms have been designed to remove contributions to a given jet that are irrelevant or detrimental to resolving the hard decay products from a boosted object (for recent reviews and comparisons of these techniques, see for example refs. [8,9]). The structural differences between jets formed from gluons or light quarks and individual jets originating from the decay of a boosted hadronic particle form the basis for these tools. The former are characterized primarily by a single dense core of energy
Jet mass [GeV] 0 50 100 150 200 250 300 350 400 Arbitrary units 0 0.02 0.04 0.06 0.08 0.1 0.12 0.14 q q →
No jet grooming applied Z q q → =0.67) Z frac µ Filtered ( Simulation ATLAS < 800 GeV jet T p ≤ C/A LCW jets with R=1.2, 600
Figure 2. Single-jet invariant mass distribution for Cambridge–Aachen (C/A) R = 1.2 jets in simulated events containing highly boosted hadronically decaying Z bosons before and after the application of a grooming procedure referred to as mass-drop filtering. The technical details of this figure are explained in section 1.2. The normalization of the groomed distribution includes the efficiency of mass-drop filtering with respect to the ungroomed large-R jets for comparison. The local cluster weighting (LCW) calibration scheme is described in section3.3.1.
surrounded by soft radiation from the parton shower, hadronization, and underlying event (UE) remnants [10–12]. Jets containing the decay products of single massive particles, on the other hand, can be distinguished by hard, wide-angle components representative of the individual decay products that result in a large reconstructed jet mass mass, as well as typical kinematic relationships among the hard components of the jet [1,2, 4, 13–18]. Grooming algorithms are designed to retain the characteristic substructure within such a jet while reducing the impact of the fluctuations of the parton shower and the UE, thereby improving the mass resolution and mitigating the influence of pile-up. These features have only recently begun to be studied experimentally [19–25] and have been exploited heavily in recent studies of the phenomenological implications of such tools in searches for new physics [4, 26–36]. A groomed jet can also be a powerful tool to discriminate between the often dominant multi-jet background and the heavy-particle decay, which increases signal sensitivity. Figure2demonstrates this by comparing the invariant mass distribution of single jets in events containing highly boosted hadronically decaying Z bosons before and after the application of a grooming procedure referred to as mass-drop filtering. In this simulated Z → q¯q sample described in section 2.2, pile-up events are also included. Prior to the application of this procedure, no distinct features are present in the jet mass distribution, whereas afterwards, a clear mass peak that corresponds to the Z boson is evident.
1.2 Definitions 1.2.1 Jet algorithms
In this paper, three jet algorithms are studied: the anti-ktalgorithm [37], the Cambridge– Aachen (C/A) algorithm [38, 39], and the kt algorithm [40–42]. These are implemented within the framework of the FastJet software [43, 44]. They represent the most widely used infrared and collinear-safe jet algorithms available for hadron–hadron collider physics today. Furthermore, in the case of the kt and C/A algorithms, the clustering history of the algorithm – that is, the ordering and structure of the pair-wise subjet recombinations made during jet reconstruction – provides spatial and kinematic information about the substructure of that jet. The anti-kt algorithm provides jets that are defined primarily by the highest-pT constituent, yielding stable, circular jets. The compromise is that the structure of the jet as defined by the successive recombinations carried out by the anti-kt algorithm carries little or no information about the pT ordering of the shower or wide angular-scale structure. It is, however, possible to exploit the stability of the anti-kt al-gorithm and recover meaningful information about the jet substructure: anti-kt jets are selected for analysis based on their kinematics (η and pT), and then the jet constituents are reclustered with the ktalgorithm to enable use of the kt-ordered splitting scales described in section 1.2.2. The four-momentum recombination scheme is used in all cases and the jet finding is performed in rapidity–azimuthal angle (y–φ) coordinates. Jet selections and corrections are made in pseudorapidity–azimuthal angle (η–φ) coordinates.
1.2.2 Jet properties and substructure observables
Three observables are used throughout these studies to characterize jet substructure and distinguish massive boosted objects from gluons or light quarks: mass, kt splitting scales, and N -subjettiness.
Jet mass: The jet mass is defined as the mass deduced from the four-momentum sum of all jet constituents. Depending on the input to the jet algorithm (see section 3.1), the constituents may be considered as either massive or massless four-momenta.
kt splitting scales: The kt splitting scales [45] are defined by reclustering the con-stituents of a jet with the kt recombination algorithm, which tends to combine the harder constituents last. At the final step of the jet recombination procedure, the kt distance measure, dij, for the two remaining proto-jets (intermediate jet-like objects at each stage of clustering), referred to as subjets in this case, can be used to define a splitting scale variable as:
pdij = min(pTi, pTj)× ∆Rij, (1.2)
where ∆Rij is the distance between the two subjets in η−φ space. With this definition, the subjets identified at the last step of the reclustering in the kt algorithm provide the
√ d12 observable. Similarly, √d23 characterizes the splitting scale in the second-to-last step of the reclustering. The parameters√d12and
√
decays, which tend to be reasonably symmetric when the decay is to like-mass particles, from the largely asymmetric splittings that originate from QCD radiation in light-quark or gluon jets. The expected value for a two-body heavy-particle decay is approximately √
d12 ≈ mparticle/2, whereas jets from the parton shower of gluons and light quarks tend to have smaller values of the splitting scales and to exhibit a steeply falling spectrum for both √d12 and
√
d23 (see for example figure30).
N -subjettiness: The N -subjettiness variables τN [13,46] are observables related to the subjet multiplicity. The τN variable is calculated by clustering the constituents of the jet with the ktalgorithm and requiring that exactly N subjets be found. This is done using the exclusive version of the ktalgorithm [42] and is based on reconstructing clusters of particles in the jet using all of the jet constituents. These N final subjets define axes within the jet. The variables τN are then defined in eq. (1.3) as the sum over all constituents k of the jet, such that τN = 1 d0 X k pTk× min(δR1k, δR2k, ..., δRN k) , with d0 ≡ X k pTk× R (1.3)
where R is the jet radius parameter in the jet algorithm, pTk is the pT of constituent k and δRik is the distance from subjet i to constituent k. Using this definition, τN describes how well jets can be described as containing N or fewer kt subjets by assessing the degree to which constituents are aligned with the axes of these subjets for a given hypothesis N . The ratios τ2/τ1 and τ3/τ2 can be used to provide discrimination between jets formed from the parton shower of initial-state gluons or light-quarks and jets formed from two hadronic decay products (from Z-bosons, for example) or three hadronic decay products from boosted top quarks. These ratios are herein referred to as τ21 and τ32 respectively. For example, τ21 ' 1 corresponds to a jet that is very well described by a single subjet whereas a lower value implies a jet that is much better described by two subjets than one. 1.2.3 Jet grooming algorithms
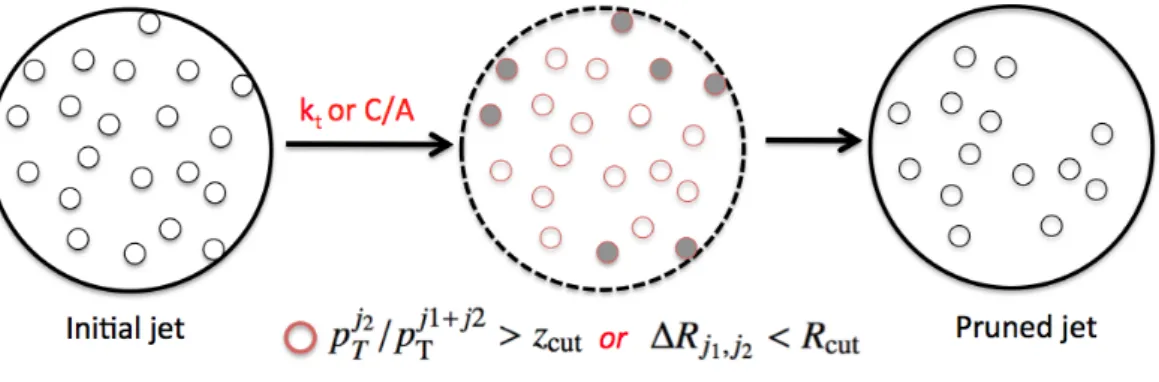
Three jet grooming procedures are studied in this paper. Mass-drop filtering, trimming, and pruning are described, and performance measures related to each are defined. The different configurations of the grooming algorithms described in this section are summarized in table1. Additionally, a technique to tag boosted top quarks using the mass-drop filtering method is introduced. Unless otherwise specified, the jet pT reported for a groomed jet is that which is calculated after the grooming algorithm is applied to the original jet. Mass-drop Filtering: The mass-drop filtering procedure2seeks to isolate concentrations
of energy within a jet by identifying relatively symmetric subjets, each with a significantly smaller mass than that of the original jet. This technique was developed and optimized using C/A jets in the search for a Higgs boson decaying to two b-quarks: H→ b¯b [4]. The C/A algorithm is used because it provides an angular-ordered shower history that begins
with the widest combinations when reversing the cluster sequence. This provides useful information regarding the presence of potentially large splittings within a jet (see section4 and section 5). Although the mass-drop criterion and subsequent filtering procedure are not based specifically on soft-pT or wide-angle selection criteria, the algorithm does retain the hard components of the jet through the requirements placed on its internal structure. The first measurements of the jet mass of these filtered jets was performed using 35 pb−1 of data collected in 2010 by the ATLAS experiment [20]. The mass-drop filtering procedure has two stages:
• Mass-drop and symmetry The last stage of the C/A clustering is undone. The jet “splits” into two subjets, j1 and j2, ordered such that the mass of j1 is larger: mj1 > mj2. The mass-drop criterion requires that there be a significant difference
between the original jet mass (mjet) and mj1 after the splitting:
mj1/mjet < µ
frac, (1.4)
where µfrac is a parameter of the algorithm. The splitting is also required to be relatively symmetric, which is approximated by the requirement that
min[(pj1 T)2, (p j2 T)2] (mjet)2 × ∆R 2 j1,j2 > ycut, (1.5)
where ∆Rj1,j2is a measure of the opening angle between j2and j1, and ycutdefines the
energy sharing between the two subjets in the original jet. For the analyses presented here, ycut is set to 0.09, the optimal value for identifying two-body decays, obtained in previous studies [4]. To give a sense of the kinematic requirements that this places on a given decay, consider a hadronically decaying W boson with pW
T ≈ 200 GeV. According to the approximation given by eq. (1.1), the average angular separation of the two daughter quarks is ∆Rj1,j2 ∼ 0.8. The symmetry requirement determined by
ycut in eq. (1.5) thereby implies that the transverse momentum of the softer (in pT) of the two subjets is greater than approximately 30 GeV. Generally, this requirement entails a minimum pT of the softer subjet of psubjetT /pjetT > 0.15, thus forcing both subjets to carry some significant fraction of the momentum of the original jet. This procedure is illustrated in figure 3(a). If the mass-drop and symmetry criteria are not satisfied, the jet is discarded.
• Filtering The constituents of j1and j2are reclustered using the C/A algorithm with radius parameter Rfilt = min[0.3, ∆Rj1,j2/2], where Rfilt < ∆Rj1,j2. The jet is then
filtered; all constituents outside the three hardest subjets are discarded. The choice of three allows one additional radiation from a two-body decay to be captured. In isolating j1and j2with the C/A algorithm, the angular scale of any potential massive particle decay is known. By dynamically reclustering the jet at an appropriate angular scale able to resolve that structure, the sensitivity to highly collimated decays is maximized. This is illustrated in figure3(b).
(a) The mass-drop and symmetric splitting criteria.
(b) Filtering.
Figure 3. Diagram depicting the two stages of the mass-drop filtering procedure.
In this paper, three values of the mass-drop parameter µfracare studied, as summarized in table1. The values chosen for µfrac are based on a previous study [4] which has shown that µfrac = 0.67 is optimal in discriminating H → b¯b from background. A subsequent study regarding the factorization properties of several groomed jet algorithms [47] found that smaller values of µfrac(0.20 and 0.33) are similarly effective at reducing backgrounds, and yet they remain factorizable within the soft collinear effective theory studied in that analysis.
Trimming: The trimming algorithm [7] takes advantage of the fact that contamination from pile-up, multiple parton interactions (MPI) and initial-state radiation (ISR) in the reconstructed jet is often much softer than the outgoing partons associated with the hard-scatter and their final-state radiation (FSR). The ratio of the pTof the constituents to that of the jet is used as a selection criterion. Although there is some spatial overlap, removing the softer components from the final jet preferentially removes radiation from pile-up, MPI, and ISR while discarding only a small part of the hard-scatter decay products and FSR. Since the primary effect of pile-up in the detector is additional low-energy deposits
in clusters of calorimeter cells, as opposed to additional energy being added to already existing clusters produced by particles originating from the hard scattering process, this allows a relatively simple jet energy offset correction for smaller radius jets (R = 0.4, 0.6) as a function of the number of primary reconstructed vertices [48].
Figure 4. Diagram depicting the jet trimming procedure.
The trimming procedure uses a kt algorithm to create subjets of size Rsub from the constituents of a jet. Any subjets with pTi/pjetT < fcut are removed, where pTi is the transverse momentum of the ith subjet, and f
cut is a parameter of the method, which is typically a few percent. The remaining constituents form the trimmed jet. This procedure is illustrated in figure 4. Low-mass jets (mjet < 100 GeV) from a light-quark or gluon lose typically 30–50% of their mass in the trimming procedure, while jets containing the decay products of a boosted object lose less of their mass, with most of the reduction due to the removal of pile-up or UE (see, for example, figures 29 and 32). The fraction removed increases with the number of pp interactions in the event.
Six configurations of trimmed jets are studied here, arising from combinations of fcut and Rsub, given in table 1. They are based on the optimized parameters in ref. [7] (fcut = 0.03, Rsub = 0.2) and variations suggested by the authors of the algorithm. This set represents a wide range of phase space for trimming and is somewhat broader than considered in ref. [7].
Pruning: The pruning algorithm [6, 49] is similar to trimming in that it removes con-stituents with a small relative pT, but it additionally applies a veto on wide-angle radiation. The pruning procedure is invoked at each successive recombination step of the jet algo-rithm (either C/A or kt). It is based on a decision at each step of the jet reconstruction whether or not to add the constituent being considered. As such, it does not require the reconstruction of subjets. For all studies performed for this paper, the ktalgorithm is used in the pruning procedure. This results in definitions of the terms wide-angle or soft that are not directly related to the original jet but rather to the proto-jets formed in the process of rebuilding the pruned jet.
The procedure is as follows:
• The C/A or kt recombination jet algorithm is run on the constituents, which were found by any jet finding algorithm.
Figure 5. Diagram illustrating the pruning procedure.
• At each recombination step of constituents j1 and j2 (where pjT1 > pjT2), either pj2
T/p j1+j2
T > zcut or ∆Rj1,j2 < Rcut× (2m
jet/pjet
T ) must be satisfied. Here, zcut and Rcut are parameters of the algorithm which are studied in this paper.
• j2 with j1 are merged if one or both of the above criteria are met, otherwise, j2 is discarded and the algorithm continues.
The pruning procedure is illustrated in figure 5. Six configurations, given in table 1, based on combinations of zcut and Rcut are studied here. This set of parameters also represents a relatively wide range of possible configurations.
Jet finding algorithms used Grooming algorithm Configurations considered C/A Mass-Drop Filtering µfrac = 0.20, 0.33, 0.67
Anti-kt and C/A Trimming
fcut= 0.01, 0.03, 0.05 Rsub = 0.2, 0.3
Anti-kt and C/A Pruning
Rcut = 0.1, 0.2, 0.3 zcut = 0.05, 0.1
C/A HEPTopTagger (see table2)
Table 1. Summary of the grooming configurations considered in this study. Values in boldface are optimized configurations reported in ref. [4] and ref. [7] for filtering and trimming, respectively.
1.2.4 HEPTopTagger
The HEPTopTagger algorithm [26] is designed to identify a top quark with a hadronically decaying W boson daughter over a large multi-jet background. The method uses the C/A jet algorithm and a variant of the mass-drop filtering technique described in section1.2.3in order to exploit information about the recombination history of the jet. This information
is used to search for evidence within the jet of the presence of W decay products as well as an additional energy deposition – the b-quark – that are consistent with the W and top masses and the expected angular distribution of the final-state quarks. The HEPTopTagger algorithm is optimized for top-quark transverse momentum as low as 200 GeV and therefore uses a correspondingly large jet radius parameter. The algorithm proceeds as follows and is illustrated in figure6.
Decomposition into substructure objects: The mass-drop criterion defined in eq. (1.4) is applied to a large-R C/A jet, where j1 and j2 are the two subjets from the last stage of clustering, with mj1 > mj2. If the criterion is satisfied, the same prescription is followed
to split both j1 and j2 further. The iterative splitting continues until the subjets either have masses mi less than a tunable parameter mcut, or represent individual constituents, such as calorimeter energy deposits, tracks, or generator-level particles (i.e. no clustering history); see section 3.1 for definitions. This procedure results in Ni subjets. If at any stage mj1 > (mjet× µ
frac), the mass-drop criterion and subsequent iterative declustering is not applied to j2. The values of mcutand R studied are summarized in table2. R values of 1.5 and 1.8, somewhat larger than used generally in mass-drop filtering, are chosen based on previous studies [26]. When the iterative process of declustering the jet is complete, there must exist at least three subjets (Ni≥ 3), otherwise the jet is discarded.
Filtering: All possible combinations of three subjets are formed, and each triplet is filtered one at a time. The constituents of the subjets in a given triplet are reclustered into Nj new subjets using the C/A algorithm with a size parameter Rfilt= min[0.3, ∆Rj1,j2/2],
where ∆Rj1,j2 is the minimum separation between all possible pairs in the current triplet.
It is therefore possible that Nj > 3 after the reclustering step. All energy deposits not in the Nj subjets are discarded.
Top mass window requirement: If the invariant mass of the four-momentum deter-mined by summing the constituents of the Nj subjets is not in the range 140 GeV≤ mjet < 200 GeV, the triplet combination is ignored. If more than one triplet satisfies the criterion, only the one with mass closest to the top-quark mass, mt, is used. This triplet (which consists of Nj ≥ 3 subjets) is thus identified as the top-candidate triplet.
Reclustering of subjets: From the Nj subjets of the top-candidate triplet, Nsubjet leading-pT subjets are chosen, where Nsubjet is a parameter satisfying 3 ≤ Nsubjet ≤ Nj. From this set of subjets, exactly three jets are built by re-applying the C/A algorithm to the constituents of the Nsubjet subjets, which are exclusively clustered using a distance parameter Rjet listed in table 2. This latter step reflects the hypothesis that this is likely to be a top-jet candidate. These subjets are calibrated as described in section3.5.
W boson mass requirements: Relations listed in Eqs. (A.1) of Ref. [26] are defined using the total invariant mass of the three subjets (m123) and the invariant mass mij formed from combinations of two of the three subjets ordered in pT. These conditions include:
R−< m23 m123
Default Tight Loose R 1.5 or 1.8 1.5 1.5 mcut[GeV] 30 30 70 Rjet 0.3 0.2 0.5 Nsubjet 5 4 7 fW[%] 15 10 20
Table 2. The settings used for studying the performance of the HEPTopTagger.
0.2 < arctan m13 m12
< 1.3. (1.7)
Here, R± = (1± fW)(mW/mt), fW is a resolution variable (given in table 2), and the quantities mW and mt denote the W boson and top-quark masses, respectively. If at least one of the criteria in Eqs. (A.1) of [26] is met, the four-momentum addition of the three subjets is considered a candidate top quark.
(a) Every object encountered in the declustering process is considered a ‘substructure object’ if it is of sufficiently low mass or has no clustering history.
Initial jet C/A C/A mj1/mjet< µ frac mj2/mj2∗< µfrac
(b) The mass-drop criterion is applied iteratively, following the highest subjet-mass line through the
clustering history, resulting in Nisubstructure
ob-jects.
(c) For every triplet-wise combination of the sub-structure objects found in (b), recluster the
con-stituents into subjets and select the Nsubjet
leading-pTsubjets, with 3 ≤ Nsubjet≤ Ni (here, Nsubjet=
5). Make exactly three jets Top candidate mab= mW(1± 0.15) (a, b = j1, j2, j3)
(d) Recluster the constituents of the Nsubjetsubjets
into exactly three subjets to make the top candidate for this triplet-wise combination of substructure ob-jects.
2 The ATLAS detector and data samples
2.1 The ATLAS detector
The ATLAS detector [50,51] provides nearly full solid angle coverage around the collision point with an inner tracking system covering |η| < 2.5, electromagnetic and hadronic calorimeters covering |η| < 4.9, and a muon spectrometer covering |η| < 2.7. Of the multiple ATLAS subsystems, the most relevant to this analysis are the barrel and endcap calorimeters [52,53] and the trigger [54].
The calorimeter comprises multiple sub-detectors of various designs, spanning the pseu-dorapidity range up to |η| = 4.9. The measurements presented here are performed using data predominantly from the central calorimeters, comprising the liquid argon (LAr) bar-rel electromagnetic calorimeter (|η| < 1.475) and the tile hadronic calorimeter (|η| < 1.7). Three additional calorimeter subsystems are located in the higher-η regions of the detector: the LAr electromagnetic endcap calorimeter, the LAr hadronic endcap calorimeter, and the forward calorimeter with separate components for electromagnetic and hadronic showers.
Dedicated trigger and data acquisition systems are responsible for the online event selection, which is performed in three stages: Level 1, Level 2, and the Event Filter. The measurements presented in this paper rely primarily on the single-jet and multi-jet triggers implemented at the Event Filter level, which has access to the full detector granularity, and finds multi-jet events with high efficiency. The intermediate trigger levels provide coarser jet finding and sufficient rate reduction to satisfy the trigger and offline selection requirements.
2.2 Data and Monte Carlo samples
Data from the entire 2011 ATLAS data-taking period are used, corresponding to 4.7± 0.1 fb−1 of integrated luminosity [55]. All data are required to have met baseline qual-ity criteria and were taken during periods in which almost all of the detector was fully functional. Data quality criteria reject events with significant contamination from detector noise or with issues in the read-out, and are based on assessments for each subdetector individually. Multiple proton–proton collisions, or pile-up, result in several reconstructed primary vertices per event. The inclusive jet sample that is used for many studies in this paper is selected from the data using a single high-pT jet trigger that requires the leading jet in the event to have pjetT > 350 GeV. This trigger threshold was used for the entire 2011 data-taking period and thus represents the full integrated luminosity with negligible inefficiency.
These data are compared to inclusive jet events, which are dominated by light-quark or gluon jets whose properties are defined primarily by soft gluon emission, that are generated by three Monte Carlo (MC) simulation programs: PYTHIA 6.425 [5], HERWIG++ [56], and POWHEG-BOX 1.0 [57–59] (patch 4) interfaced to PYTHIA 6.425 for the par-ton shower, hadronization, and UE models. Both PYTHIA and HERWIG++ use the modified-LO parton distribution function (PDF) set MRST LO* [60]. POWHEG+PYTHIA uses the CT10 NLO PDF [61] in the matrix element and CTEQ6L1 PDF set [62] for the PYTHIA parton shower. For both cases, PYTHIA is used with the corresponding
ATLAS AUET2B tune [63, 64] and HERWIG++ uses the so-called UE7-2 tune [65], which is tuned to UE data from the LHC experiments. PYTHIA or HERWIG++ with POWHEG+PYTHIA provide an important comparison, at least at the matrix-element level, between leading-order (LO) (PYTHIA and HERWIG++) and next-to-leading-order (NLO) (POWHEG) calculations. Furthermore, PYTHIA and HERWIG++ offer distinct approaches to the modelling of the parton shower, hadronization, and the UE.
Samples of t¯t events are generated with MC@NLO v4.01 [66] using the CT10 NLO PDF, interfaced to HERWIG v6.520 [67] and JIMMY v4.31 [68]. Alternative samples for the study of systematic uncertainties are generated with POWHEG, with showering provided by either HERWIG or PYTHIA. Samples generated with the AcerMC v3.8 [69] package, using CTEQ6L1 PDFs, with showering provided by PYTHIA are also used. In these samples PYTHIA parameters have been tuned to increase or decrease the amount of initial- and final-state radiation. Single-top-quark events in the s-channel and W t processes are also generated with MC@NLO using the CT10 NLO PDF set, with only leptonically decaying W bosons allowed in the final state. Single-top-quark events in the t-channel, where all W boson decay channels are produced, are generated with AcerMC using the CTEQ6L1 PDF set, and are showered using PYTHIA with the AUET2B tune.
Samples of W +jets and Z+jets events are produced with the ALPGEN v2.13 [70] gen-erator, using CTEQ6L1 PDFs, interfaced to HERWIG for parton showering and hadroniza-tion. Samples of diboson production processes (W W , W Z and ZZ) are produced with the HERWIG generator.
After simulation of the parton shower and hadronization, as well as of the UE, events are passed through the full Geant4 [71] detector simulation [72]. Following this, the same trigger, event, data quality, jet, and track selection criteria are applied to the Monte Carlo simulation events as are applied to the data.
Boosted particles decaying to hadrons are used for direct comparisons of the perfor-mance of the various reconstruction and jet substructure techniques. For two-pronged decays, a sample of hadronically decaying Z bosons is generated using the HERWIG v6.510 [67] event generator interfaced with JIMMY v4.31 [68] for the UE. A sample of hadronically decaying W bosons produced using the same configuration as for the Z boson sample is also used for comparisons of the HEPTopTagger performance in section5.3.3. In order to test the performance of techniques designed for three-pronged decays, t¯t events from a non-Standard-Model heavy gauge boson (Z0 with mZ0 = 1.6 TeV) are generated
using the same PYTHIA 6.425 tune as above. This model provides a relatively narrow t¯t resonance and top quarks with pT ' 800 GeV.
Pile-up is simulated by overlaying additional soft pp collisions, or minimum bias events, which are generated with PYTHIA 6.425 using the ATLAS AUET2B tune [64] and the CTEQ6L1 PDF set. The minimum bias events are overlaid onto the hard scattering events according to the measured distribution of the average numberhµi of pp interactions. The proton bunches were organized in trains of 36 bunches with a 50 ns spacing between the bunches. Therefore, the simulation also contains effects from out-of-time pile-up, i.e. contributions from the collision of bunches neighbouring those where the events of interest occurred. Simulated events are reweighted such that the MC distribution of hµi agrees
with the data, as measured by the luminosity detectors in ATLAS [55].
3 Jet reconstruction and calibration
3.1 Inputs to jet reconstruction
The inputs to jet reconstruction are either stable particles with a lifetime of at least 10 ps (excluding muons and neutrinos) in the case of MC generator-level jets (also re-ferred to as particle jets), charged particle tracks in the case of so-called track-jets [48], or three-dimensional topological clusters (topo-clusters) in the case of fully reconstructed calorimeter-jets. Stable particles, such as pions or protons in the simulation, retain their respective masses when input to the jet reconstruction algorithm. Tracks are assigned the pion mass when used as input to the jet algorithm. Quality selections are applied in order to ensure that good quality tracks that originate from the reconstructed hard scattering vertex are used to build track-jets. The hard scattering vertex is selected as the primary vertex that has the largest P(ptrack
T )2 in the event and that contains at least two tracks. The selection criteria are:
• transverse momentum: ptrack
T > 0.5 GeV; • transverse impact parameter: |d0| < 1.0 mm;
• longitudinal impact parameter: |z0| × sin(θ) < 1.0 mm;
• silicon detector hits on tracks: hits in pixel detector ≥ 1 and in the silicon strip detector ≥ 6;
where the impact parameters are computed with respect to the hard scattering vertex, and θ is the angle between the track and the beam. In the reconstruction of calorimeter jets, calorimeter cells are clustered together using a three-dimensional topological clustering algorithm that includes noise suppression [73]. The resulting topo-clusters are considered as massless four-momenta, such that E =|~p |. They are classified as either electromagnetic or hadronic based on their shape, depth and energy density. In the calibration procedure, corrections are applied to the energy in order to calibrate the clusters to the hadronic scale.
3.2 Jet quality criteria and selection
All jets in the event reconstructed with the anti-ktalgorithm with R = 0.4 and a measured pjetT > 20 GeV are required to satisfy the looser requirements discussed in detail in ref. [74]. These selections are designed to retain good quality jets while rejecting as large a fraction as possible of those from non-collision beam background and calorimeter noise. Jets are required to deposit at least 5% of their measured total energy in the electromagnetic (EM) calorimeter as well as not more than 99% of their energy in a single calorimeter layer.
To prevent contamination from detector noise, these jet quality criteria are extended by several requirements applied in a specific detector region. Any event with an anti-kt R = 0.4 jet with pjetT > 20 GeV that fails the above non-collision beam background or noise rejection requirements is removed from the analysis.
3.3 Jet calibration and systematic uncertainties
The precision and accuracy of energy measurements made by the calorimeter system are integral to every physics analysis, and the procedures to calibrate jets are described in ref. [48]. The baseline energy scale of the calorimeters derives from the calibration of the electronic signal arising from the energy deposited by electromagnetic showers measured in beam tests, known as the electromagnetic scale. The hadronic calorimeter has been calibrated with electrons, pions, and muons in beam tests and the energy scale has been validated using muons produced by cosmic rays with the detector in situ in the experimental hall [53]. The invariant mass of the Z boson in Z → ee events measured in situ in the same data sample studied here is used to adjust the calibration for the EM calorimeters. 3.3.1 Monte Carlo based calibration
The MC hadronic calibration scheme starts from the measured calorimeter energy at the electromagnetic (EM) energy scale [75–83], which correctly measures the energy deposited by electromagnetic showers. A local cluster weighting (LCW) calibration method classifies topological clusters along a continuous scale as being electromagnetic or hadronic, using shower shapes and energy densities. Energy corrections are applied to hadronic clusters based on this classification scheme, which is derived from single pion MC simulations and tested in situ using beam tests. These corrections account for the effects of non-compensation, signal losses due to noise suppression and out-of-cluster effects in building topo-clusters, and energy lost in non-instrumented regions of the calorimeters. The results shown here use LCW clusters as input to the jet algorithm.
The final jet energy scale (JES) calibration is derived as a correction relating the calorimeter’s response to the true jet energy. It can be applied to EM scale jets, with the resulting calibrated jets referred to as EM+JES, or to LCW calibrated jets, with the resulting jets referred to as LCW+JES jets. More details regarding the evaluation and validation of this approach for standard anti-kt R = 0.4, 0.6 jets can be found in ref. [48].
The JES correction used here for large-R jets is derived from a PYTHIA MC sample including pile-up events. There is no explicit offset correction for pile-up contributions, as in the standard JES procedure [48]. For standard jet algorithms, the dependence of the jet response on the number of primary vertices (NPV) and the average number of interactions (hµi) is removed by applying a pile-up offset correction to the EM or LCW scale before applying the JES correction. However, no explicit pile-up correction is applied to large-R jets or to jets with the various grooming algorithms applied.
Since one of the primary goals of the use of large-R and groomed jet algorithms is to reconstruct the masses of jets accurately and precisely, a last step is added to the calibration procedure of large-R jets wherein the mass of the jet is calibrated based on the MC simulation of dijet events. An explicit jet mass calibration is important when using the individual invariant jet mass in physics analyses since it is particularly susceptible to soft, wide-angle contributions that do not otherwise significantly impact the jet energy scale. The procedure measures the jet mass response for jets built from LCW clusters after the standard JES calibration. The mass response is determined from the mean of a Gaussian
fit to the core of the distribution of the reconstructed jet mass divided by the corresponding generator-level jet mass.
η
Jet
-5 -4 -3 -2 -1 0 1 2 3 4 5
Jet mass response before calibration 0.4
0.6 0.8 1 1.2 1.4 1.6 1.8 ATLAS Simulation
LCW jets with R=1.0, No grooming applied t
anti-k Dijets (Pythia) Before mass calibration
(a) anti-kt, R = 1.0, before calibration
η
Jet
-5 -4 -3 -2 -1 0 1 2 3 4 5
Jet mass response after calibration
0.4 0.6 0.8 1 1.2 1.4 1.6 1.8 E = 50 GeV E = 100 GeV E = 250 GeV E = 500 GeV E = 750 GeV E = 1500 GeV ATLAS Simulation
LCW jets with R=1.0, No grooming applied t
anti-k Dijets (Pythia) After mass calibration
(b) anti-kt, R = 1.0, after calibration
Figure 7. Mass response (mreco/mtrue) (a) before and(b) after mass calibration for ungroomed anti-kt, R = 1.0 jets. The dotted lines shown in (b) represent a ±3% envelope on the precision of the final jet mass scale calibration. In each case, the jet energy itself has been calibrated by applying the JES correction.
Figure 7 shows the jet mass response (mreco/mtrue) for several values of jet energy as a function of η for anti-kt, R = 1.0 jets, before and after calibration to the true jet mass and without jet grooming. In each case, the jet energy itself has been calibrated by applying the JES correction. One can see from this figure that even very high-energy jets near the central part of the detector can have a mean mass scale (or JMS) differing by up to 20% from the particle level true jet mass. In particular, the reconstructed mass is, on average, greater than that of the particle-level jet due in part to noise and pile-up in the detectors. Furthermore, the finite resolution of the detector has a differential impact on the mass response as a function of η. Following the jet mass calibration, performed also as a function of η, a uniform mass response can be restored within 3% across the full energy and η range.
3.3.2 Jet mass scale validation in inclusive jet events using track-jets
In order to validate the jet mass measurement made by the calorimeter, calorimeter-jets are compared to track-jets. Track-jets have a different set of systematic uncertainties and allow a reliable determination of the relative systematic uncertainties associated with the calorimeter-based measurement. Performance studies [84] have shown that there is excel-lent agreement between the measured positions of clusters and tracks in data, indicating no systematic misalignment between the calorimeter and the inner detector.
The use of track-jets reduces or eliminates the impact of additional pp collisions by requiring the jet inputs (tracks) to come from the hard-scattering vertex. The inner detector
and the calorimeter have largely uncorrelated instrumental systematic effects, and so a comparison of variables such as jet mass and energy between the two systems allows a separation of physics (correlated) and detector (uncorrelated) effects. It is therefore possible to validate the JES and JMS, and also to estimate directly the pile-up energy contribution to jets. This approach was used extensively in the measurement of the jet mass and substructure properties of jets in the 2010 data [20] where pile-up was significantly less important and the statistical reach of the measurement was smaller than with the full integrated luminosity of 4.7 fb−1 for the 2011 dataset.
The relative uncertainty is determined using the ratio of the transverse momentum of the calorimeter jet, pjetT , to that of the track-jet, ptrack jetT . The same procedure is repeated for the jet mass, mjet, by using the track-jet mass, mtrack jet. The ratios are defined as
rpT track jet= pjetT ptrack jetT , r m track jet = mjet mtrack jet, (3.1)
where the matching between calorimeter and track-jets is performed using a matching criterion of ∆R < 0.3. The mean values of these ratios are expected to be well described by the detector simulation if detector effects are well modelled. That is to say, even if some underlying physics process is unaccounted for in the simulation, as long as this process affects both the track-jet and calorimeter-jet pT or masses in a similar way, then the ratio of data to simulation should be relatively unaffected when averaged over many events.
Double ratios of rm
track jet and r pT
track jet are constructed in order to evaluate this agree-ment. These double ratios, RpT
r track jet and Rmr track jet, are defined as:
RpT r track jet= rpT,data track jet rpT,MC track jet , Rmr track jet= r m,data track jet rtrack jetm,MC . (3.2) The dependence of RpT
r track jet and Rmr track jet on p jet
T and mjet provides a test of the deviation of simulation from data, thus allowing an estimate of the uncertainty associated with the Monte Carlo derived calibration.
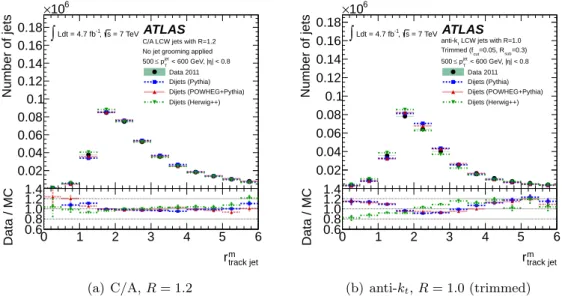
Figure 8 shows the distribution of rm
track jet for two jet algorithms and for jets in the range 500 GeV ≤ pjetT < 600 GeV in the central calorimeter region, |η| < 0.8. Compar-isons between MC simulation and the data are made using PYTHIA, HERWIG++, and POWHEG+PYTHIA, where the distributions are normalized to the number of events observed in the data. This pjetT range is chosen for illustrative purposes and because of its relevance to searches for boosted vector bosons and top quarks, as the decay products of both are expected to be fully merged into a large-R jet in this transverse momentum range. The peak near rm
track jet ≈ 2 and the shape of the distribution are both generally well described by the Monte Carlo simulations. Both the ungroomed and the trimmed anti-kt, R = 1.0 distributions show some discrepancies at very low rm
track jet, where the description of very soft radiation and hadronization is important, and at high values of rm
track jet, above rm
track jet & 4. The differences are approximately 20%. However, these spectra are used primarily to test the overall scale, so that the important comparison is of the mean values of the distributions, which are quite well described.
Number of jets 0.02 0.04 0.06 0.08 0.1 0.12 0.14 0.16 0.18 6 10 × track jet m r 0 1 2 3 4 5 6 Data / MC 0.6 0.8 1.0 1.2 1.4 ATLAS = 7 TeV s , -1 Ldt = 4.7 fb
∫ C/A LCW jets with R=1.2 No jet grooming applied
| < 0.8 η < 600 GeV, | T jet p ≤ 500 Data 2011 Dijets (Pythia) Dijets (POWHEG+Pythia) Dijets (Herwig++) (a) C/A, R = 1.2 Number of jets 0.02 0.04 0.06 0.08 0.1 0.12 0.14 0.16 0.18 6 10 × track jet m r 0 1 2 3 4 5 6 Data / MC 0.6 0.8 1.0 1.2 1.4 ATLAS = 7 TeV s , -1 Ldt = 4.7 fb
∫ anti-kt LCW jets with R=1.0 =0.3) sub =0.05, R cut Trimmed (f | < 0.8 η < 600 GeV, | T jet p ≤ 500 Data 2011 Dijets (Pythia) Dijets (POWHEG+Pythia) Dijets (Herwig++) (b) anti-kt, R = 1.0 (trimmed) Figure 8. rm
track jet distributions for (a) C/A, R = 1.2 jets, (b) anti-kt, R = 1.0 trimmed jets
(fcut = 0.05, Rsub = 0.3) in the range 500 GeV ≤ pjetT < 600 GeV and in the central calorimeter, |η| < 0.8. The ratios between data and MC distributions are shown in the lower section of each figure. The error bars and bands represent the statistical uncertainty only.
The relative systematic uncertainty is first estimated for each MC generator sample as the weighted average absolute deviation of the double ratio, Rm
r track jet, from unity. Mea-surements of Rm
r track jet are performed in exclusive p jet
T and η ranges. The statistical uncer-tainty is used as the weight in this case. The final relative unceruncer-tainty is then determined by the maximum of the weighted average deviation among the MC samples considered. Comparisons are made using PYTHIA, HERWIG++, and POWHEG+PYTHIA.
Figure 9 presents the distributions of both hrm
track jeti and the double ratio with re-spect to MC simulation,hRm
r track jeti, for the same algorithms and grooming configurations as shown in figure 8. In the peak of the jet mass distribution, logarithmic soft terms dominate [3] and lower-pT particles constitute a large fraction of the calorimeter-jet mass. These particles are bent more by the magnetic field than higher-pT particles, or are not reconstructed as charged-particle tracks, and thus contribute more to the calorimeter-jet mass than the track-jet mass. At much lower calorimeter-jet masses, charged particles can be completely bent out of the jet acceptance, thus reducing the calorimeter-jet mass for a fixed track-jet mass. These effects result in the shape observed in the rm
track jet distribu-tion in this region. Higher-mass jets tend to be composed of multiple higher-pT particles that are less affected by the magnetic field and therefore contribute more similarly to the calorimeter-based and track-based mass reconstruction. This results in a flatter and fairly stable rm
track jet ratio. This flat rmtrack jet distribution is present across the mass range for trimmed and mass-drop filtered (not shown) jet masses, as both these algorithms are de-signed to remove softer particles. Although there is a difference in the phase space of emissions probed at low and high mass, the calorimeter response relative to the tracker response is well modelled by each of the three MC simulations.
〉 m r track jet 〈 1 2 3 4 5 6
Jet mass [GeV]
0 50 100 150 200 250 300 350 〉 r track jet m R 〈 0.9 1.01.1 ATLAS ∫ Ldt = 4.7 fb-1, s = 7 TeV C/A LCW jets with R=1.2
No jet grooming applied | < 0.8 η < 600 GeV, | T jet p ≤ 500 Data 2011 Dijets (Pythia) Dijets (POWHEG+Pythia) Dijets (Herwig++) (a) C/A, R = 1.2 〉 m r track jet 〈 1 2 3 4 5 6
Jet mass [GeV]
0 50 100 150 200 250 300 350 〉 r track jet m R 〈 0.9 1.01.1 ATLAS ∫ Ldt = 4.7 fb-1, s = 7 TeV LCW jets with R=1.0 t anti-k =0.3) sub =0.05, R cut Trimmed (f | < 0.8 η < 600 GeV, | T jet p ≤ 500 Data 2011 Dijets (Pythia) Dijets (POWHEG+Pythia) Dijets (Herwig++) (b) anti-kt, R = 1.0 (trimmed)
Figure 9. Mean values of rm
track jet as a function of jet mass for (a) C/A, R = 1.2 jets and (b)
anti-kt, R = 1.0 trimmed jets (fcut= 0.05, Rsub= 0.3) in the range 500 GeV≤ pjetT < 600 GeV and in the central calorimeter,|η| < 0.8. The mean ratios between the data and MC distributions (the double ratios Rm
r track jet) are shown in the lower section of each figure. The error bars and bands
represent the statistical uncertainty only.
The weighted average deviation of Rm
r track jet from unity ranges from approximately 2% to 4% for the set of jet algorithms and grooming configurations tested for jets in the range 500 GeV≤ pjetT < 600 GeV and in the central calorimeter,|η| < 0.8. The results are fairly stable for the slightly less central η range 0.8≤ |η| < 1.2.
Figure 10presents the full set of jet mass scale systematic uncertainties for various jet algorithms estimated using the calorimeter-to-track-jet double ratios. The total relative uncertainty includes the 3% uncertainty on the precision of the jet mass scale calibration (see figure 7(b)) as well as the uncertainty on the track measurements themselves. The latter uncertainty takes into account the knowledge of tracking inefficiencies and their impact on the pjetT and mjet measurements using track-jets. Each of these two additional components is assumed to be uncorrelated and added in quadrature with the uncertainty determined solely from the calorimeter-to-track-jet double ratios. The uncertainties are smoothly interpolated between the multiple discrete η ranges in which they are estimated. Figure 10 shows the uncertainty evaluated at two points |η| = 0.0 (solid) and |η| = 1.0 (dashed) as a function of pjetT .
The impact of the tracking efficiency systematic uncertainty on rm
track jet is evaluated by randomly rejecting tracks used to construct track-jets according to the efficiency uncer-tainty. This is evaluated as a function of η and mjet for various pjet
T ranges. Typically, this results in a 2–3% shift in the measured track-jet kinematics (both pT and mass) and thus a roughly 1% contribution to the resulting total uncertainty, since the tracking uncertainty is taken to be uncorrelated to that determined from the double ratios directly.
[GeV] T Jet p 200 300 400 500 600 700 800 900 1000 Relative JMS Uncertainty 0 0.02 0.04 0.06 0.08 0.1 0.12 = 0.0 η = 1.0 η ATLAS LCW jets with R=1.0 t anti-k
No jet grooming applied
< 1000 GeV T | < 1.2 and 200 < p η For | = 7 TeV s , -1 L dt = 4.7 fb
∫
(a) anti-kt, R = 1.0 (no jet grooming)
[GeV] T Jet p 200 300 400 500 600 700 800 900 1000 Relative JMS Uncertainty 0 0.02 0.04 0.06 0.08 0.1 0.12 = 0.0 η = 1.0 η ATLAS LCW jets with R=1.0 t anti-k =0.3) sub =0.05, R cut Trimmed (f < 1000 GeV T | < 1.2 and 200 < p η For | = 7 TeV s , -1 L dt = 4.7 fb
∫
(b) anti-kt, R = 1.0 (trimming) [GeV] T Jet p 200 300 400 500 600 700 800 900 1000 Relative JMS Uncertainty 0 0.02 0.04 0.06 0.08 0.1 0.12 = 0.0 η = 1.0 η ATLASC/A LCW jets with R=1.2 No jet grooming applied
< 1000 GeV T | < 1.2 and 200 < p η For | = 7 TeV s , -1 L dt = 4.7 fb
∫
(c) C/A, R = 1.2 (no jet grooming)
[GeV] T Jet p 200 300 400 500 600 700 800 900 1000 Relative JMS Uncertainty 0 0.02 0.04 0.06 0.08 0.1 0.12 = 0.0 η = 1.0 η ATLAS
C/A LCW jets with R=1.2 =0.67) frac µ Filtered ( < 1000 GeV T | < 1.2 and 200 < p η For | = 7 TeV s , -1 L dt = 4.7 fb
∫
(d) C/A, R = 1.2 (filtering)Figure 10. Summary of the jet mass scale (JMS) relative systematic uncertainties as a function of pjetT . These uncertainties are determined from track-jet double ratios. For each jet algorithm(a)
anti-kt, R = 1.0 without trimming,(b)anti-kt, R = 1.0 with trimming (fcut= 0.05, Rsub= 0.3),(c)
C/A, R = 1.2 without filtering, and(d)C/A, R = 1.2 with filtering, the two lines shown represent the uncertainty evaluated at |η| = 0.0 (solid) and |η| = 1.0 (dashed). These estimates include a 3% relative non-closure uncertainty on the MC-based mass scale calibration factors, as well as systematic uncertainties on the impact of the tracking efficiency on the track measurements.
jet algorithms up to pjetT ≈ 800 GeV. At low pjetT , in the range 200 GeV≤ pjetT < 300 GeV, the average uncertainty for some jet algorithms rises to approximately 5–7%. The estimated uncertainty is similar for both the ungroomed and the trimmed or mass-drop filtered jets, except for trimmed anti-kt jets (see figure 10(b)) for which the uncertainty in the range 900 GeV≤ pjetT < 1000 GeV and|η| = 1.0 is approximately 8%.
3.3.3 Jet mass scale validation using hadronic W decays in t¯t events
An alternative approach to validating the jet mass scale is to study a hadronically decaying particle with a known mass. The most accessible source of hadronically decaying massive particles is events containing top-quark pairs (t¯t). The t¯t process at the LHC has a relatively large cross-section and the final state contains two W bosons. About 15% of the time, one of the W bosons decays to a muon and neutrino, while the other decays to hadrons. This leads to an abundant source of events with a distinctive leptonic signature and a hadronically decaying known heavy particle.
Signal muons are defined as having pT > 25 GeV and |η| < 2.5, as well as passing a number of quality criteria. Events are required to contain a signal muon and no additional muons or electrons. The missing transverse momentum (Emiss
T ) is calculated as the negative of the vector sum of the transverse momenta of all physics objects, at the appropriate energy scale, and the transverse momentum of any remaining topo-clusters not associated with physics objects in the event. Events are required to have Emiss
T > 25 GeV.
In events passing this leptonic selection, a W candidate is constructed from the signal muon and Emiss
T . In order to reject multi-jet background, this candidate is required to have transverse mass (mT) greater than 40 GeV.3
Boosted hadronically decaying W boson candidates are defined as single large-R jets with pT > 200 GeV. The hadronic and leptonic W candidates are required to be separated by at least 1.2 radians in φ to minimize potential overlap between the decay products of the two W bosons. In order to further enhance the fraction of top-quark production processes, an anti-kt jet with R = 0.4, pT > 20 GeV and with ∆R > 1.0 to the hadronic W candidate is required. This additional jet is also required to be tagged as a b-jet by the MV1 algorithm at the 70% efficient working point [85].
The resulting mass distributions of hadronic W candidates for two jet algorithms can be seen in figure 11. A peak near the W mass is clearly observed for both the mass-drop filtering and trimming algorithms in data and simulated Monte Carlo events.
A fitting procedure is used to extract the features of the jet mass distribution. The peak produced by the hadronic decays of W bosons is modelled by a Voigtian function, which is the convolution of Gaussian and Lorentzian functions4. In this function the width
of the Lorentzian component is fixed to the world-average W boson width. The width of the Gaussian function is a measure of the mass resolution although this is not explored in this study. The background shape has no simple analytic form and is assumed to be modelled by a quadratic polynomial. In order to simplify the background modelling, the W +jets MC prediction and multi-jet prediction are both subtracted from the data and the resulting distributions are compared to the sum of the t¯t, single-top quark, and W W MC samples. The results of this fit for Cambridge–Aachen jets can be seen in figure 12.
After fitting, the parameter controlling the mean of the Voigtian function (µ) is a
mea-3
Transverse mass mT is defined as pE2T− p2T of the vector sum of the four-momentum of the signal
muon and ETmiss, assumed to be due to the neutrino.
4The Lorentzian function is defined as L(x) = (σ/2π)
(x−x0)2+(σ/2)2, where x0specifies the mean and σ specifies
Jets / 10 GeV 0 200 400 600 800 1000 Jets / 10 GeV 0 200 400 600 800 1000 ν μ → Events containing W C/A LCW jets with R=1.2
ATLAS
Jet Mass [GeV] 20 40 60 80 100 120 140 160 180 200 Data / MC 0.5 0.751 1.251.5 Data 2011 WW tt Single top + jets ν τ → W + jets ν μ → W Multijet Filtered with μ=0.67 > 200 GeV T p = 7 TeV s , -1 Ldt = 4.7 fb
∫
(a) C/A, R = 1.2 (mass-drop filtered)
Jets / 10 GeV 0 200 400 600 800 1000 Jets / 10 GeV 0 200 400 600 800 1000 μ ν → Events containing W LCW jets with R=1.0 t anti-k > 200 GeV T p ATLAS
Jet Mass [GeV] 20 40 60 80 100 120 140 160 180 200 Data / MC 0.5 0.751 1.251.5 = 7 TeV s , -1 Ldt = 4.7 fb
∫
Data 2011 WW tt Single top + jets ν τ → W + jets ν μ → W Multijet Trimmed fcut=0.05, Rsub=0.3(b) anti-kt, R = 1.0 (trimmed)
Figure 11. Jet mass distributions for jets with pT > 200 GeV in events containing a W → µν candidate and a b-tagged anti-kt jet. The jets shown are (a) Cambridge–Aachen R = 1.2 after mass-drop filtering, and(b)anti-kt R = 1.0 after trimming.
Jet Mass [GeV]
50 100 150 200 250
Events / 5 GeV μ = 87.4 ± 0.2 GeV
0 50 100 150 200 250 300 Polynomial Bkg. Signal + Bkg. ATLAS Simulation
(a) Monte Carlo prediction
Jet Mass [GeV]
50 100 150 200 250 Events / 5 GeV Polynomial Bkg. Signal + Bkg. 0.8 GeV ± = 86.9 μ ATLAS 0 50 100 150 200 250 300 = 7 TeV s , -1 Ldt = 4.7 fb
∫
(b) DataFigure 12. Results of fitting the mass distributions of Cambridge–Aachen R = 1.2 jets after mass-drop filtering. The W +jets and multi-jet predictions have been subtracted from the distributions. The two figures show(a)the Monte Carlo prediction and(b)data. The dashed line represents the polynomial fit to the background shape, while the solid line represents the combined signal and background fit.
sure of the reconstructed mass of hadronically decaying W bosons. As shown in figure12, this scale is observed to be µdata= 86.9± 0.8 GeV and µMC= 87.4± 0.2 GeV. The depar-ture from the world-average value of mW = 80.385±0.015 GeV [86] is due to clustering and
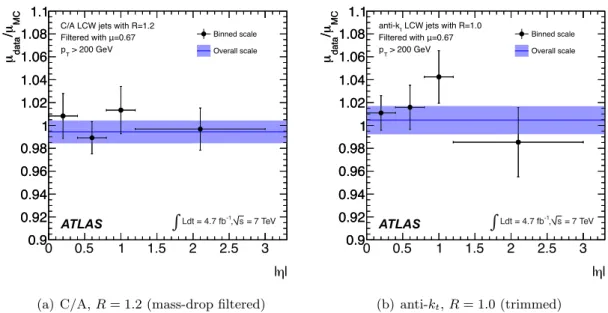
detector effects, as well as physics effects such as contributions from the UE and hadroniza-tion that are not completely removed by the grooming procedures. The ratio (µdata/µMC) is therefore the relevant figure of merit for any mismodelling of the reconstructed scale in Monte Carlo simulation. A relative scale difference of (−0.6 ± 1.0)% is found for C/A jets after mass-drop filtering, whereas the value is (0.5± 1.2)% for anti-kt jets after trimming. The uncertainties are statistical, as extracted from the fitting procedure.
| η | 0 0.5 1 1.5 2 2.5 3 MC μ/ data μ 0.9 0.92 0.94 0.96 0.98 1 1.02 1.04 1.06 1.08 1.1 MC μ/ data μ 0.9 0.92 0.94 0.96 0.98 1 1.02 1.04 1.06 1.08 1.1 Binned scale Overall scale ATLAS
C/A LCW jets with R=1.2 Filtered with μ=0.67 > 200 GeV T p = 7 TeV s , -1 Ldt = 4.7 fb
∫
(a) C/A, R = 1.2 (mass-drop filtered)
| η | 0 0.5 1 1.5 2 2.5 3 MC μ/ data μ 0.9 0.92 0.94 0.96 0.98 1 1.02 1.04 1.06 1.08 1.1 MC μ/ data μ 0.9 0.92 0.94 0.96 0.98 1 1.02 1.04 1.06 1.08 1.1 Binned scale Overall scale ATLAS Filtered with μ=0.67 > 200 GeV T p LCW jets with R=1.0 t anti-k = 7 TeV s , -1 Ldt = 4.7 fb
∫
(b) anti-kt, R = 1.0 (trimmed)Figure 13. The ratio µdata/µMC as a function of jet |η| for (a)Cambridge–Aachen R = 1.2 after mass-drop filtering and(b)anti-kt R = 1.0 after trimming.
It is also possible to repeat the fitting procedure after dividing the data and Monte Carlo simulation samples into bins of|η|. This allows a test of any potential |η| dependence in a range outside that covered by track-jet techniques. The result of these fits can be seen in figure 13. The results extracted in individual bins show no statistically significant deviation from the average.
Furthermore, systematic uncertainties are evaluated for this technique. The Monte Carlo modelling is assessed by replacing the t¯t and single-top samples with alternative samples as described in section 2.2. The impact of mismodelling of the jet resolution is assessed by applying additional smearing. The effect of mismodelling of the pT scale is studied by shifting the scale in the Monte Carlo predictions. Other systematic uncertainties considered are: a possible bias in the fitting procedure; cross-section uncertainties; muon reconstruction uncertainties; energy, resolution and b-tagging uncertainties associated with the additional jet; Emiss
T reconstruction uncertainties. The most significant of these are the uncertainties associated with Monte Carlo modelling and jet resolution.
The final relative scales including all uncertainties are, for Cambridge–Aachen jets (−0.6 ± 1.0(stat)+1.9
−1.7(syst))% and for anti-kt jets (+0.5± 1.2(stat)+2.7−2.7(syst))%. There is therefore no observed discrepancy between data and Monte Carlo simulation for jets originating from W bosons with pT& 200 GeV.