Publisher’s version / Version de l'éditeur:
BAOJ Nutrition, 2, 3, 2016
READ THESE TERMS AND CONDITIONS CAREFULLY BEFORE USING THIS WEBSITE. https://nrc-publications.canada.ca/eng/copyright
Vous avez des questions? Nous pouvons vous aider. Pour communiquer directement avec un auteur, consultez la première page de la revue dans laquelle son article a été publié afin de trouver ses coordonnées. Si vous n’arrivez pas à les repérer, communiquez avec nous à [email protected].
Questions? Contact the NRC Publications Archive team at
[email protected]. If you wish to email the authors directly, please see the first page of the publication for their contact information.
NRC Publications Archive
Archives des publications du CNRC
This publication could be one of several versions: author’s original, accepted manuscript or the publisher’s version. / La version de cette publication peut être l’une des suivantes : la version prépublication de l’auteur, la version acceptée du manuscrit ou la version de l’éditeur.
Access and use of this website and the material on it are subject to the Terms and Conditions set forth at
Shrimp protein improves oral glucose tolerance in high-fat diet-induced
obese mice
Wang, Yanwen; Sha, Yu; Nair, Sandhya; Gagnon, Jacques; Srinivasan,
Priya; Albert, Danica; Ewart, Stephen; Zhang, Junzeng; Hanna, Paul
https://publications-cnrc.canada.ca/fra/droits
L’accès à ce site Web et l’utilisation de son contenu sont assujettis aux conditions présentées dans le site LISEZ CES CONDITIONS ATTENTIVEMENT AVANT D’UTILISER CE SITE WEB.
NRC Publications Record / Notice d'Archives des publications de CNRC:
https://nrc-publications.canada.ca/eng/view/object/?id=807acf53-d1ef-4a5d-8b0f-551e0c5c1791 https://publications-cnrc.canada.ca/fra/voir/objet/?id=807acf53-d1ef-4a5d-8b0f-551e0c5c1791Shrimp Protein Improves Oral Glucose Tolerance in High-Fat Diet-Induced Obese Mice
Naional Research Council Canada, BAOJ Nutriion 2016 2: 3 2: 020
Yanwen Wang1*, Yu Sha1,2, Sandhya Nair1,2, Jacques Gagnon2*, Priya Srinivasan2, Danica Albert2, Stephen Ewart3, Junzeng Zhang4 and Paul Hanna5 1Natural Health Products Program, Aquaic and Crop Resource Development, Naional Research Council Canada (NRC), Charlotetown, PE C1A 4P3,
Canada
2Coastal Zones Research Insitute Inc., Shippagan, NB E8S 1J2, Canada 3Novaceuics Consuling, 6501 Oak St. Halifax, NS B3L 1H5, Canada
4Natural Health Products Program, Aquaic and Crop Resource Development, NRC, Halifax, NS B3H 3Z1, Canada 5Atlanic Veterinary College, University of Prince Edward Island, Charlotetown, PE, Canada, C1A 4P3
*Corresponding author: Yanwen Wang, Natural Health Products Pro-gram, Aquaic and Crop Resource Development, Naional Research Council Canada (NRC), Charlotetown, PE C1A 4P3, Tel: 902-566-7953; E-mail: [email protected] & Jacques Gagnon, Coastal Zones Re-search Insitute Inc (CZRI), Shippagan, NB, Canada E8S 1J2, Tel: 506-336-6600; E-mail: [email protected]
Sub Date: 23 October, 2016, Acc Date: 29 October, 2016, Pub Date: 29 October, 2016
Citaion: Yanwen Wang, Yu Sha, Sandhya Nair, Jacques Gagnon, Priya Srinivasan, et al.(2016) Shrimp Protein Improves Oral Glucose Tolerance in High-Fat Diet-Induced Obese Mice. BAOJ Nutriion 2: 020.
Copyright: © 2016 Naional Research Council Canada. This is an open-access aricle distributed under the terms of the Creaive Commons Atribuion License, which permits unrestricted use, distribuion, and reproducion in any medium, provided the original author and source are credited.
Research
Abstract
he present study was conducted to determine the efect of shrimp protein concentrate on insulin resistance in a diet-induced obese mouse model. Male C57BL/6J mice fed a commercial high-fat diet (60 kcal% from fat) for 12 weeks were divided into three groups and then switched to a high-fat diet prepared in the lab. One group was used as the high-fat diet control and the other two were fed the high-fat diet with 35% or 70% of casein replaced by the same amount of protein from shrimp protein concentrate for 9 weeks. A group of age and sex matched C57BL/6J mice fed a low-fat diet (10% kcal from fat) all the time were used as the normal or low-fat diet control. Weekly body weight, daily food intake, weekly 4-hr fasting blood glucose, oral glucose tolerance and overnight fasting blood glucose, insulin and lipids were measured. It was observed that replacing dietary casein with shrimp protein signiicantly improved oral glucose tolerance and 4-hr fasting blood glucose levels while having no efect on the fasting blood glucose and insulin levels. here was a trend of increasing body weight and food intake, particularly at 35% replacement, which also increased blood total cholesterol levels while having no efect on triacylglycerol levels. here were mixed results of shrimp protein concentrate on metabolic phenotypes while a dramatic improvement in oral glucose tolerance was seen. Additional studies are required to verify the observed beneits and further look into the underlying mechanisms.
Key Words: Diet-Induced Obese Mice; Shrimp Protein
Concen-trate; Glucose Tolerance; Glucose; Insulin; lipids
Introducion
he marine environment represents a large source of bioactive compounds which have recently been identiied as having diverse biological activities and health beneits [1]. hus, there is an increasing interest to explore marine bioactives for the discovery and development of drugs and natural health products. However, the majority of drug discovery and product development activities have been focused on small molecules.
Proteins and peptides are the largest portion of biomass of the marine environment and have been reported to possess various health beneits compared to other animal proteins. Peptides isolated from ish protein hydrolysates showed antihypertensive, antithrombotic
[2,3,4], anticoagulant [5], immune modulatory and anti-oxidant [1,5] activities. Fish proteins are also reported to improve metabolic syndrome and contribute to the prevention of type II diabetes mellitus (T2DM) [6,7]. A clinical study demonstrated that cod proteins, compared to beef, pork, veal, egg and milk proteins, signiicantly improved insulin sensitivity and β-cell function in subjects with insulin-resistance [7]. Similar results were observed in another study, which showed that cod proteins improved glucose tolerance and insulin function on glucose disposal [6]. Oral administration of ish collagen hydrolysate in Chinese patients with T2DM decreased the fasting serum glucose, insulin, leptin, resistin, total cholesterol, low-density lipoprotein cholesterol and triacylglycerol levels while increasing adiponectin concentrations [8]. Dietary supplementation of the same product induced a sharp decrease in the serum levels of high-sensitivity C-reactive protein, nonesteriied fatty acids (NEFA) and cytochrome P450, which all are associated with the development of insulin resistance and T2DM [9,10]. Furthermore, the serum levels of prostacyclin, a prostaglandin member of lipid molecules known as eicosanoids implicated in the development of diabetes [11] decreased ater the prolonged administration of this ish hydrolysate. In rats fed a high-fructose diet, sardine proteins induced a marked improvement in insulin resistance and glucose tolerance, reduced blood leptin and NEFA levels, which was accompanied by a reduction of adiposity [12]. Although limited, available information has demonstrated the
Page 2 of 7 Citaion: Yanwen Wang, Yu Sha, Sandhya Nair, Jacques Gagnon, Priya Srinivasan, et al. (2016) Shrimp Protein Improves Oral Glucose
Tolerance in High-Fat Diet-Induced Obese Mice. BAOJ Nutriion 2: 020. beneits of marine ish proteins, protein hydrolysates, or peptides derived from the protein hydrolysates on β-cell function, insulin action and glucose metabolism.
Shrimp processing produces a large amount of waste stream that contains predominantly proteins. here are no prior scientiic reports available for the efect of shrimp proteins on insulin resistance and diabetes. he present study demonstrates for the irst time that shrimp proteins are beneicial to blood glucose homeostasis and insulin sensitivity in a diet-induced obese and insulin resistant mouse model.
Materials and Methods
Preparation of Shrimp Protein Concentrate
Northern pink shrimp (Pandalus borealis) was processed at Island Fishermen Cooperative Association Ltd. (Lameque, NB, Canada). he wastes along with processing water were treated with the pending patent processing technology [13], which involves the addition of locculating agent and dissolved air loatation system. he aggregates formed from suspended and dissolved solids were collected from the surface. he remaining suspension was then subjected to horizontal centrifugation to further separate the solids from liquids. he liquids were pumped into a 3-phase vertical centrifuge to separate oil, water and solids. he solid obtained at diferent stage was named as shrimp protein concentrate and transported from the processing plant to the laboratory under frozen condition and stored at -20oC until further processing. he
material was thawed by leaving it at 4oC overnight, mixed manually,
and dried in a Freezone 4.5 litter benchtop freeze dry system (Labconco, Kansas, MI, USA). he dried protein concentrate was ground using an electric rotary grinder and used in the animal study.
Analysis of Shrimp Protein Concentrate
Unless otherwise speciied, the proximate analysis of shrimp protein concentrate was performed following the AOAC methods. Speciically, the ash content was analyzed by placing samples in a mule furnace at 550°C for a minimum of 5 hr (AOAC 920.153); moisture was determined in an air-forced oven at 103-105°C for 18 hr (AOAC 930.15); protein was determined using the block digestion method (AOAC 981.10), and iber was determined using the method of AOAC Ba 6a-05. Fat content was measured using the Folch method [14]. he content of carbohydrate was calculated as: 100% - (% moisture + % ash + % fat + % protein).
Animals and Diets
Sixty male C57BL/6J mice at 12 weeks of age were purchased from the Jackson Laboratory (Bar Harbor, ME). Twelve mice were fed a low-fat (10 kcal% fat; D12450J) and 48 were fed a high-fat (60 kcal% fat, D12492) diet (Research Diets, New Brunswick, NJ), starting at the age of 5 weeks in the Jackson Laboratory. Ater arrival, mice were housed individually in cages with a 12-hour light-dark cycle. hey were fed the same diets for another 5 weeks to allow further development of insulin resistance. hen, the high-fat diet-fed mice were divided into three groups based on semi-fasting blood glucose and body weight, and switched to a high-fat diet prepared in the laboratory. One group was used as a high-fat diet control (HFC) and the other two groups were treated with shrimp protein
concentrate by replacing 35% (T35) or 70% (T70) of casein with the same amount of proteins from the shrimp protein concentrate. he high-fat diet was a casein-cornstarch-sucrose-based AIN-93G diet modiied to contain 60 kcal% from fat in a form of lard and sunlower oil mix (96:4, wt/wt). he mice on the low-fat diet were switched to the standard AIN-93G diet (LFC; 11 kcal% from fat) prepared in the laboratory. he composition of diets is presented in Table 1. he body weight was obtained weekly and food intake was recorded every day throughout the study period. Ater 9 weeks of treatment, the animals were fasted overnight and anesthetized with inhalation of isolurane (Pharmaceutical Partners of Canada Inc.). Blood was collected by cardiac puncture into serum tubes, kept at room temperature for approximately 2 hr, and then placed on ice. Ater centrifugation, serum was collected and stored at -80°C. he study protocol and procedures performed in this study were reviewed and approved by the Joint Animal Care and Research Ethics Committee of the National Research Council Canada-Aquatic and Crop Resource Development Portfolio and the University of Prince Edward Island. he study was conducted in accordance with the guidelines of the Canadian Council on Animal Care.
Measurement of Semi-Fasting Blood Glucose
hroughout the 9-week treatment period, 4-hr semi-fasting blood Table 1: Composiion of experimental diet (g)
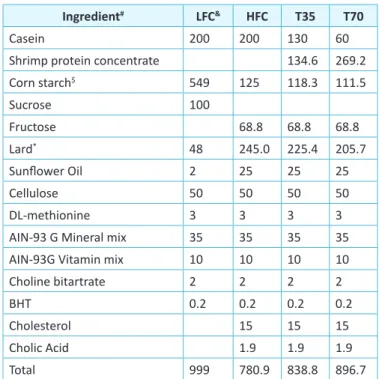
Ingredient# LFC& HFC T35 T70
Casein 200 200 130 60
Shrimp protein concentrate 134.6 269.2 Corn starch$ 549 125 118.3 111.5 Sucrose 100 Fructose 68.8 68.8 68.8 Lard* 48 245.0 225.4 205.7 Sunlower Oil 2 25 25 25 Cellulose 50 50 50 50 DL-methionine 3 3 3 3
AIN-93 G Mineral mix 35 35 35 35 AIN-93G Vitamin mix 10 10 10 10 Choline bitartrate 2 2 2 2
BHT 0.2 0.2 0.2 0.2
Cholesterol 15 15 15
Cholic Acid 1.9 1.9 1.9
Total 999 780.9 838.8 896.7
#All ingredients were purchased from Dyets Inc. (Bethlehem, PA, USA).
$Carbohydrate contributed by shrimp protein concentrate was subsituted
for the same amount of corn starch.
*Oil contributed by shrimp protein concentrate was subsituted for the
same amount of lard.
&LFC, low-fat diet control; HFC, high-fat diet control; T35, high-fat diet
with 35% of casein being replaced with the same amount of protein from shrimp protein concentrate; T70, high-fat diet with 70% of casein being replaced with the same amount of protein from shrimp protein concentrate.
glucose was measured weekly from the lateral tail vein using an ACCU-Check glucometer (Roche Diagnostics, Ontario, Canada).
Oral Glucose Tolerance Test
he oral glucose tolerance test (OGTT) was performed ater 7 weeks of treatment. Briely, following 4-hr fasting, mice were orally gavaged with 2 g/kg body weight of glucose (D-(+)-glucose (99.5%; Sigma-Aldrich, Markham, ON, Canada) dissolved in water (40%, w/v). Blood glucose levels were measured with the glucometer from the tail vein at 0, 15, 30, 60, and 120 min, respectively.
Analysis of Fasting Blood Glucose
Fasting serum glucose was measured in duplicate in the laboratory using an enzymatic method, with the reagents purchased from Sekisui Diagnostics Inc. (Charlottetown, PE, Canada).
Analysis of Serum Insulin
Fasting serum insulin was determined in duplicate using mouse ELISA kits (Crystal Chem Inc. IL, USA) following the kit instructions. Standards at a series of concentrations were run in parallel with the samples. he concentrations were calculated in reference to the standard curve.
Analysis of Serum Lipids
Serum total cholesterol (T-C) and triacylglycerols (TAG) were measured in duplicate on a Pointe-180 chemistry analyzer using the reagents purchased from the manufacturer (Pointe Scientiic Inc., Canton, MI).
Statistical Analysis
Data were analyzed using SAS 9.1 (SAS Institute, Cary, NC). he diference between the LFC and HFC groups was determined using the Student’s t-test. he treatment efects were determined using one-way ANOVA. Each method with repeated measures was used for the parameters that were measured multiple times. When a signiicant treatment efect was detected, diferences among the HFC and treatment groups were determined using the pair-wise comparison of the least squares means test. he signiicance level was set as p < 0.05. he data are presented as means ± S.E.M.
Results
Composition of Shrimp Protein Concentrate
he shrimp protein concentrate contained 52% protein as estimated based on the total nitrogen content, 24.8% ash, 14.6% fat, and 5% carbohydrate (Table 2). he macronutrients were adjusted in the
treatment diets to ensure that the treatment and HFC diets had similar content of total protein, fat, carbohydrate and energy density. he ash content was not adjusted due to the compositional diferences between ash and the mineral mix, meaning that T35 and T70 diets had slightly higher ash content than the HFC diet.
Food Intake and Body Weight
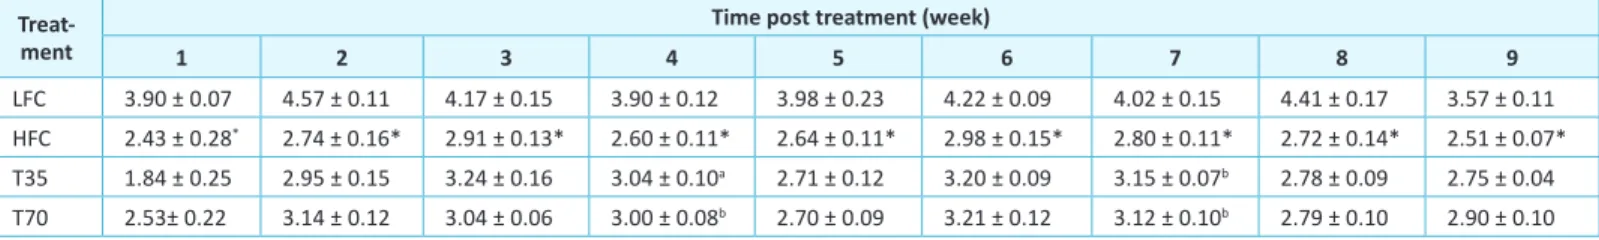
he food intake of mice in the HFC group was consistently lower than that in the LFC group, in accordance with the energy density of the diets (Table 3). Compared to the HFC group, treatments T35 and T70 increased food intake in weeks 4 and 7 while had no signiicant efect in other weeks. he HFC group was heavier than the LFC group at the beginning of treatment. Surprisingly, ater the irst week of treatment the diference disappeared (Table 4). his efect remained throughout the rest of the study period. In order to incorporate shrimp protein concentrate in diet, a high-fat control diet (AIN-93G modiied to have 60 kcal% fat) was prepared in the laboratory and the treatment diets were prepared by replacing 35% and 70% of casein with the same amount of protein from the shrimp protein concentrate, respectively. he composition of the high-fat and low-fat diets was slightly diferent from the respective commercial ones from Research Diets Inc. he T35 group tended to increase the body weights throughout the treatment period and was signiicantly heavier than the HFC group at the end of weeks 6 and 7. However, the T70 group showed similar weekly body weights with the HFC group.
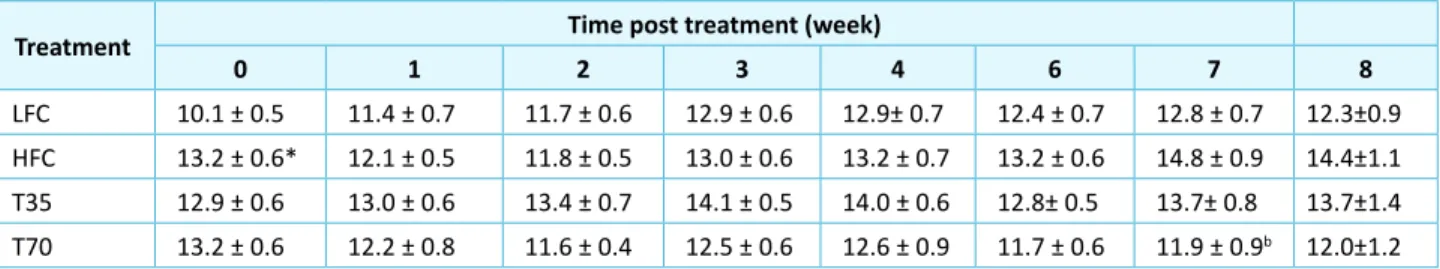
Efect of Shrimp Protein on Semi-Fasting Blood Glucose Levels
Before the treatment, the HFC group showed higher (p < 0.05) semi-fasting blood glucose levels than the LFC group (Table 5). Ater one week on the experimental diets, the diference between the LFC and HFC groups disappeared, consistently with the body weight changes, but started to show up again in the later of treatment. Ater 7 weeks, the HFC was higher than the LFC group at a marginal signiicance level (p = 0.09), but was reversed in the
Table 2: Composiion of shrimp protein concentrate % of fresh weight Moisture 5.2 Crude protein 52.0 Lipids 14.6 Carbohydrates 5.0 Ash 24.8
Table 3: Efect of shrimp protein concentrate on the food intake of high-fat diet-fed C57BL/6J mice
Treat-ment
Time post treatment (week)
1 2 3 4 5 6 7 8 9
LFC 3.90 ± 0.07 4.57 ± 0.11 4.17 ± 0.15 3.90 ± 0.12 3.98 ± 0.23 4.22 ± 0.09 4.02 ± 0.15 4.41 ± 0.17 3.57 ± 0.11 HFC 2.43 ± 0.28* 2.74 ± 0.16* 2.91 ± 0.13* 2.60 ± 0.11* 2.64 ± 0.11* 2.98 ± 0.15* 2.80 ± 0.11* 2.72 ± 0.14* 2.51 ± 0.07*
T35 1.84 ± 0.25 2.95 ± 0.15 3.24 ± 0.16 3.04 ± 0.10a 2.71 ± 0.12 3.20 ± 0.09 3.15 ± 0.07b 2.78 ± 0.09 2.75 ± 0.04
T70 2.53± 0.22 3.14 ± 0.12 3.04 ± 0.06 3.00 ± 0.08b 2.70 ± 0.09 3.21 ± 0.12 3.12 ± 0.10b 2.79 ± 0.10 2.90 ± 0.10
LFC, low-fat diet control; HFC, high-fat diet control; T35, high-fat diet with 35% of casein being replaced with the same amount of protein from shrimp protein concen-trate; T70, high-fat diet with 70% of casein being replaced with the same amount of protein from shrimp protein concentrate. Data are presented as means ± SEM (g/d; n = 9-12). *Diferent from LFC group, p< 0.0001; adiferent from HFC, p < 0.01; bdiferent from HFC, p < 0.05.
Page 4 of 7 Citaion: Yanwen Wang, Yu Sha, Sandhya Nair, Jacques Gagnon, Priya Srinivasan, et al. (2016) Shrimp Protein Improves Oral Glucose
Tolerance in High-Fat Diet-Induced Obese Mice. BAOJ Nutriion 2: 020.
T70 group (p < 0.05).
Efect of Shrimp Protein on Oral Glucose Tolerance
Following oral glucose loading, the blood glucose levels quickly increased and reached the peak levels at 30 min in every group and then started to decline and returned nearly to the basal levels ater 120 min (Figure 1). Mice in the HFC group showed higher (p < 0.05)
levels of blood glucose at 30, 60, 90, and 120 min, respectively, than those in the LFC group, indicating that impaired glucose tolerance was developed in mice fed the high-fat diet. he T35 group showed similar blood glucose levels at each time point with the HFC group. However, the T70 group showed lower glucose levels than the HFC group at each time point and signiicantly lower (p < 0.01) at 60 min and 90 min, respectively. Consistently, the HFC group showed Table 4: Efect of shrimp protein concentrate on the body weight of high-fat diet-fed C57BL/6J mice
Treatment Time post treatment (week)
0 1 2 3 4 6 7 9
LFC 30.2 ± 0.5 32.4 ± 0.5 34.3 ± 0.6 35.6 ± 0.6 36.7± 0.6 37.4 ± 0.7 38.8 ± 0.7 37.9 ± 0.7
HFC 40.1 ± 1.6* 35.6 ± 1.4 35.2 ± 1.6 35.6 ± 1.7 35.9 ± 1.6 36.5 ± 1.7 37.5 ± 1.8 37.3 ± 2.1
T35 41.6 ± 0.8 37.3 ± 1.1 37.8 ± 1.0 38.9 ± 1.0 40.3 ± 1.0 41.2 ± 1.0b 43.3 ± 1.0b 41.9 ± 1.2
T70 39.8 ± 1.3 35.9 ± 1.4 35.8 ± 1.2 36.2 ± 1.1 36.9 ± 1.2 36.7 ± 1.4 38.1 ± 1.5 37.5 ± 1.8
LFC, low-fat diet control; HFC, high-fat diet control; T35, high-fat diet with 35% of casein being replaced with the same amount of protein from shrimp protein concentrate; T70, high-fat diet with 70% of casein being replaced with the same amount of protein from shrimp protein concentrate. Data are presented as means ± SEM (g; n = 9-12). *Diferent from LFC group, p< 0.0001; bdiferent from HFC, p < 0.05.
Table 5: Efect of shrimp protein concentrate on semi-fasing (4-hr) blood glucose levels in high-fat diet-fed C57BL/6J mice
Treatment Time post treatment (week)
0 1 2 3 4 6 7 8
LFC 10.1 ± 0.5 11.4 ± 0.7 11.7 ± 0.6 12.9 ± 0.6 12.9± 0.7 12.4 ± 0.7 12.8 ± 0.7 12.3±0.9
HFC 13.2 ± 0.6* 12.1 ± 0.5 11.8 ± 0.5 13.0 ± 0.6 13.2 ± 0.7 13.2 ± 0.6 14.8 ± 0.9 14.4±1.1
T35 12.9 ± 0.6 13.0 ± 0.6 13.4 ± 0.7 14.1 ± 0.5 14.0 ± 0.6 12.8± 0.5 13.7± 0.8 13.7±1.4
T70 13.2 ± 0.6 12.2 ± 0.8 11.6 ± 0.4 12.5 ± 0.6 12.6 ± 0.9 11.7 ± 0.6 11.9 ± 0.9b 12.0±1.2
LFC, low-fat diet control; HFC, high-fat diet control; T35, high-fat diet with 35% of casein being replaced with the same amount of protein from shrimp protein concentrate; T70, high-fat diet with 70% of casein being replaced with the same amount of protein from shrimp protein concentrate. Data are presented as means ± SEM (g; n = 9-12). *Diferent from LFC group, p< 0.0001; bdiferent from HFC, p < 0.05.
Figure 1: Efect of shrimp protein concentrate on oral glucose tolerance in mice. Values are means ± SEM, n=9-12. $diferent from HFC, p < 0.01; #diferent from LFC, p < 0.01; &diferent from LFC, p < 0.05. LFC, low-fat diet control; HFC, high-fat diet control; T35, high-fat diet with 35% of casein
being replaced with the same amount of protein from shrimp protein concentrate; T70, high-fat diet with 70% of casein being replaced with the same amount of protein from shrimp protein concentrate.
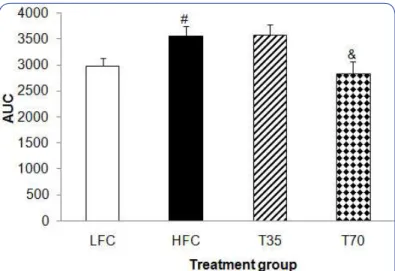
BAOJ Nutriion, an open access journal Volume 2; Issue 3; 020 higher (p < 0.05) AUC of the oral glucose tolerance than the LFC
group but was reversed (p < 0.05) in the T70 group (Figure 2). he results demonstrated the beneicial efect of 70% replacement of casein with shrimp protein on insulin sensitivity.
Efect of Shrimp Protein on Fasting Serum Glucose and Insulin Levels
Figure 2: Efect of shrimp protein concentrate on the area under the curve (AUC) of oral glucose tolerance in mice. Values are means ± SEM, n=9-12. &diferent from HFC, p < 0.05; #diferent from LFC, p < 0.05.
LFC, low-fat diet control; HFC, high-fat diet control; T35, high-fat diet with 35% of casein being replaced with the same amount of protein from shrimp protein concentrate; T70, high-fat diet with 70% of casein being replaced with the same amount of protein from shrimp protein concentrate.
he fasting serum insulin and glucose levels were similar between the HFC and LFC groups (Table 6). he replacement of dietary casein with shrimp protein concentrate had no signiicant efect on both fasting blood glucose and insulin levels compared to the HFC group.
Serum Lipids
he Serum total cholesterol levels were not altered in the HFC group compared to the LFC group (Table 6). Surprisingly, T35 Table 6: Efect of shrimp protein concentrate on fasing (12-hr) blood glucose and insulin levels and lipids in high-fat diet-fed C57BL/6J mice
Treatment FBG (mmol/L) Insulin (ng/mL) T-C (mg/dL) TAG (mg/dL) LFC 11.2±0.6 0.25±0.03 163.1±11.4 58.5±4.7 HFC 10.2±0.4 0.24±0.01 181.5±10.9 37.8±2.6# T35 10.4±0.4 0.33±0.04 232.1±12.2& 41.6±3.0 T70 10.2±0.4 0.45±0.11 200.7±12.7 33.0±2.7 FBG, fasing blood glucose; HFC, high-fat diet control; LFC, low-fat diet control; TAG, triacylglycerol; T-C, total cholesterol; T35, high-fat diet with 35% of casein being replaced with the same amount of protein from shrimp protein concentrate; T70, high-fat diet with 70% of casein being replaced with the same amount of protein from shrimp protein concentrate. Data are presented as means ± SEM (g; n = 9-12). #Diferent
from LFC; &diferent from HFC, p < 0.05.
increased (p < 0.05) blood cholesterol levels while T70 had no efect. he HFC lowered (p < 0.05) TAG levels as compared with the LFC group, and no efect of shrimp protein concentrate was observed.
Discussion
Excessive caloric intake is a major driving force behind escalating obesity and type 2 diabetes epidemics worldwide [15]. he diet composition and dietary ingredients play an important role in the prevention of type 2 diabetes. Consumption of proteins such as soy protein and ish protein is associated with decrease of plasma glucose and insulin concentrations and improvement of glucose tolerance [7,16]. However, there was no information about the impact of shrimp protein on glucose homeostasis and insulin sensitivity. he present study demonstrated for the irst time the antidiabetic property of a shrimp protein concentrate in mice fed a high-fat diet.
High-fat diet-induced obesity in C57BL/6 mice share human obesity phenotypes such as impaired glucose tolerance and type 2 diabetes [17]. herefore, this model has been increasingly used to determine preclinically the in vivo anti-diabetic efects of pharmaceutical drugs, diets and naturally-occurring compounds. his model is especially useful for the evaluation of diets and natural health products wherein they are mainly used for the prevention rather than treatment due to their relatively lower eicacies but better safety proiles. herefore, the indings of the current study are more applicable for the prevention of type-2 diabetes and insulin resistance. It may also be used as a co-treatment with a diabetic drug so as to lower the drug dosage and reduce the side efects associated with drugs.
he observations of the present study were largely consistent with the inding of a previous study in C57BL/6 mice, showing that a high-fat diet induced hyperglycemic and glucose intolerance [18]. he increase of insulin secretion is a compensatory response to insulin resistance [19]. Yet the fasting blood insulin was not elevated signiicantly in the HFC mice, which is not in line with the reports of previous studies [19,18]. his discrepancy might be a result of the mild insulin resistance developed in mice due to the weight loss in the irst week of treatment and did not increase substantially throughout the treatment period. he mice lost weight in the irst week ater the switch from the commercial to the laboratory-made high-fat diet although they had the same energy density, protein concentration and similar fat content. he commercial high-fat diet contained 12.5% maltodextrin and 6.9% sucrose, while the high-fat diet prepared in the laboratory contained 12.5% starch and 10% fructose. In addition, the high-fat diet prepared in the laboratory contained 2.5% of sunlower oil instead of soybean oil and additional 0.19% cholic acid and 1.5% of cholesterol. It is not possible to conclude if these diferences in the amount and composition of speciic carbohydrate ingredients and other compounds led to the weight loss and partial reverse of hyperglycemia at the beginning of the treatment, which is worth further investigation. Although fasting blood glucose and insulin levels were not signiicantly diferent among the treatment groups and the HFC, the oral glucose tolerance test demonstrated
Page 6 of 7 Citaion: Yanwen Wang, Yu Sha, Sandhya Nair, Jacques Gagnon, Priya Srinivasan, et al. (2016) Shrimp Protein Improves Oral Glucose
Tolerance in High-Fat Diet-Induced Obese Mice. BAOJ Nutriion 2: 020. that the high-fat diet resulted in a signiicant impairment of oral glucose tolerance, which was substantially improved or reversed by replacing dietary casein with the same amount of protein from the shrimp protein concentrate.
he mechanism by which shrimp protein concentrate exerts its beneicial efects on glucose tolerance could be attributed to its speciic amino acid composition. It is reported that leucine and isoleucine modify glucose homeostasis and insulin secretion [20,21]. Some dipeptides characterized by the presence of branched-chain amino acids stimulated glucose uptake and glycogen synthesis rate ater oral administration [22] and these peptides could be released during in vivo enzymatic hydrolysis of marine proteins following their ingestion. hese peptides may stimulate glucose uptake in skeletal-muscle cells and isolated muscles via the phosphoinositide 3-kinase and atypical protein kinase C pathways, which are diferent from the insulin signaling pathway. Another possible mechanism that has been postulated is the inhibitory action on the angiotensin-converting enzyme. It is reported that angiotensin converting enzyme inhibition by protein hydrolysates increases glucose metabolism by improving insulin secretion and sensitivity [23,24]. In the present study, although not signiicant the T35 and T70 consistently resulted in higher serum insulin levels than the HFC group. he angiotensin converting enzyme inhibitory peptides identiied in some ish hydrolysates have been found to promote the serum levels of bradykinin and increase glucose transport [25,23, 26,24] and the expression of adiponectin, hence improving insulin sensitivity [8]. A similar relationship between angiotensin-converting enzyme inhibitory peptides of a sardine hydrolysate and suppression of rising blood-glucose levels ater glucose loading was observed in an animal study [27]. A study in Chinese patients with T2DM demonstrated that the supplementation of marine collagen peptides from ish hydrolysate at a daily feeding rate of 13 g for 3 months signiicantly reduced the fasting blood glucose, glycated hemoglobin A1c, fasting blood insulin, TAG, total cholesterol, low-density lipoprotein cholesterol, and free fatty acid levels but increased high-density lipoprotein cholesterol levels and insulin sensitivity index ater 1.5 or 3 months [8]. Signiicant decreases in high-sensitivity C-reactive protein and nitric oxide but increases in bradykinin, prostaglandin I2, and adiponectin were also detected ater consumption of marine collagen peptides from ish hydrolysates [8].
In addition to proteins, shrimp protein concentrate contained 14% lipids, contributing to approximately 1.3% and 2.6% lipids in the T35 and T70 diets. Shrimp oil has a better fatty acid proile than lard, in terms of unsaturated fatty acids, especially polyunsaturated omega-3 EPA and DHA. Many studies have demonstrated the beneicial efects of omega-3 fatty acids on insulin sensitivity [28,29]. he lipids in the shrimp protein concentrate also contained a signiicant amount of astaxanthin, vitamins E and A, which are strong anti-oxidants and have been reported to positively afect insulin function and glucose metabolism [30,31].
In summary, the present study demonstrated that replacing
dietary casein with the same amount of protein from the shrimp protein concentrate improved the impaired glucose tolerance and semi-fasting blood glucose in high-fat diet-induce obese mice. he beneicial action of shrimp protein concentrate on insulin sensitivity occurred without reductions in body weight or adiposity, strongly suggesting that shrimp protein concentrate may protect against obesity-related insulin resistance by increasing insulin sensitivity and thus glucose disposal in the peripheral tissues. he anti-insulin resistant beneit of shrimp protein concentrate might be attributed to its speciic composition of amino acids, fatty acids and antioxidants. Shrimp protein concentrate could be a novel functional ingredient for preventing insulin resistance and diabetes or improving insulin resistance in diabetic patients as a co-treatment product with diabetic drugs. Further investigations are needed to verify the observed beneits and further look into the underlying mechanisms.
Acknowledgments
his study was funded by the Atlantic Canada Opportunity Agency (ACOA) through an Atlantic Innovation Fund (AIF) project #193594 and the Natural Health Products Program, Aquatic and Crop Resource Development, National Research Council of Canada. he authors would like to thank the staf at IRZC’s laboratory, especially Claude Pelletier, Mathieu Ferron and Nadia Tchoukanova, for their technical help. Our appreciation is given to our industrial partner, the Island Fishermen Cooperative Association (IFCA) for providing the shrimp material. he authors also thank the technicians in the animal facility of the Atlantic Veterinary College, University of Prince Edward Island for their assistance and animal care during the study.
References
1. Lordan S, Ross RP, Stanton C (2011) Marine bioacives as funcional food ingredients: Potenial to reduce the incidence of chronic diseas-es. Mar Drugs 9(6): 1056-1100.
2. Fujita H, Yoshikawa M (1999) Lkpnm: A prodrug-type ace-inhibitory pepide derived from ish protein. Immunopharmacology 44(1-2): 123-127.
3. Je JY, Park PJ, Kwon JY, Kim SK (2004) A novel angiotensin i convert-ing enzyme inhibitory pepide from alaska pollack (theragra chalco-gramma) frame protein hydrolysate. J Agric Food Chem 52(26): 7842-7845.
4. Mora L, Hayes M (2015) Cardioprotecive crypides derived from ish and other food sources: Generaion, applicaion, and future markets. J Agric Food Chem 63(5): 1319-1331.
5. Rajapakse N, Jung WK, Mendis E, Moon SH, Kim SK (2005) A novel an-icoagulant puriied from ish protein hydrolysate inhibits factor xiia and platelet aggregaion. Life Sci 76(22): 2607-2619.
6. Lavigne C, Marete A, Jacques H (2000) Cod and soy proteins com-pared with casein improve glucose tolerance and insulin sensiivity in rats. Am J Physiol Endocrinol Metab 278(3): E491-500.
7. Ouellet V, Marois J, Weisnagel SJ, Jacques H (2007) Dietary cod pro-tein improves insulin sensiivity in insulin-resistant men and women: A randomized controlled trial. Diabetes Care 30(11): 2816-2821.
8. Zhu CF, Li GZ, Peng HB, Zhang F, Chen Y, et al. (2010) Treatment with marine collagen pepides modulates glucose and lipid metabolism in chinese paients with type 2 diabetes mellitus. Appl Physiol Nutr Me-tab 35(6): 797-804.
9. Asfandiyarova N, Kolcheva N, Ryazantsev I, Ryazantsev V (2006) Risk factors for stroke in type 2 diabetes mellitus. Diab Vasc Dis Res 3(1): 57-60.
10. Doi Y, Kiyohara Y, Kubo M, Ninomiya T, Wakugawa Y, et al. (2005) Elevated c-reacive protein is a predictor of the development of dia-betes in a general japanese populaion: The hisayama study. Diadia-betes Care 28(10): 2497-2500.
11. Ylikorkala O, Kaila J, Viinikka L (1981) Prostacyclin and thromboxane in diabetes. Br Med J (Clin Res Ed) 283(6300): 1148-1150.
12. Madani Z, Louchami K, Sener A, Malaisse WJ, Ait Yahia D (2012) Di-etary sardine protein lowers insulin resistance, lepin and tnf-alpha and beneicially afects adipose issue oxidaive stress in rats with fructose-induced metabolic syndrome. Int J Mol Med 29(2): 311-318.
13. Tchoukanova N, Benoit G (2014) Method for extracing organic solids and oil from marine organisms enriched with astaxanthin. Google Patents. USA.
14. Folch J, Lees M, Sloane Stanley GH (1957) A simple method for the isolaion and puriicaion of total lipides from animal issues. J Biol Chem 226(1): 497-509.
15. Hu FB (2011) Globalizaion of diabetes: The role of diet, lifestyle, and genes. Diabetes Care 34(6): 1249-1257.
16. Tremblay F, Lavigne C, Jacques H, Marete A (2003) Dietary cod pro-tein restores insulin-induced acivaion of phosphaidylinositol 3-ki-nase/akt and glut4 translocaion to the t-tubules in skeletal muscle of high-fat-fed obese rats. Diabetes 52(1): 29-37.
17. Winzell MS, Ahren B (2004) The high-fat diet-fed mouse: A model for studying mechanisms and treatment of impaired glucose tolerance and type 2 diabetes. Diabetes 53: S215-219.
18. Rossmeisl M, Rim JS, Koza RA, Kozak LP (2003) Variaion in type 2 diabetes--related traits in mouse strains suscepible to diet-induced obesity. Diabetes 52(8): 1958-1966.
19. Ahren B, Pacini G (2002) Insuicient islet compensaion to insulin re-sistance vs. Reduced glucose efeciveness in glucose-intolerant mice. Am J Physiol Endocrinol Metab 283: E738-744.
20. Banga A, Bodles AM, Rasouli N, Ranganathan G, Kern PA, et al. (2008) Calcium is involved in formaion of high molecular weight adiponec-in. Metab Syndr Relat Disord 6(2): 103-111.
21. Layman DK (2003) The role of leucine in weight loss diets and glucose homeostasis. J Nutr 133(1): 261S-267S.
22. Morifuji M, Koga J, Kawanaka K, Higuchi M (2009) Branched-chain amino acid-containing dipepides, ideniied from whey protein hy-drolysates, simulate glucose uptake rate in l6 myotubes and isolated skeletal muscles. J Nutr Sci Vitaminol (Tokyo) 55(1): 81-86.
23. Henriksen EJ, Jacob S, Fogt DL, Dietze GJ (1998) Efect of chronic bra-dykinin administraion on insulin acion in an animal model of insulin resistance. Am J Physiol 275(1 Pt 2): R40-45.
24. Uehara M, Kishikawa H, Isami S, Kisanuki K, Ohkubo Y, et al. (1994) Ef-fect on insulin sensiivity of angiotensin convering enzyme inhibitors with or without a sulphydryl group: Bradykinin may improve insulin resistance in dogs and humans. Diabetologia 37(3): 300-307. 25. Henriksen EJ, Jacob S (2003) Modulaion of metabolic control by
an-giotensin convering enzyme (ace) inhibiion. J Cell Physiol 196(1): 171-179.
26. Ishimura E, Okuno S, Kono K, Fujino-Kato Y, Maeno Y, et al. (2009) Glycemic control and survival of diabeic hemodialysis paients--importance of lower hemoglobin a1c levels. Diabetes Res Clin Pract 83(3): 320-326.
27. Otani L, Ninomiya T, Murakami M, Osajima K, Kato H, et al. (2009) Sardine pepide with angiotensin i-convering enzyme inhibitory ac-ivity improves glucose tolerance in stroke-prone spontaneously hy-pertensive rats. Biosci Biotechnol Biochem 73(10): 2203-2209. 28. Takkunen MJ, Schwab US, de Mello VD, Eriksson JG, Lindstrom J, et al.
(2015) Longitudinal associaions of serum faty acid composiion with type 2 diabetes risk and markers of insulin secreion and sensiivity in the innish diabetes prevenion study. Eur J Nutr 55(3): 967-979. 29. Yamamoto T, Kajikawa Y, Otani S, Yamada Y, Takemoto S, et al. (2014)
Protecive efect of eicosapentaenoic acid on insulin resistance in hyperlipidemic paients and on the postoperaive course of cardiac surgery paients: The possible involvement of adiponecin. Acta Med Okayama 68(6): 349-361.
30. Ishiki M, Nishida Y, Ishibashi H, Wada T, Fujisaka S, et al. (2013) Im-pact of divergent efects of astaxanthin on insulin signaling in l6 cells. Endocrinology 154(8): 2600-2612.
31. Yuan JP, Peng J, Yin K, Wang JH (2011) Potenial health-promoing ef-fects of astaxanthin: A high-value carotenoid mostly from microalgae. Mol Nutr Food Res 55(1): 150-165.