AFFORDABLE AUTONOMOUS LIGHTWEIGHT PERSONAL MOBILITY by
Michael Chia-Liang Lin
S.M.Arch.S., Massachusetts Institute of Technology (2006) S.M., Massachusetts Institute of Technology (2009)
Submitted to the Program in Media Arts and Sciences, School of Architecture and Planning, in partial fulfillment of the requirements for the degree of
Doctor of Philosophy at the
Massachusetts Institute of Technology February 2021
© Massachusetts Institute of Technology, 2021. All rights reserved Author ……… Program in Media Arts and Sciences
January 22, 2021 Certified by ……… Kent Larson Principal Research Scientist City Science Group, MIT Media Lab Accepted by
……… Tod Machover Academic Head, Program in Media Arts and Sciences
AFFORDABLE AUTONOMOUS LIGHTWEIGHT PERSONAL MOBILITY by
Michael Chia-Liang Lin
Submitted to the Program in Media Arts and Sciences, School of Architecture and Planning, on January 22, 2021, in partial fulfillment of the requirements for the degree of
Doctor of Philosophy
Abstract:
Self-driving cars and micro-mobility services are among the most important trends in the mobility
landscape. While robo-taxi services are still in the pilot phase, residents in many cities today are adopting micro-mobility services as a more affordable and energy-efficient last-mile alternative to traditional forms of transportation.
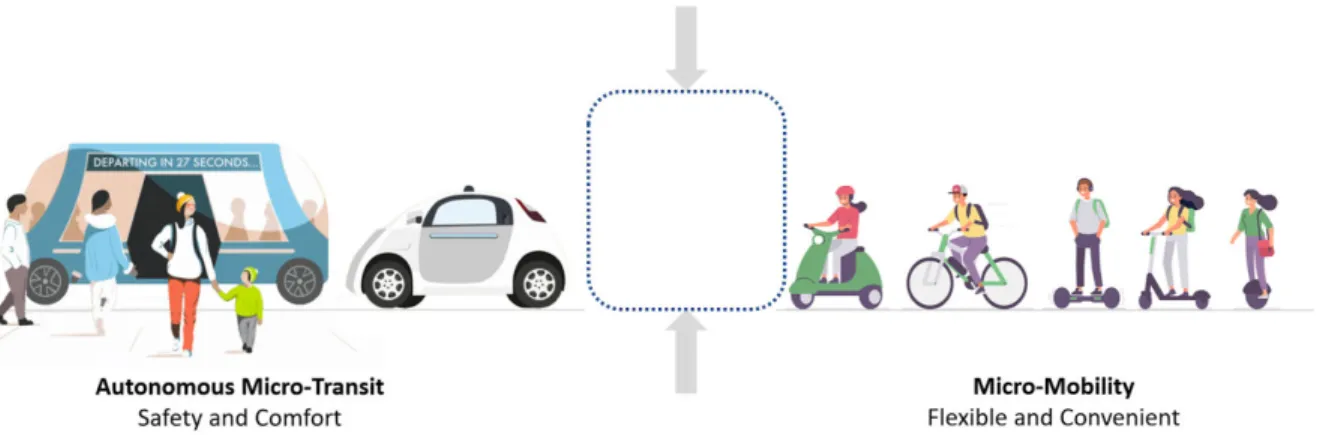
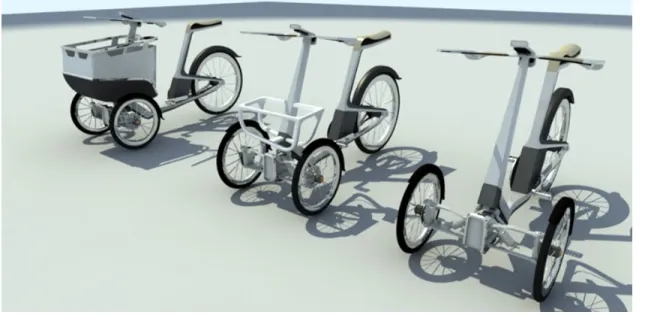
This dissertation proposes a new genre of urban mobility by bringing together the advantages of micro-mobility with those of the self-driving car. This dissertation presents a novel vehicle design that leverages the safety and autonomous navigation capabilities of a self-driving car while remaining ecologically responsible, lightweight, and affordable. In addition, the novel design enables new types of urban mobility services with the ability to operate autonomously in bike lanes and low-speed urban environments, and to provide door-to-door mobility delivery of both people and goods.
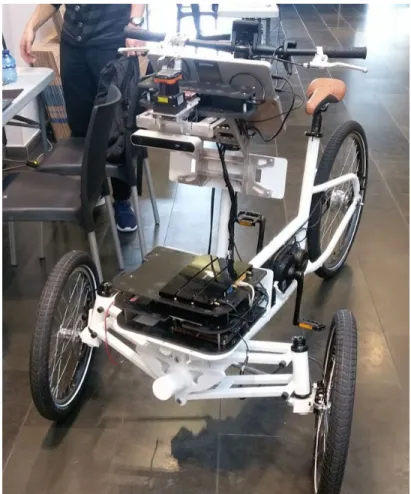
The proposed autonomous vehicle design takes a bottom-up approach, piecing together modularized hardware components and software blocks and giving rise to autonomous functionality. During the development of these systems, multiple full-scale working prototypes were completed, each designed to explore a specific research goal. The testing and evaluation of these prototypes were conducted within urban living labs, using the bike lanes of Cambridge, Taipei, and Andorra. Each prototype concluded with a public exhibition demonstrating the validity of these systems when applied to hypothetical mobility scenarios of the future.
This dissertation includes the following five contributions:
1. A new genre of mobility that enables novel mobility services of the future.
2. A software framework for autonomous navigation that utilizes low-cost sensors and computers. 3. A set of human-machine interactions using state-of-the-art autonomous vehicle perception as
input for establishing effective Vehicle-to-Pedestrian communications.
4. A new methodology for road tests and evaluation of these systems in the living environment. 5. The introduction of a possible decentralized community-based mobility industry. This dissertation
will describe the research story of successful cooperation across academic institutions, cities, industries, and borders.
Thesis advisor: Kent Larson
Affordable Autonomous Lightweight Personal Mobility By
Michael Chia-Liang Lin
Reader:
Hiroshi Ishii Jerome B. Wiesner Professor MIT Media Lab
Affordable Autonomous Lightweight Personal Mobility By
Michael Chia-Liang Lin
Reader:
Sertac Karaman Associate Professor MIT Department of Aeronautics and Astronautics
Acknowledgment
Thank you to my advisor, Kent Larson, for taking me under your wing, mo. va ng me to tackle
challenges, allowing me to learn from my mistakes, and helping me through the tough days with your warm personality and big heart.
To my City Science family, thank you all for your friendship and support throughout these years. To the core PEV team members, who relessly worked alongside me to bring the PEV vision closer to reality, I'd like to offer a hear elt thank you for your hard work, and for trus ng me on the journey of uncertainty. I would like to express my apprecia on to Wolfgang Gruel, a genuine companion who walked alongside me from the beginning of the project to the comple on of this thesis. Phil Tinn coordinated many of the daily efforts necessary to keep the research going. Carson Smuts cares for me like a brother, always listens to me, and shares ideas with me. Abhishek Agarwal worked with me and shared laughs and pulled "all-nighters" with me to build and test the early prototypes. Luis Alonso, thank you for your posi ve thinking and encouragement. Addi onally, Jason Nawyn and Stacie Slotnick walked the last meter of my Ph.D. work with me, provided guidance, and helped during the final push to
complete my doctoral journey.
I would also like to extend my gra tude to Premier Mao Chi-Kuo, the former President of Execu ve Yuan of Taiwan. Thank you for fostering the coopera on between MIT and Taiwan, which is stepping into the sixth year in 2021.
To our collaborator from DENSO, thank you, Tanaka-san, for your trust and endorsement in the collabora on. To Shimo-San, thank you for your advice in developing PEV’s core strength. To Shin and Yumiko, thank you for mo va ng me to think about both challenges and opportuni es. I will always cherish the me we spent together.
I want to express my sincere gra tude to Mr. Rubber Chen, the president of PMP. Thank you for the generous funding and resources to support our research ac vi es. Your ac on in helping people and improving people’s lives is a true inspira on to all of us. Thank you.
Finally, I want to recognize the consistent love and support from my baba and mama; thank you for your faith in me and the persistent trust. To Becky and Gary, thank you for your uncondi onal support. To my wife, Allison, I love you. Thank you for giving me the freedom to pursue my dream. Thank you for the selfless dedica on of your me, energy, and love to our daughters. To my baby girl, Makayla, and Avril, daddy hopes one day you get to read this thesis and experience daddy’s incredible journey and adventure of crea ng PEV.
Table of Contents
Acknowledgment 8
Table of Contents 9
List of Figures & Tables 13
Introducon 21 1: Background 23 1.1. Mobility Services 23 1.1.1 Ride-Sharing 23 1.1.2 Bike Sharing 25 1.1.3 Micro-Mobility Services 27
1.2 Challenges and Current Soluons ̀ 28
1.2.1 Challenges: 28
1.2.2 Current Soluons ̀ 29
1.3. Autonomous Vehicles 30
1.3.1 Technology Development 31
1.3.2 Impact and Controversy 33
1.3.3 Autonomous Micro-Transit 35
1.4 The Mobility Gap 36
1.4.1 A new Persuasive Electric Vehicle 38
2: Design Implementaon 41
2.1 Design Principles 41
2.1.1 Enable hybrid services 41
2.1.2 Reduce the cost of technology 42
2.1.3. Bike lane-friendly vehicle design 43
2.1.4. Coexist with cyclists and pedestrians 43
2.1.5. Persuade mobility behavior shis ̀ 44
2.2 Implementaon ̀ 46
2.2.2 Vehicle Stability 48
2.2.3 Steering 50
2.2.4 Suspension and Tilng ̀ 53
2.2.5 Ac ve Assist 57
2.2.6 Riding Ergonomics 58
2.2.7 Vehicle Safety 60
2.2.9 Full-Scale Working Prototype 69
3: Lite-Autonomy 73
3.1. The new approach 75
3.1.1. Imitaon ̀ learning from first-person to third-person 76
3.1.2 System Architecture 79
3.2 So ware Infrastructure 83
3.2.1 Mapping and Localizaon ̀ 84
3.2.2 Moon ̀ Planning 92
3.2.3 Low-Level Control 102
3.2.4 Duo Operaon ̀ Modes 104
3.3 Vehicle Percepon ̀ 107
3.3.1 LiDAR 108
3.3.2 Vision 110
3.3.3 Sensors 114
4: Living Lab Experiments 116
4.1 Research Infrastructure 116
4.2 Living Lab Retreats 120
4.2.1 Demo & Deploy 121
4.2.2. Museum and Industry exhibion: ̀ 124
4.3 Research Method and Evaluaon ̀ 128
4.3.1 Methods 128
4.3.2 Evaluaon ̀ 131
4.4 Daan Forest Park 133
4.4.1 Tesng ̀ Site Condions: ̀ 133
4.4.2 Demonstraon ̀ Plan 134 4.4.3 Preparaon ̀ 136 4.4.4 Demo Day 143 4.5 Technology Evaluaon ̀ 148 4.5.1 Technical Evaluaon: ̀ 148 4.5.2 User research 158
4.5.3 Summary & Conclusions 163
5: New PEV Design and Fabricaon 167
5.1 Vehicle Design 167
5.1.1 Design Workshop 167
5.1.3 General Packaging 174
5.2 Mechanical Engineering 177
5.2.1. Chassis Design 177
5.2.2 Design Feedback 183
5.2.3. Chassis Design and Engineering 186
5.2.4 Front-Assembly 193
5.3. Vehicle Styling 201
5.3.1 Facial Expression and Side Profile 202
5.3.2 Roof and Rear-Supporng ̀ Structure 204
5.3.3 Front Electrical Compartment and Ba. ery Housing 205
5.3.4 Rear Tail Lights 206
5.3.5 Rear-Storage 207
5.3.6 Thermal-Seat 208
5.3.7 The New PEV Design 209
6: Electrical Deployment 210
6.1 Hardware Architecture 211
6.1.1 Input and Output 212
6.1.2 Embedded System and Controllers 212
6.1.3 Computers and Networks 213
6.1.4 Arduino Camp 213 6.2 Sensing 216 6.2.1. Vision 216 6.2.2. Point Cloud 218 6.2.3. State Esma on 218 6.3 Actuaon 219 6.3.1. Steering Module 221 6.3.2 Mid-Drive Motor 222 6.3.3 Braking Module 223 6.4 Human-Machine-Interfaces 224 6.4.1 Mechanical-Eyes 225 6.4.2 DSM 228
6.4.3 HVAC and Air-Nozzle 229
6.4.4 LED Modules 232
7: Human-Machine-Interacon 235
7.2 The building blocks of Human-Machine-Interacon 237 7.2.1 Hapc Feedback 239 7.2.2 Audio Communicaon 241 7.2.3 Visual Communicaon 244 7.2.4 Mechanical-Eye 251 7.2.5 Posture Detecon 253
7.2.6 Rider’s Status Monitoring System 257
7.2.7 Facial Recognion 259
7.3 PEV HMI Matrix 260
8: Conclusion 266
8.1 Prototype Tesng and Tuning 266
8.1.1 Outdoor Technical Evaluaon 272
8.1.2 Indoor User Research Reviews 275
8.2 Demonstraon 283
8.2.1 Demo Scenarios 284
8.2.2 DENSO HQ DEMO 289
8.2.3 User Tesng and On-Site Evaluaon 290
8.3 Conclusion 293
8.3.1 Cooperaon without Borders 293
8.3.2 Future Opportunies 298
8.3.3 PEV and the City of Tomorrow 301
List of Figures & Tables
Figure 1.1a: Photo of On-Demand e-Hail App interface (PEV)
Figure 1.1b: Mode share: average proporon of trips by mode and length. England, 2014 Figure 1.1.2a: Jump eBike Staon, Los Altos, CA
Figure 1.1.2b: Jump Dockless eBike, Los Altos, CA Figure 1.1.3: Image of Micro-Mobility Devices
Figure 1.2.2a: Screenshot of Mobike Incenv e Program
Figure 1.2.2b: Adversemen t of the Bird Flyer Program from the website Figure 1.3.1a: Uber TAG Self-Driving Car
Figure 1.3.1b: Image Captured from Tesla demo video Figure 1.3.3: Autonomous Micro-Transit
Figure 1.4a: The gap between Autonomous Micro-Transit and Micro-Mobility Figure 1.4b: Features of the new mobility soluon
Figure 2.1: Hybrid Mobility Service Scenario (2015) Figure 2.2.1a: Cost of Transportaon vs. Bodyweight Figure 2.2.1b: Lightweight Chassis Concept (2014) Figure 2.2.2: Tadpole vs. Delta
Figure 2.2.3a: Differenal Steering (RobotC) Figure 2.2.3b: Ackermann Steering (RobotC) Figure 2.2.3c: Tadpole 1 Chassis Design
Figure 2.2.4a: Tadpole 1 Chassis Design with Leaf-Spring Front Suspension
Figure 2.2.4b: Tadpole 1 V1 Wood Prototype with Double-Wishbone Front Suspension Figure 2.2.4c: PEV G1 Prototype with rubber damper suspension
Figure 2.2.4d: Tadpole 1 V2 Prototype with wooden chassis (2015) Figure 2.2.4e: Tadpole 1 Aluminum Prototype V2 top view (2015) Figure 2.2.4f: Tadpole 1 Aluminum Prototype V2 side view (2015) Figure 2.2.5: Exploded Diagram of the Mid-Drive Electric Assist System Figure 2.2.6a: Human Ergonomics Study of rider posture
Figure 2.2.6b: PEV 1.0 Chassis (2016) Figure 2.2.6c: PEV 1.0 Chassis Fing (2016) Figure 2.2.7a: Lightweight Design Concept (2014) Figure 2.2.7b: Windshield Design Concept (2014) Figure 2.2.7c: PEV Structure Concepts (2015)
Figure 2.2.7d: Dual Operaon, Cargo-Mode (le), and Human-Mode (right) Figure 2.2.7e: Hybrid Mobility Service Scenario (2016)
Figure 2.2.7g: Quarter Scale PEV Wood Study Model
Figure 2.2.8a: PEV Chassis 1.0 Prototype with Sensor-Kit V1 (2016) Figure 2.2.8b: PEV Chassis 1.0 Prototype with Sensor-Kit V2 (2016) Figure 2.2.8c: Photo of Completed PEV 1.0 (2016)
Figure 2.2.8d: Sensor mounts
Figure 2.2.8e: Tesng sensor arrangements on PEV 1.0 chassis Figure 2.2.9a: LiDAR Scans of the Media Lab Courtyard
Figure 2.2.9b: PEV Tesng at the Media Lab Courtyard (2017) Figure 2.2.9c: PEV Road Test in Cambridge, MA (2017)
Figure 2.2.9d: PEV operates in the bike lane, Cambridge, MA (2017) Figure 3: Waymo Robo-Taxi (le) and PEV 1.2 (right)
Figure 3.1.1: Human Trails (le) and PEV Path Network (right) Figure 3.1.2a: Lite-Autonomy Major Systems Dataflow Figure 3.1.2b: Lite-Autonomy System Architecture
Figure 3.2: 3D Point Cloud Map of Ames Street, Cambridge, MA Figure 3.2.1.1: PEV Side Profile
Figure 3.2.1.2: ndt_mapping Node Figure 3.2.1.3a: ndt_matching Node
Figure 3.2.1.3b: LiDAR Scans and 3D Map, Daan Forest Park, Taipei
Figure 3.2.1.3c: LiDAR Scans and 3D Map, Shilin Autonomous Vehicle Test Site, Taipei Figure 3.2.2: Moon Planning System Diagram
Figure 3.2.2.1a: Global Planner System Diagram
Figure 3.2.2.1b: Top View of Human Trajectory (Green Line)
Figure 3.2.2.1c: Eding PEV path network (Java OpenStreetMap Editor) Figure 3.2.2.2a: Behavior State Generator
Figure 3.2.2.2b: Obstacle Avoidance Tesng (MIT Media Lab) Figure 3.2.2.3a: Local Planner System Diagram
Figure 3.2.2.3b: The cyan line represents the global planner’s path, and blue cells represent objects in the local environment
Figure 3.2.3: Low-Level Control System Diagram Figure 3.2.4a: Lite-Autonomy Human-Mode Data Flow Figure 3.2.4b: Lite-Autonomy Autonomous-Mode Data Flow Figure 3.3: Lite-Autonomy System Architecture
Figure 3.3.1a: PEV 1.2 LiDAR and Camera Side Coverage Figure 3.3.1b: Curb Detecon
Figure 3.3.1c: Obstacle Avoidance
Figure 3.3.2a: PEV Screenshot, Object Recognion (Yolo)
Figure 3.3.2b: PEV ScreenShoot, Traffic Light Detecon (TensorFlow) Figure 3.3.2c: PEV Screenshot, Lite-Autonomy Lane Center Maintaining
Figure 3.3.2d: Gesture Recognion Interacon at Cooper Hewi Road Ahead exhibion Figure 3.3.2e: 3D Point Cloud Map (Stereo Reconstrucon)
Figure 3.3.2f: Facial Recognion Figure 3.3.2g: Emoon Detecon
Figure 3.3.2h: PEV Screenshot of AprilTag Pose Esma on Result Figure 3.3.2i: AprilTag on Bike Lane
Figure 3.3.2j: AprilTag Road Test, Cambridge, 2018 Figure 3.3.3: eDonkey-Mode Road Test, TAF, Taipei, 2018 Figure 4.1.3a: Academia-Industry-Government Collaboraon Figure 4.1.3b: Taipei Tech Signing Ceremony
Figure 4.1.3c: PEV prototypes with MIT Team (le) and Taipei Tech Students (right) Figure 4.2.1a: First PEV Public Demonstraon (2016)
Figure 4.2.1b: Second PEV Public Demonstraon at TAF, Taipei 2016
Figure 4.2.1c: Deputy Mayor of Taipei Charles Lin Tesng PEV, Smart City Expo, Taipei, 2018 Figure 4.2.2a: PEV CES Prototype at CES, Las Vegas, 2017
Figure 4.2.2b: Mechanical-Eye, PEV Cooper Hewi prototype, 2018 Figure 4.2.2c: PEV Troubleshoong Manual
Figure 4.2.2d: Gesture Recognion and Emoon Detecon (Cooper Hewi) Figure 4.3.1: Diagram of Four-Stage Development
Figure 4.4.1a: Map of Daan Forest Park Figure 4.4.1b: Daan Forest Park Bike Lane Figure 4.4.2: Demonstraon Plan
Figure 4.4.3a: 2018 PEV Taipei Deployment Team
Figure 4.4.3b: PEV 1.1 Body Structure Assembly Workshop Figure 4.4.3c: PEV 1.2 Body Structure Detail
Figure 4.4.3d: Demo Preparaon Figure 4.4.3e: Road Test
Figure 4.4.3f: PEV LiDAR scans
Figure 4.4.4a: Preparaon (le two photos), Daan Forest Park Demo (right two photos) Figure 4.4.4b: Emergency Stop
Figure 4.4.4c: PEV Encounters Cyclist Figure 4.4.4d: PEV Platoon
Figure 4.4.4e: PEV featured on Discovery Channel, My Future Ride (2018) Figure 4.4.4f: Taiwan Air Force Innovaon Base (TAF)
Figure 4.5.1.1: Large-Scale Mapping Figure 4.5.1.2a: Examining Trajectory Figure 4.5.1.2b: Localizaon Accuracy Figure 4.5.1.3a: Late Night Road Test Figure 4.5.1.3b: Rush Hour Road Test Figure 4.5.1.4a: Emergency Stop Figure 4.5.1.4b: Obstacle Avoidance
Figure 4.5.1.5: AprilTag Road Test in the night Figure 4.5.1.6: PEV Following Human Trajectory
Figure 4.5.2.1: Photo of PEV 1.2 (front) and PEV 1.1 (back) Figure 4.5.2.2a: Parallel Autonomy
Figure 4.5.2.2b: PEV Human-Mode
Figure 4.5.2.3: Photo of PEV App on an Android Phone. Figure 4.5.3: Daan Road Test
Figure 5.1.1a: PEV Ideaon Workshop Ideas Figure 5.1.1b: Sketch of New PEV (2018)
Figure 5.1.2c: PEV General Packaging Concept (DIAM Creav e Design, 2018) Figure 5.1.2d: PEV Bicycle Parts
Figure 5.1.3a: General Packaging Sketch, Front View (DIAM Creav e Design, 2018) Figure 5.1.3b: General Packaging Sketch, Side View (DIAM Creav e Design, 2018) Figure 5.2.1.1: Conceptual Chassis Design (DIAM Creav e Design, 2018)
Figure 5.2.1.2: Chassis Design Reference (MIT Media Lab PEV 1.2) Figure 5.2.1.3a: Packaging Reference (PEV 1.2)
Figure 5.2.1.3b: Packaging Design (DIAM)
Figure 5.2.2.1: Issues Idenfied in the DIAM Design Proposal Figure 5.2.2.2: MIT Engineering Feedback
Figure 5.2.3.1: Ergonomics Comparison
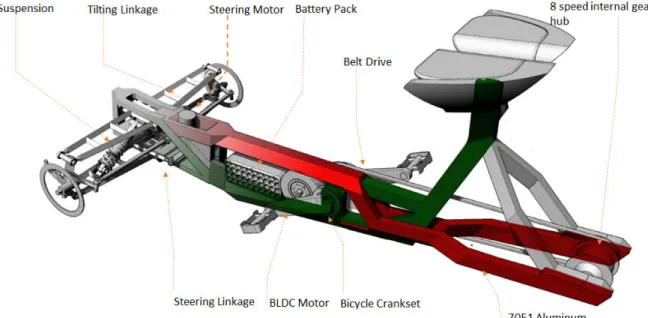
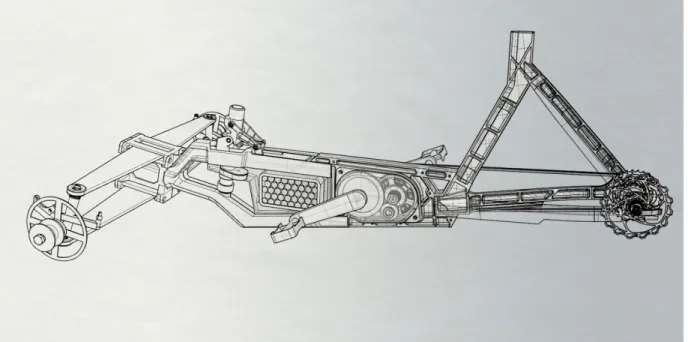
Figure 5.2.3.2a: New PEV Main-Frame Exploded Diagram Figure 5.2.3.2b: New PEV Main-Frame Design
Figure 5.2.3.3a: New PEV Main-Frame with Mid-Drive Motor and Bicycle Parts Figure 5.2.3.3b: Aluminum Tubing Components
Figure 5.2.4.1a: Front-Assembly Exploded Diagram
Figure 5.2.4.1b: Suspension Comparison, PEV 1.2 (le) and New PEV (right) Figure 5.2.4.2: PEV Tilng Simulaon
Figure 5.2.4.3a: Ackerman Steering Geometry Figure 5.2.4.3b: Steering Mechanism Cross-Secon Figure 5.2.4.3c: PEV Steering Geometry
Figure 5.2.4.4: Kingpin Geometry
Figure 5.2.4.5a: Front Assembly Components
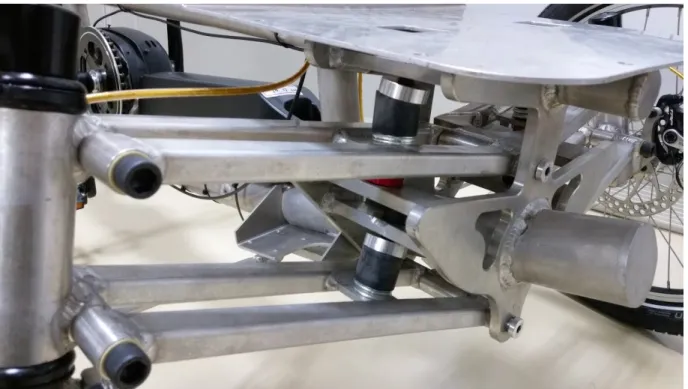
Figure 5.2.4.5b: Photo of Completed PEV Chassis Prototype
Figure 5.2.4.5c: Photo of the PEV Front-Assembly and the Mid-Drive Motor Figure 5.3: Vehicle Styling Concepts
Figure 5.3.1a: PEV Facial Expression Styling Sketch (DIAM Creav e Design, 2018) Figure 5.3.1b: PEV Side Profile Design Sketch (DIAM Creav e Design, 2018)
Figure 5.3.2: PEV Roof and Rear-Supporng Structure Styling Sketch (DIAM Creav e Design, 2018)
Figure 5.3.3: Front Electrical Compartment, Ba ery Housing Styling Sketch (DIAM Creav e Design, 2018)
Figure 5.3.4: Rear Tail Lights Styling Sketch (DIAM Creav e Design, 2018) Figure 5.3.5: Rear Storage Styling Sketch (DIAM Creav e Design, 2018) Figure 5.3.6: Thermal Seat Styling Sketch (DIAM Creav e Design, 2018) Figure 5.3.7: New PEV Design Sketch (DIAM Creav e Design, 2018) Figure 6.1: Hardware Architecture
Figure 6.1.4a: Arduino Camp System Diagram Figure 6.1.4b: Photo of the Arduino Camp Figure 6.1.5a: Power Management Module Figure 6.1.5b: PEV Ba ery Pack
Figure 6.2.1a: Vision-Module System Diagram Figure 6.2.1b: Posture Detecon
Figure 6.2. 2a: Top LiDAR Figure 6.2.2b: LiDAR-F
Figure 6.2.2c: Point Cloud System Diagram Figure 6.2.3a: State Esma on System Diagram Figure 6.2.3b: Rear-Wheel Odometer
Figure 6.3a: Actuaon Control Diagram Figure 6.3b: Photo of the UVW Switch
Figure 6. 3.1: Steering-Module prototype (le) and Cross Secon Diagram (right) Figure 6. 3.2: Mid-Drive Motor
Figure 6. 3.3: Brake Servo
Figure 6.4: Human-Machine-Interface System Diagram Figure 6. 4.1.1a: Mechanical-Eye (Cooper Hewi) Figure 6. 4.1.1b: New Mechanical-Eye
Figure 6. 4.1.1c: Mechanical-Eye, Side View Figure 6.4.1.1d: Mechanical-Eye on PEV
Figure 6.4.2a: DSM module and Dashboard Display Figure 6.4.2b: Electrical System Architecture Figure 6.4.3a: HVAC-F
Figure 6.4.3b: Air-Nozzle Figure 6.4.3c: Thermal-Seat
Figure 6.4.4a: Arduino Power Module
Figure 6.4.4b: LED Shield with Arduino Controller Figure 6.4.4c: Voltage Step Down Module
Figure 6.4.4d: Arduino Camp
Figure 7: PEV Road Test, Cambridge, MA (2018)
Figure 7.2a: Human-Machine-Interacon Feedback Loop
Figure 7.2.1a: Thermal Seat Concept Rendering (DIAM Creav e Design, 2019) Figure 7.2.1b: Air-Curtain Concept Rendering (DIAM Creav e Design, 2019) Figure 7.2.2a: Eye Contact
Figure 7.2.2b: eDonkey Mode
Figure 7.2.3a: Photo of eDonkey ModePhoto of PEV 2019, Side View Figure 7.2.3a: Completed New PEV, Side View, 2019
Figure 7.2.3b: Completed New PEV, Front View, 2019 Figure 7.2.3.3a: Animated Turn Signal (Audi)
Figure 7.2.3.3b: PEV Animated Signals Concept Rendering (DIAM Creav e Design, 2019) Figure 7.2.3b: Completed New PEV, Front View, 2019
Figure 7.2.3.3a: Audi’s Animated Turn Signal
Figure 7.2.3.3b: PEV Animated Signals Concept Rendering Figure 7.2.3.3c: PEV Animated Signals (PEV 1.2)
Figure 7.2.3.3d: Magic Circle (PEV 1.2) Figure 7.2.3.3e: Gamificaon
Figure 7.2.4.2: PEV Mechanical-Eyes and the Illuminated Light-Ribbons Figure 7.2.5a: Cyclist’s Hand Signs ( Lauzé , 2020)
Figure 7.2.5b: LED Response Diagram
Figure 7.2.5c: PEV Mechanical-Eye Imitates Rider’s Gaze
Figure 7.2.6a: Rider’s Status Monitoring System (DIAM Creav e Design, 2019) Figure 7.2.6b: DSM Module Core Funcon
Figure 7.3a: PEV HMI Matrix
Figure 7.3b: Idea Board, Mobility Wellbeing Workshop New Taipei City, 2019 Figure 7.3c: Four-Stage Development Cycle
Figure 8.1a: Human-Mode Tests Figure 8.1b: Remote Control Tests
Figure 8.1c: Autonomous Navigaon Tests Figure 8.1d: PEV App
Figure 8.1e: Mechanical-Eye Figure 8.1.1a: Ergonomics Review Figure 8.1.1b: Test Ride
Figure 8.1.1c: Mid-Drive Motor and Steering Mechanism Figure 8.1.1d: Front Wheel and Brakes
Figure 8.1.2.1a: Photo of the completed PEV
Figure 8.1.2.1b: Indoor Review (le), Exterior Surface Finishing Detail (right) Figure 8.1.2.2: Rider’s Cabin Review
Figure 8.1.2.3a: Tesng Air-Nozzle Figure 8.1.2.3b: Thermal-Seat Figure 8.1.2.3c: Thermal Storage
Figure 8.1.2.4a: New PEV Mechanical-Eyes Figure 8.1.2.4b: Eye Mirroring
Figure 8.1.2.4c: Eye-Contact and Posture Detecon
Figure 8.1.2.4d: New PEV, Front View (le) and Side View (right) Figure 8.2: Kaiya City, Aichi Prefecture, Japan
Figure 8.2.1a: Scenario 1 Demo Sequence Figure 8.2.1b: Scenario 2 Demo Sequence Figure 8.2.1c: Scenario 3 Demo Sequence Figure 8.2.2a: Outdoor Demo
Figure 8.2.2b: Indoor Review Figure 8.2.3a: On-Site Survey
Figure 8.2.3b: On-Site Survey Result
Figure 8.3.1a: Photo of MIT Principal Research Sciens t, Kent Larson, and DENSO Execuv e Director Hirotsugu Takeuchi
Figure 8.3.1b: Photo of Deputy Mayor of Taipei, Charles Lin test ride PEV Figure 8.3.1c: Nagoya University Demo
Figure 8.3.1d: PEV 2019 Team Photo Figure 8.3.1e: Core77 Design Award Figure 8.3.2e: $1000 PEV
Table 1.4.1: Challenges and Soluon
Table 2.2.2: Vehicle Geometry Comparison Table 2.2.3: Chassis Type Comparison
Table 3: Convenonal Autonomy VS Lite-Autonomy Table 4.3.1: Milestone Demos
Table 4.5.3: Evaluaon Checklist
Table 5.2.3.1: Riding Ergonomics Comparison
Table 7.1: Pedestrian Eque e Rules for Sidewalk and PEV Guidelines Table 7.2b: PEV HMI Matrix
Introduc on
1 (UN, 2014) 2 (Guerrini, 2014)
Current projecons indicate that by the year 2030, 60 percent of the world’s populaon will be living in cies [ 1 ]. The number of megacies will connue to increase, especially in
emerging economies like China, Brazil, and India. As a direct consequence, automobile sales are expected to increase from 76 million to double that by 2030. Future projecons aside, the current transportaon infrastructure is already stressed, with vehicles causing major traffic congeson. Taking into account the loss of me, energy, and other indirect losses, traffic congeson cost Americans $124 billion in 2013 and is expected to increase to $186 billion by 2030 [ 2 ]. In order to address the adverse effects of these impacts, leaders across different
industries, sciens ts from different disciplines, and policymakers for both private and public sectors are working together to change how people commute, offering new and innovav e transportaon systems and services.
Most city-wide trips involve carrying single users over short distances at low speed, in tradional four-wheeled automobiles. Addionally , most vehicles on the road are
compartmentalized for either personal mobility or transportaon of goods. Both systems are causal factors for increased carbon emissions and environmental hazards in cies. Recent advances in technology and public mindset have enabled rapid producon and user adopon of new mobility soluons, for example:
● Ride-sharing programs such as Uber and Ly;
● Bike-sharing programs such as Bluebikes and Jump; and
● Autonomous vehicles and shules such as Waymo and Navya.
While these choices are, in principle, more sustainable mobility opons, each has challenges. For example, Uber services have not alleviated traffic congeson; rebalancing Bluebikes fleet is costly; dockless bike-sharing systems such as mobike and Ofo generate bike-polluon problems due to large numbers of abandoned bikes ending up in landfills; and the
development of autonomous vehicle technology is not yet ready to operate in all weather and road condions, and the cost of these systems is high. In essence, despite being direconally sustainable in their respecv e verc als, these services are currently insufficient to solve the fundamental problems associated with mobility.
Therefore, the goal of this dissertaon is to design a low-cost and sustainable mobility system by adopng the posiv e features present in the aforemenoned triad of mobility soluons.
The proposed mobility framework will, therefore, incorporate electrificaon, cycling, and a shared-use model, while simultaneously combining novel features of vehicle autonomy. A future is slowly emerging where car ownership is replaced by more environmentally friendly and sustainable mobility-sharing systems that can be used throughout the world. Discourse and acon to create such future mobility schema inherently require an interdisciplinary approach. Knowledge about mobility systems is beyond the scope of a single discipline or area of research pracce, and thus must be acquired from varied yet interconnected fields such as engineering, architecture, urban design, social science, psychology, and economics. Recent developments in smartphones, wireless connecvity , geo-locaon tracking, and e-hailing apps have led to the wide adopon of ride-sharing services, creang a paradigm shi from vehicle-as-product to vehicle-as-service. This shi is re-shaping the urban mobility landscape and how we travel in cies. Proposing a mobility soluon requires innovators to coalesce urban design, new technologies, and policy inia v es: for example, a well-designed bike-lane network will increase not only the efficiency of bike-sharing systems, but also the safety of cyclists and pedestrians. Therefore, introducing new technologies for tracking, sensing, monitoring, and embedding intelligent systems into the urban infrastructure will allow vehicles on roadways to be smart and responsive to the acvies happening around them.
This dissertaon will go beyond tradional design, engineering, and fabricaon approaches, and dive into the following four areas in accordance with the MIT Media Lab mo o of “Deploy or Die.” The key goals are as follows:
1. Designing and prototyping a new, hyper-efficient and convenient urban mobility device and system that combines the flexibility of staonless shared bikes and the convenience of an autonomous vehicle.
2. Moving beyond sow are simulaons and conceptual demonstraons to deploy full-scale working prototypes for technical assessment in a real-world environment. 3. Generang a muldisciplinar y cooperaon scheme between academic instuons,
industries, and cies that converges design, technology, and policy to propose novel and sustainable soluons for the increasing challenges facing urban mobility.
1: Background
1.1. Mobility Services
3 (WHO, 2014) 4 (TIMES, 2011) 1.1.1 Ride-Sharing
Many experts suggest that the booming demand for urban transportaon will lead to a dramac rise in traffic congeson [ 3 ]. In 2011, TIME magazine nominated the concept of a
Sharing Economy as one of the “10 ideas that would change the world.” [ 4 ] On-demand
mobility services are one of the most representav e sectors of the sharing economy, and are considered to be a powerful strategy to combat traffic congeson.
On-demand mobility services such as Uber, Ly, and Didi recruit drivers with privately owned vehicles and pair potenal passengers with available drivers nearby. These services reduce the cost of travel for passengers by externalizing previously fixed costs (vehicle ownership, maintenance, insurance, parking, and energy); they are also alternav es to tradional taxi cabs. These services uliz e dynamic pricing strategies to balance the supply of vehicles with the travel demands of passengers. The price goes up as the demand increases, and the price surge incenviz es more drivers to the road to sas fy the demand. When the demand is low, the services offer discounted fares to ar act more users. Because these systems require parcipa on in a rang system for both the drivers and the riders, they are in general able to provide be er service compared to taxi cabs. Ride-hailing and payment are all handled through a smartphone app (Figure 1.1a). The app also tracks the real-me locaon of the vehicle, enabling accurate esma on of arrival me, which makes it easier for the user to prepare ahead. Family and friends can see the current locaon of the traveler, providing peace of mind. Ride-sharing services also allowed people to enjoy the benefit of having a car without worry about driving experse, license or owning a car.
5 (Clewlow & Mishra, 2017) 6 (Shaheen & Cohen, 2012)
Drawback #1 On-demand mobility services create extra Personal Mileage Travelled (PMT) miles and reduce public transit usage
In 2016, ridership of such transport systems increased by 150% in the US. Ride-sharing made urban mobility more convenient, and is available almost whenever or wherever needed, providing door-to-door services. This convenience led to wide adopon of the programs, but heavy usage of ride-sharing programs also decreased public transit usage by 6% [ 5 ]. The study
also found that nearly half of the ride-sharing trips could have been made by public transit, biking, and walking–or not have been made at all.
Drawback #2 (Cars are bad)
Automobiles have provided an unprecedented level of mobility for the global populaon, greatly enhancing convenience, speed, freedom, and comfort. However, the expansion of car-based transport has given rise to a plethora of social issues such as congeson, accidents, climate change, air polluon, oil dependence, and energy insecurity [ 6 ]. Environmentally
conscious versions of cars such as electric vehicles are increasing in popularity, but the economic and environmental burden levied by them is sll high. Data show that most the
urban trips are short distances
A road-use stas c al report released by Great Britain’s Department for Transport (Figure 1.1b) suggested that most trips made are short. When considering all of the personal trips in 2014, 19% were less than one mile, 66% were less than five miles, and 95% were less than 25 miles. The report further revealed the average proporon of trips made only by cars: in 2014, 56% percent of all car trips were less than five miles, while 6% of car trips covered less than a mile.
Modern automobiles are equipped with emission systems that capture some of the hazardous pollutants from the exhaust. However, it takes five minutes for the
Figure 1.1b: Mode share: average proporon of trips by mode and length. England, 2014
7 (Cambridge Bicycle Plan 2020)
system to reach a sufficient operang temperature before it acv ates. Based on earlier stas cs, the short urban journeys made by cars exposed drivers to high polluon levels in the first half of the trip.
1.1.2 Bike Sharing
Most ride-sharing services are marketed towards metropolitan areas, with current models specifically focused on providing services to solitary adult travelers or small groups. Many cies have adopted public bike-sharing programs as a first and last-mile soluon. The goal is to mig ate traffic-related problems including polluon, accidents and deaths, costly road infrastructure, and congeson. Cambridge, MA passed a new ordinance in October 2020 [ 7 ]
with an ambious goal to complete a city-wide protected bike lane network within six years (2026). The goal is to increase the safety of cyclists of all ages and abilies as they travel around the city.
Figure 1.1.2a: Jump eBike Staon, Los Altos, CA (Jump, 2020)
Figure 1.1.2b: Jump Dockless eBike, Los Altos, CA (Herger, 2017)
When compared to convenonal cars, bicycles are considered to be a quiet, healthy, emissions-free, and space-efficient means of transportaon. Cyclists usually reach desired desna ons faster when traveling short distances or under congested traffic condions. In Boston, MA, for example, a journey from the Old State House to the Trinity Church would take 11 minutes by bicycle, nine minutes by car, and 14 minutes using mass transit. Although the car is the fastest opon for this example journey under normal traffic condions, when
considering the me spent in finding a parking space or waing for an Uber, the true total trip me by vehicle might even be longer than the mass-transit opon.
Cies such as Boston offer open source taxi data, including vehicle idenfic aons, mes tamps of journeys, and GPS coordinates of pickup and dropoff locaons, also known as
8 (Graehler, Mucci & Gregory 2019) 9 (Washington Post, 2019)
10 (U.S.Department of Transporta on, 2016)
Origin-Desna on (O-D) pairs. Google Maps API has been used to calculate trip duraons for these taxi O-D pairs and compare the trip me based on the modes of transportaon: driving, transit, walking, and cycling. The results give a comprehensive comparison between travel me, energy consumpon, and related costs for each form of transportaon. Of parcular importance is the finding that bike lanes serve as faster means of travel than taxi rides for urban journeys shorter than 3.5 miles. Bike-sharing systems also had a posiv e effect on subway ridership. According to a study from researchers at the University of Kentucky, bike-sharing systems increased subway ridership by 6.9% and light rail ridership by 4.2% [ 8 ].
Currently there are two major categories of public bike-sharing systems:
1. Staoned bike-sharing systems (Figure 1.1.2a) comprise a network of docking staons located near major transportaon hubs or end users. To reduce the asset cost, fleet operators a empt to opmiz e the number of vehicles at each staon, keeping the number low while sll meeng the mobility demands of users.
2. Dockless bike-sharing systems (Figure 1.1.2b) remove stac docking staons from the equaon, leaving the bikes to float freely across different parts of the city.
Free-floang systems have more flexibility, as they allow users to drop off bikes anywhere when they are done. This flexibility, however, raises serious the and vandalism challenges for the fleet operator. In July 2018, up to 50 percent of the bikes were lost in less than a year a er the dockless bike-sharing system arrived in
Washington, DC [ 9 ].
Modern bicycle-sharing schemes are designed to overcome the “last mile” problem of urban transportaon. Most commonly, bicycles are checked out and returned to staons placed throughout the city. On average, 86.3% of bike staons are located within one block of a public transit node [ 10 ]. Staons are therefore easily accessible to potenal users and are ideal
for short-distance urban journeys. Making bike-sharing services available in cies can also encourage users to shi from driving to other alternav e travel models such as trains,
subways, buses, and ride-sharing services. These systems enable city-dwellers to use bicycles on a flexible, “on-demand” basis. Various types of bike-sharing programs are being widely adopted worldwide, making them one of the most affordable and efficient means of urban commung. Bike-sharing programs also funcon as an instrument for social change, as they can easily be expanded to impoverished neighborhoods with poor public-transport
1.1.3 Micro-Mobility Services
The adopon of smartphones with improved wireless connecvies, along with GPS posioning systems, allows both users and service providers to monitor the status and posion of these shared-use vehicles. Users can now request a ride anyme they want and track the vehicle in real-me as it approaches. Building on top of innovaons in wireless technologies, mobility service providers can now track the posion of their assets and monitor the status of each vehicle/device in real me. As the city connues to expand, mobility services that pair the demand with the supply of mobility devices using smartphone apps may become an affordable soluon for the city. Many companies are now racing into the shared-use on-demand mobility landscape offering different types of vehicle/devices and pricing schemes. These short distance, one-way rental programs using light-weight vehicles are classified as micro-mobility services.
The devices used in the micro-mobility services such as scooter and bicycles have existed for many years. Many of these vehicles/devices are used for recreaon and users have
historically purchased the devices for private use. Today, users can rent these vehicles and pay per use at an affordable price. Micro-mobility company Brid, for example, provides e-scooters which users pay $1 to unlock plus 15 cents per minute of riding. Micro-mobility systems are o en designed in conjuncon with major transit hubs and are primarily used for
short-distance urban journeys.
People now have the opon of using various forms of mobility devices and of choosing a vehicle that best fits the purpose of the journey. One could ride a shared-used bicycle to a local supermarket and return with a full load of groceries in the trunk of an Uber. Biking to the supermarket is an eco-friendly transportaon mode which not only reduces the carbon emissions but also provides health benefits. When the shopping is complete, hailing an Uber saves the me and energy of finding a parking space. These services provide convenient, specific, and affordable mobility opons.
Micro-Mobility
1.2 Challenges and Current Solu ons
11 (Styslinger, 2017) 1.2.1 Challenges:
Despite the convenience and flexibility that micro-mobility systems bring to cies, they are also the leading cause of some urban problems. Most micro-mobility systems face the following three challenges:
1. Fleet Rebalancing
Because bike-sharing programs are typically used to make short, one-way journeys, it is difficult to make advance esma tes regarding which staons will reach maximum capacity, and when. Geological topography is also a challenging factor for fleet operators. A key
example is the bike-friendly city of Barcelona. Despite having the required lane infrastructure and numerous bike staons across the city, riders usually only uliz e the shared bike services when making downhill journeys. Therefore, a vast number of bicycles o en accrue at staons placed at the foothills of the city, resulng in an “unbalanced” state of on-demand fleet vehicles. This is called the fleet rebalancing problem. The core queson here is how to effecv ely relocate devices from overcrowded staons or areas to those with a shortage.
2. Vehicle Polluon
The simple combinaon of GPS modules and smart locks employed in the dockless
bike-sharing programs provides riders with the freedom of dropping off bikes at any locaon. However, this advantage has also led to regulatory issues due to users illegally parking
bicycles. There is also strong push back from city officials in various metropolitan areas, cing “bike polluon” as a likely consequence of staonless services [ 11 ]. A similar issue also
happened with E-scooters. Although these scooters are small in footprint, we o en see these scooters and bikes piled up on the sidewalks, resulng in vehicle polluon and creang an unsafe environment for pedestrians.
3. The and Vandalism
The last challenge for micro-mobility services is accounng for human behavior. The and vandalism are common issues facing these programs. The popular Paris bike system, Vélib’, was launched in July 2007 with a fleet of 14,500 bicycles and 1,230 staons located across Paris and surrounding municipalies. Two years later, in 2009, the fleet was expanded to approximately 20,600 bicycles; almost 16,000 (80%) of these bikes had to be replaced due to
12 (Beardsley, 2009)
damage or the. Many of the bikes have ended up in Bucharest and North Africa, with many appropriated and repainted. [ 12 ]
E-scooters are equipped with wireless beacons that allow the fleet operator to track their locaon. However, due to their light weight and limited ba ery life, and the unstable wireless connecvity in some urban areas, it can be difficult to track them. E-scooter abuse is another challenge since the service hit the street in late 2017. E-scooter company Scoot reported that 200 of their new e-scooters were damaged or stolen within the first two weeks of the launch of the e-scooter .
1.2.2 Current Soluons
Micro-mobility service providers are exploring different strategies to face these challenges. The dockless bicycle system allows users to leave the bikes at their final desna on. The system uses a combinaon of QR codes, Bluetooth, and smart locks to secure these bikes. Users can unlock the bike by scanning the QR code with the
smartphone app. The app sends the locaon data to the server where the fleet operator can track down the bike's locaon. To balance these free-floang bicycles, fleet operators offer rewards and incenv es for users who help to move the bikes—called “bonus bikes”—from low- to high-demand areas.
Figure 1.2.2a Screenshot of Mobike Incenv e Program
This strategy is a form of crowdsourcing that recruits the system’s users for fleet rebalancing. Figure 1.2.2a shows a the screen capture of the Mobike “bonus bike” app interface. The dot in the middle is the current posion of the rider, with available bikes shown nearby. The ones with red infill color are the bonus bikes.
Bird, an e-scooter sharing system, uses a similar incenv e mechanism for both fleet balancing and ba ery charging. The company launched the Bird Flyer program, which pays users to relocate scooters or bring them home to charge overnight. Users locate scooters with depleted ba eries through the app, retrieve them for charging using a car or truck, and set
1.3. Autonomous Vehicles
13 (US DOT, 2015)
them to charge overnight. A er reposioning the recharged scooter to a designated locaon the next day, the user receives a reward.
Figure 1.2.2b: Adversemen t for the Bird Flyer Program from the website
Mobike crowdsources the relocaon of surplus bikes and Bird Flyer (Figure 1.2.2b)
crowdsources ba ery charging. Both programs require users to locate the device and move it to a different locaon based on instrucons provided by the fleet operators. Both soluons offer a manual fleet rebalancing soluon; however, there are four main drawbacks:
1. Required infrastructure support: Pinning down the locaon of these devices requires not only robust wireless connecvity but also reliable GPS signals.
2. Sensor errors: Current consumer GPS units tend to dri when the signal is blocked by buildings, tunnels, bridges, and other manmade structures.
3. Expensive human labor: Both soluons involve manual reposioning , and charging the device may be expensive.
4. The: Due to the size and the weight of these vehicles, neither of the soluons effecv ely stop the.
Autonomous vehicles, also known as driverless or self-driving cars, are vehicles capable of sensing the environment and navigang without human input. The technology presents an excellent opportunity to enable new urban mobility innovaons such as robo taxi service (Waymo), autonomous package delivery (Nuro), and autonomous community shules
(Navya). These innovaons aim to fight long-lasng , last-mile urban mobility problems, traffic congeson, and traffic accidents. For example, the leading cause of all traffic accidents is human error, which causes 94% of car accidents [ 13 ]. Mistakes made by drivers lead directly to
Figure 1.3.1a: Uber TAG Self-Driving Car (Uber ATC, 2018)
accidents. Computer drivers do not get distracted; they stay focused and obey traffic rules at all mes. Replacing human drivers with computer drivers can eliminate human errors, leading to safer streets and minimizing car accidents.
1.3.1 Technology Development
The recent development of self-driving cars has demonstrated the ability of these vehicles to navigate safely in different types of road environments. High-precision sensors such as 3D LiDARs and cameras capture the surrendering environment. With the support of
high-resoluon digital maps that contain informaon regarding speed limits, traffic direcon, and road network informaon, it is possible for vehicles to navigate autonomously. High speed, low-latency data communicaon infrastructure such as 5G networks enable communicaon with remote fleet operators in real me. This technology allows fleet operators to track, monitor, and assign tasks remotely, and the vehicle can reposion itself autonomously. Moving idle vehicles towards high-demand areas will shorten the waing me while increasing operaonal efficiency and customer sas facon.
Autonomous vehicles provide many benefits such as improved safety, comfort, and efficiency. In the context of autonomous shared-use mobility, the technology provides the benefits of (1) fleet balancing—sending vehicles somewhere else to avoid vehicle polluon and vandalism; and (2) making the system more reliable and less frustrang to people waing for their ride.
State-of-the-art autonomous vehicles use mulple high-resoluon cameras and long-range 3D LiDAR scanners to build maps of the environment, and localize themselves. LiDAR provides
the measurement of the environment in the form of 3D point clouds; in addion to mapping and localizaon, point-cloud datasets can be used for object recognion and tracking using point-cloud segmentaon techniques. Modern autonomous technology also uses a set of camera sensors for object recognion and extracng odometry informaon. As shown in the photo above, Uber’s ATC vehicle uses 7 LiDARs and 20 camera modules and these sensors are arranged to cover the enr e surrounding of the vehicle (Figure 1.3.1a).
While LiDAR sll dominates the self-driving car industry as the main Simultaneous Localizaon and Mapping (SLAM) sensor, other companies such as Tesla have taken on a vision-based SLAM approach using just the cameras. Figure 1.3.1b shows an image captured from Tesla’s demo video. Tesla provides a basic understanding of the environment using cameras. The image on the right shows the results of Tesla’s camera and image recognion system. The video demonstrated the following vision-based autonomous funcons:
● Object Recognion: Tesla’s vision system is capable of understanding a wide range of objects in the road environment. As shown in the Medium-Range vehicle camera, vehicles in the scene, traffic signs, cyclists, pedestrians, and other roadside objects are idenfied and marked with colored “bounding boxes.”
● Lane Detecon: A lane detecon algorithm tracks the boundary of the lane by idenf ying the painted road markings. Idenf ying the lanes and understanding road markings plays a crucial role in navigaon safety. A common applicaon for lane detecon is maintaining the vehicle in the center of the lane.
● Ground Segmentaon: Image segmentaon techniques are used to differena te the ground from other objects. When combined with object recognion and lane
detecon, Tesla’s vision system establishes a drivable area for the vehicle moon planner.
● Visual Odometry: The green dashed lines that appear in all camera views show visual odometry informaon. The system compares the images and translates the
comparison into vectors represenng the changes in speed and acceleraon. Odometry informaon is crucial for esma ng the vehicle moon state. Although there are other ways to retrieve the same informaon, such as using IMU, GPS, opc al flow cameras, and LiDAR, camera-based visual odometry provides robust and accurate odometry esma on compared to other physical or electrical systems.
Figure 1.3.1b: Image Captured from Tesla Demo Video (Tesla, 2019)
Autonomous technology could be an answer to the fleet rebalancing problem. However, the cost is high for a self-driving car capable of understanding the dynamics of the physical environment, navigang safely, and co-exisng with human drivers. Current self-driving cars require mulple high-resoluon 3D LiDARs, SONAR, cameras, IMU, GPS, and
high-performance computaon setups. A LiDAR-based autonomous drive kit alone would cost as much as $300K (USD). The high cost related to this technology raises quesons about affordability. Autonomous vehicles may reduce the number of traffic accidents related to human errors, but despite providing increased safety, the high cost will result in greater socioeconomic inequality on the roads. On the other hand, Tesla is offering a vision-based autopilot feature for the price of $8K. Although the full, self-driving version of Tesla’s autopilot sow are is not yet released, it points to a different technological approach and paves the way for purely vision-based autonomous navigaon strategies.
1.3.2 Impact and Controversy
Autonomous vehicles present promise and opportunies associated with environmental benefits, roadway safety, traffic efficiency, and personal convenience. Sll, there are many quesons and concerns regarding the cost of implementaon, technology readiness when facing bad weather, mobility infrastructure upgrade melines, unexpected behaviors of other human drivers, pedestrians, and social impacts.
Although the technology is sll being developed, evaluated, and tested, the soluons to the problems menoned above might not be ready, and the system is not perfect yet at present.
14 (Talebpour & Mahmassani, 2016)
15 (Alonso-Mora, Samaranayake, Wallar, Frazzoli & Rus, 2017) 16 (Stern & Cui, 2018)
Autonomous vehicles and micro-mobility services are pping the status quo of urban
transportaon. These two urban mobility innovaons are quickly emerging into autonomous robot taxi services. In addion to benefits for safety, cost, and energy efficiency, driverless vehicles also offer an advantage of increased inclusivity, in that the systems can accommodate riders from all age groups and those with restricted mobility.
Autonomous vehicles will impact the way we work and live. It is not just about moving people or goods around the city efficiently and autonomously–it is a chance to reshape our urban infrastructure and transportaon. Autonomous technology also creates an opportunity for policymakers to rethink how to provide an environment that fosters innovaon and a safe and sustainable lifestyle. Furthermore, future transportaon systems should be open, flexible, constantly evolving systems with the ability to learn and improve themselves. Autonomous technology also presents an excing opportunity to rethink vehicle design, operaon models, engineering, user experience, comfort, wellbeing, and Human-Machine Interacon. Other major benefits of the autonomous vehicle include:
● Increased convenience: traveling in an automated vehicle bypasses the burdensome aspects of driving, allowing drivers and passengers to divert a enon to producv e purposes during their commute.
● Increased traffic efficiency: autonomous vehicles can parcipa te in vehicle-to-vehicle communicaon, establishing a channel to exchange traffic data. They can monitor and coordinate moon to maximize traffic throughput. [ 14 ]
● Green technology: autonomous vehicles can operate using electricity to minimize vehicle emissions; addionally , when combined with alternav e energy sources such as human power, the energy performance of the system is further increased. ● Fleet reducon: bridging autonomous technology with ride-sharing services would
enable automac fleet rebalancing, leading to higher vehicle uliz aon and leaner fleet sizes than convenonal, human-driven ride-sharing services. A study done at MIT’s Computer Science and Arficial Intelligence Laboratory (CSAIL) shows that in New York City, a fleet of 3,000 four-passenger ride-sharing vehicles could serve 98 percent of taxi (total: 14,000) demands in a day, with an average wait me of only 2.7 minutes. [ 15 ] Furthermore, vehicles' traffic management and flow can be significantly
1.3.3 Autonomous Micro-Transit
Using autonomous vehicles to provide mobility services seems to be a natural next step;
however, the technology could also result in a negav e impact on the city and our environment. A study analyzed how autonomous technology affects people’s mobility behavior based on driving ar acv eness factors, new behaviors, and new ownership models. The study suggested that due to the benefit and convenience that the technology provides, people’s transportaon behavior will change and the system will sele out at a new equilibrium state with potenally no improvement in congeson, but higher personal Vehicle Mileage Travel (VMT). Even in the Autonomous Shared-Use scenario, the zero occupancy vehicle roaming on the street could be an issue. A er dropping off the passengers at the desna on, autonomous vehicles could circle around the block without passengers, either looking for a parking space or merely waing for the new assignment. Having these zero occupancy vehicles roaming on the street will result in increased traffic congeson, especially in dense urban areas. Other studies also suggest that increased VMT might result in increased sprawl (Fagnant & Kockelman, 2013).
Autonomous Micro-Transit
Safety and Comfort Figure 1.3.3: Autonomous Micro-Transit
Micro-Transit: Vehicle pooling (Figure 1.3.3) is a widely discussed soluon to avoid increasing personal VMT. Pooling decreases personal VMT while providing comfort and safety by using larger vehicles such as shules and minivans to transport mulple passengers at the same me. Pooling services such as MOIA in Hamburg Germany provide fixed routes with fixed schedules, and other services such as Nayvia use autonomous shules to provide flexible routes and on-demand transit services. Although pooling is less convenient and flexible when compared to a private car, pooling could be affordable and reliable. It could be an ideal last-mile mobility soluon when the demand is high. However, using large vehicles results in higher energy consumpon, carbon footprint, and cost, making them less sustainable than