This is an author-deposited version published in:
http://oatao.univ-toulouse.fr/
Eprints ID: 9326
To link to this article: DOI: 10.1007/s11340-013-9731-8
URL:
http://dx.doi.org/10.1007/s11340-013-9731-8
To cite this version: Rouault, Thomas and Bouvet, Christophe and Nègre,
Vincent and Rauch, Patrice Reversible Rail Shear Apparatus Applied to
the Study of Woven Laminate Shear Behavior. (2013) Experimental
Mechanics. ISSN 0014-4851
O
pen
A
rchive
T
oulouse
A
rchive
O
uverte (
OATAO
)
OATAO is an open access repository that collects the work of Toulouse researchers and
makes it freely available over the web where possible.
Any correspondence concerning this service should be sent to the repository
administrator:
[email protected]
Reversible Rail Shear Apparatus Applied to the Study
of Woven Laminate Shear Behavior
T. Rouault&C. Bouvet&V. Nègre&P. Rauch
Abstract The multitude of in-plane shear tests existing in the literature seems to demonstrate the complexity of devel-oping a test adapted to all experimental works. In a general framework of investigation of translaminar cracks in thin laminates, a test able to reproduce a pure in-plane shear loading was required. The laminate studied is notably employed as helicopter blade skin, and cyclic torsion in-duced by aerodynamic load involves cyclic in-plane shear. This particular application established some specifications for the test needed to carry out this study. To comply with them, an original technological solution has been developed from a three-rail shear test apparatus. This paper describes the resulting “reversible rail shear test” solution and its application to the study of in-plane shear behavior of a thin glass-epoxy laminate. The results concern plain and notched coupons under quasi-static loading, and crack growth tests under cyclic loading.
Keywords Three-rail shear test . Woven composite . Notch . Fatigue crack growth
Introduction
The increasing number of applications of composite struc-tures in the aeronautical field makes them susceptible to undergo various and complex load cases. They are expected
to be efficient, durable, and safe. A helicopter blade is an example of a primary structure sustaining cyclic stress, and for which the need for optimization requires adequate knowledge of the material. The typical constitution of a blade is a stiff spar and a foam filling covered by a com-posite skin. This skin is composed of a thin laminate, and undergoes multi-axial cyclic loading of combined tension and shear. In case of foreign object impact or unexpected stress concentration, a through-the-thickness crack, (also called “translaminar crack”) can initiate on the skin. For a failsafe design, the behavior of cracked material and crack growth need to be investigated. In previous works these aspects have been studied experimentally [1,2] and numer-ically [3] under tension-tension cyclic loading. With the aim of completing this study and applying it to multi-axial blade loading, it was found suitable to study the material behavior under a cyclic shear loading that the resultant of aerody-namic forces can generate in producing torsion moment on the blade.
Various in-plane shear tests have been reported in the literature, and constitute the topic of bibliographical reviews [4,5]. Lessard et al. enumerated more than 30 different tests for the study of in-plane shear behavior of composite mate-rials [6]. Among them, some are able to provide only a measure of the stiffness without the strength value of the material (e.g. the Plate Twist Test), others only make it possible to obtain the strength (four-point shear test, double notched shear test). Some require special equipment (torsion tube test) or complex, expensive samples (cross sandwich beam test). The diversity of tests tends to indicate that none of them are universally considered to be applicable to the different in-plane shear studies.
Among the principle tests, the three-rail shear test was chosen for our research. This test does not require too much complex equipment, samples are relatively easy to manu-facture (need to drill holes, but no tab) and produces an area T. Rouault
:
C. Bouvet (*)Université de Toulouse; ISAE, INSA, UPS, EMAC; ICA (Institut Clément Ader); ISAE, 10 av. E. Belin, 31055 Toulouse, France
e-mail: [email protected] T. Rouault
:
V. Nègre:
P. Rauchof pure in-plane shear, wide enough to introduce a notch in the coupon and monitor its growth. This idea appeared in 1984: Lakshminarayana wanted to study through-the-thickness mode II fracture toughness [7]. A numerical study was carried out but was not followed up experimentally to the author’s knowledge. Thereafter, Tan and Kim [8] performed experimental three-rail shear tests on sound and notched cou-pons to take advantage of a large area of pure in-plane shear. For non-notched coupons, we found research from 1912 by Coker, who used a three-rail shear apparatus on glass samples, and made use of the optical properties of this kind of material to describe the stress state [9]. The validity of this test was investigated in 1971 by Whitney et al. for various geometric configurations and laminate stacking se-quences [10], then by other authors (e.g. [11, 12]). Their conclusions show a satisfactory large pure shear area and little free-edge effects for most cases, but for certain param-eters and especially material properties, they recommend a cautious use of the test, since pure shear is not ensured. Concerning applicative use of the three-rail shear test, Yaniv et al. developed a three-rail shear test whose design was adapted to the geometry of composite tension samples in order to characterize damage obtained under tension as shear modulus decrease [13]. Following that, very few stud-ies used this kind of apparatus until Lessard et al., 1995, who realized modifications on sample geometry to mitigate free edge effects [14]. Ng et al. used this test to evaluate mechanical properties of a 5-harness satin weave carbon-epoxy laminate [15]. Finally, this method was recently reintroduced to adapt it to study composite materials under fatigue loading. First, De Baere et al. [16] and then Mohseni Shakib and Li [17] proposed other clamping fixtures in order to impose loading in both directions and then to be able to apply negative load ratios in fatigue sequences. These apparatus are described inModified Apparatussection.
In line with these studies, we developed a third techno-logical solution of rail shear test apparatus enabling us to study in-plane shear crack growth under fatigue cyclic load-ing. To the author’s knowledge, shear fatigue crack growth has never been reported in literature for through-the-thickness cracks. Specific requirements were formulated to carry out this study, and an existing standard rail shear test was modified to fulfill them. An original device for shear strain monitoring was also used. It makes it possible to perform quasi-static and cyclic strain-imposed tests. The apparatus and measurement equipment are presented in section 2. Validation tests were first performed on un-notched coupons, and are described in section 3. They provide the behavior of un-notched laminates under quasi-static shear loading. Finally, crack propagation tests on notched laminates were carried out under quasi-static and cyclic loading. Results are presented inExperimental Tests
on Notched Samplessection.
Apparatus
The three-rail shear test constitutes the subject of the ASTM D4255/D4255M standard (method B) [18]. It consists of a rectangular plane sample clamped to three parallel rails with tightening bolts. Figure1shows the sketch we can find in the ASTM standard. The two external rails constitute a reference frame whereas the central one translates vertically through it, so as to load the sample in in-plane shear. The apparatus is typically mounted on a tension-compression testing machine, equipped with a load cell and the vertical motion of the central rail is generally induced by applying longitudinal compression to it. It is noteworthy that linkage between the central rail and the frame should ideally avoid friction to ensure that the whole load is transmitted into the coupon.
In the scope of a comprehensive study of fatigue crack growth in thin glass/epoxy laminate, we needed an in-plane shear test able to fulfill these requirements:
1) Generate a homogeneous pure shear strain on a com-posite sample.
2) Allow fatigue testing in both loading directions. 3) Obtain a wide enough in-plane shear area to insert and
propagate a through-the-thickness crack.
4) Allow for large strains while avoiding sample buckling, or out-of-plane displacement for un-notched or notched samples.
Fig. 1 Sketch of 3-rail shear test principle as described in ASTM standard [18]
5) Allow for stress and strain monitoring, and moreover a robust enough strain measurement to carry out strain-driven fatigue testing.
Points 1 and 3 are satisfied by the solution of a rail shear test proposed by the ASTM standard. Analytical studies [10] and numerical studies [5,7,16] report a pure shear area on a large extent of the sample. Lakshminarayana identified edge effects of 10 % of width along rails and 10 % of length along free edges. They found tension and compression stresses in the sample axes, close to the edges. More particularly, overstresses are localized in corners of loaded areas so that they may induce premature failures close to fixtures [7].
Preliminary Tests
For the present work we used an 8-harness satin weave glass/epoxy (7781/G913) prepreg fabric. We first carried out preliminary tests on a standard three-rail shear test apparatus similar to the apparatus in Fig.1, which confirmed analytical and numerical results found in the literature. For these tests, [0/90]2laminate plates were manufactured in a
vacuum. Coupons were machined and drilled according to the diagram in Fig.2. The three shaded areas were clamped under three rectangular fixtures tightened by 9 bolts, while two remaining w x L non-shaded rectangles were under shear loading. The 25 mm dashed red line centered in the loaded area represents the pre-crack practiced on some samples. The choice of this geometry is discussed
in Experimental Tests on Notched Samples section.
A monotonic quasi-static loading was applied and the shear measurement was monitored with both strain rosettes and digital image stereo-correlation (3-D DIC). Results
showed buckling modes occurring for small strains, and out-of-plane displacement due to looseness in linkage between the frame and the central rail. A zero displace-ment was observed along the frame fixtures meaning that no slipping occurs between the sample and the fixtures.
These buckling modes are revealed in the numerical study of Mohseni Shakib and Li [17]. These authors spec-ified that buckling modes and critical stress values are strongly dependent on boundary conditions numerically imposed on the central rail. If out-of-plane degrees of freedom are free, the critical load is divided by 10. Conse-quently it seems suitable to satisfy requirement 4, in order to accurately guide the central rail. To overcome unavoidable looseness in the linkage, an additional guide at the bottom of the central rail was added. Moreover, the number of plies was doubled to delay the buckling. The results presented thereafter exclusively concern [0/90]4or [0/90,±45]s
stack-ing sequence samples, with 4 plies, and consequently nom-inal thickness t=1.24 mm. Even though the ASTM standard recommends the use of a sample thickness between 1.3 and 3.2 mm, the specific application of the present study im-poses the use of a sufficiently thin laminate to be represen-tative of a blade skin.
Another shortcoming of this first apparatus concerns the technological impossibility of applying a reverse loading, a loading in the opposite direction. As explained in [2], the application of these tests to the representation of a rotor-blade skin or more generally an aeronautical structure com-prising a stiff spar, implies a strain imposed control of tests. Moreover, to approximate in-flight loading while applying simple signal, the strain imposed signal has been cho-sen with constant amplitude εmax, and a loading ratio of
R = εmin/εmax= 1/3 for fatigue tests on un-notched and
notched coupons. Preliminary fatigue tests with loading ratio R=1/3 were carried out. They exhibit permanent strain increasing with the number of cycles until it achieved the strain εmin. As tests are strain-imposed, the stress–strain
curve goes down with the number of cycles as shown in Fig.3(a). The permanent strain remains εminsince negative
load cannot be applied. From that point forward, clipping of load and strain signal were observed (see Fig. 3(b)). This clipping phenomenon could reach more than 30 % of the total signal amplitude. Requirement 2 was formulated to overcome this drawback. This critical point called for the main modifications of the apparatus which are detailed in the next subsection.
Modified Apparatus
Requirement 2 has been treated by De Baere et al. in order to develop a shear fatigue test on 5-harness carbon/PPS laminate [16]. Its apparatus does not include any linkage, Fig. 2 Geometry of samples used in this study. Red dashed line
thus avoiding any linkage dissipative load (see Fig.4(a)). The three fixtures are independent. The external ones are mounted at the upper part of the testing machine and the central grip is attached to a plate mounted at the bottom. This apparatus can be operated in both directions of the testing machine.
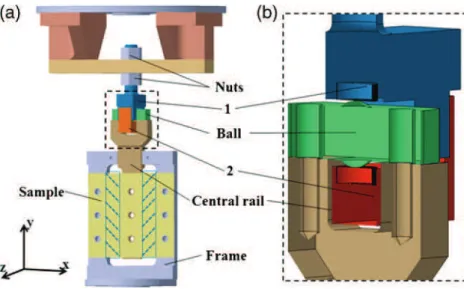
In Mohseni Shakib and Li’s apparatus, the central rail slides in a frame through a double cylindrical linkage (Fig. 4(b)). This solution presents the advantage of being easily mountable on a tension-compression testing machine. To take advantage of an existing apparatus, the solution we chose is rather different. It uses a linkage which allows for the three rotational degrees of freedom, the two transla-tional degrees of freedom in the xz-plane (see Fig.5) and transmits loads in both directions of the y axis. The CAD diagram of the whole apparatus and a section view of this specific linkage are shown in Fig. 5. This linkage can be called a “bilateral sphere-plan linkage” consisting of a ball held between two parallel planes. The two planes are rigidly linked together by tightening part 2 on part 1 with two fastening screws not shown in the diagram. A view of this linkage with tightening bolts is shown in Fig.6(b). The ball part is machined from the bulk as two spherical parts on a
parallelepiped drilled with two holes. The holes are oblong, which allows for the adjustment of the ball summit precisely above the mid-plane of the coupon, whose position depends on its thickness. The coupon is clamped on the frame with 9 tightening bolts we can see on Fig.6(e). The sample frame is fastened to a hydraulic actuator by two bridles, and the upper part of the double sphere-plan linkage is fastened onto the upper plate of the testing machine. Figure6 shows five views of the apparatus during a test. The geometry of the samples is imposed by apparatus dimensions. They are 125×140 mm2rectangular samples and working areas are two 125×25 mm2rectangles as reported in Fig.2.
Instrumentation
To ensure requirement 5, guiding areas are covered with a thin anti-adhesive coating to prevent the linkage from bear-ing the axial load, and so that the load cell measures the load which really transits into the sample. The shear stress τ can be derived from the load F:
t¼ F 2 L t Fig. 3 Typical signals obtained
for a preliminary test with non-modified apparatus: (a) load vs. strain for the first and the last cycles, (b) first cycles and clipped fatigue signal of strain and load at the end of the test
Fig. 4 Technological solution proposed by De Baere et al. (a) [16] and Mohseni Shakib and Li (b) [17] of 3-rail shear apparatus for fatigue experiments with negative load ratio
In notched samples the effective stress can be express as:
t¼ F 2 L" a ð Þt
Where L is the sample length (Fig.2), t its thickness, and a thetotal crack length.
To measure strain, the ASTM standard recommends the use of strain gauges glued to the sample, but they are not suitable for fatigue loading, since they tend to de-bond after
a few cycles. Furthermore, requirement 5 demands not only a confident measure of strain but requires it to be robust enough so that the testing machine can be driven by this monitored data.
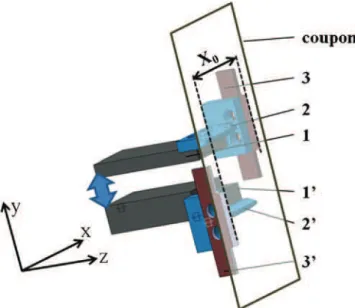
The solution adopted uses a modified extensometer adapted to shear strain measurement by adding two T-brackets designed in the laboratory (Fig.7).
Displacement measured by the extensometer is the rela-tive motion Δy along the y axis of its two arms 1 and 1′. Fig. 5 CAD design of the
mod-ified three-rail shear apparatus developed in this study (a): complete apparatus, (b) section view of the upper linkage
Fig. 6 Photograph of the apparatus mounted on tension-compression machine: (a) overall view of the whole apparatus, (b) detail of the upper linkage, (c) back view showing one bridle and the extensometer, (d) detail of the modified extensometer with T-brackets, (e) front view showing the 9 tightening bolts used to clamp the specimen on the frame
Edges of knifes 3 and 3′ are bonded on the coupon and clamped on T-brackets 2 and 2′. The extensometer is bonded on the sample, with the knives axis along the y axis. Under pure shear strain induced by the apparatus, each y axis oriented line on the sample moves along a rigid motion, so that contact area between knives and sample are not loaded, and stay bonded. The distance along the x axis between the two knives is X0=14 mm. The shear strain can thus be
expressed as:
gxy¼Δy X0
A photograph of this device bonded on a sample is shown in Fig.6(c)and a close-up of the T-bracket Fig6(d).
Experiments on Un-Notched Samples
The apparatus was mounted on a Schenck tension/compression hydraulic testing machine, equipped with a 450kN load cell. It can be driven on one of the three following channels: load, displacement or strain. Coupons were machined from prepreg glass/epoxy woven laminate with [0/90]4 stacking sequence as explained previously. The
first tests were performed on un-notched samples to val-idate the test and provide data on the behavior of the material subjected to shear.
Validation Tests
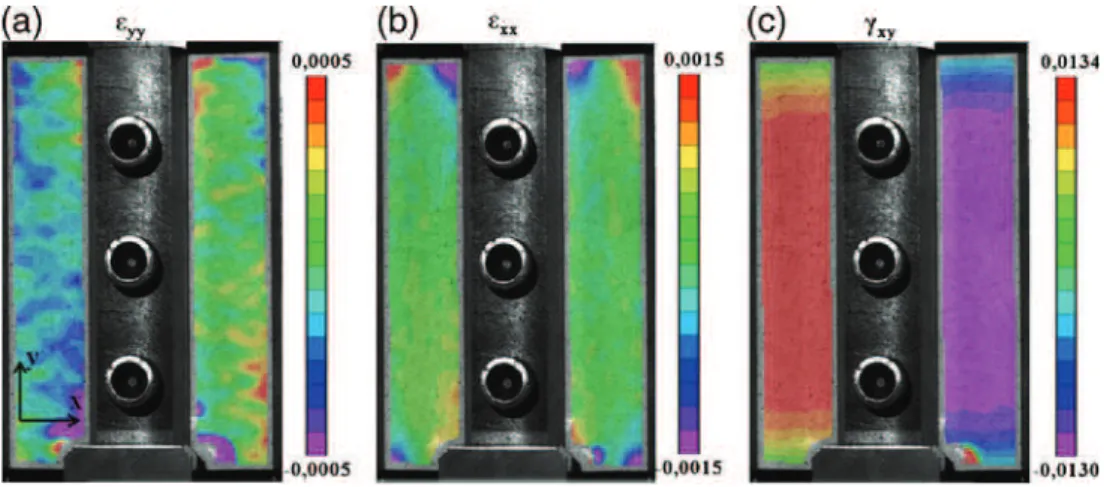
A quasi-static load was applied on a sample with constant crosshead speed of 0.02 mm/s. 3D DIC was used to control out of plane displacement or buckling of the coupon. Buckling did not occur, even for relatively high strain,
and out-of-plane displacement was constrained to less than 0.1 mm (see Fig. 8). A commercial software application computed components of the planar strain tensor field. Lon-gitudinal, transverse, and in-plane shear strain fields are reported in Fig.9(a), (b), and (c), respectively for a homo-geneous strain of g =0.0125. They show that edge effects consist of both a decrease of in-plane shear close to free edges, and tension/compression stresses at the corners of loaded areas (Fig. 9(b)). The decrease of in-plane shear affects a distance of nearly 20 % of the total length from the free edges. This length can rather be estimated by plotting strain values along 2 longitudinal center lines on samples as reported in Fig.10. These results highlight the importance of a strain measurement in the center area of the sample.
The second free edge effect, overstresses at the corners of loaded areas, involves premature failure of the sample along the fixtures as already reported in the literature [14]. Con-sequently, as the failure is located along grips and for tension/compression stresses, this test does not provide any material strength value for in-plane shear.
Pseudo-Hardening Characterization Tests
Monotonic tests under quasi-static loading used for valida-tion were also exploited for material characterizavalida-tion. They showed behavior proper to an epoxy based composite under shear, determined by the behavior of the polymer. Phenom-ena usually observed for this kind of material include non-linear elasticity, pseudo-hardening, viscosity, permanent strain, recovery at zero stress, and hysteresis [19].
Further tests were carried out to characterize the behav-ior, and to evaluate damage after shear loading: a coupon was successively loaded up to a shear strain gi with a
crosshead speed of 0.02 mm/s, then unloaded down to zero Fig. 7 CAD view of the extensometer adapted to measure shear strain
Fig. 8 Out-of-plane displacement of a shear sample under quasi-static loading
stress, a relaxation time of 60s was then applied, and after-ward it was reloaded up to the following maximum strain gi+1, etc. The list of gi values was (3.10−3, 6.10−3, 9.10−3,
12.10−3, 15.10−3, 20.10−3, 25.10−3, 30.10−3, 40.10−3,
50.10−3, 60.10−3, 70.10−3). Stress–strain response is
illus-trated in Fig.11(a). The laminate behavior dominated by the matrix is highly non-linear. This non-linearity and perma-nent strains appeared at the third loading, for gi=9.10−3. We
also observed recovery at zero stress. The reloading curves exhibited significant hysteresis, attributed to friction be-tween macro-molecules of the polymer. This behavior has already been observed on polymers under shear [19] [20].
In addition, the following sequence, loaded up to gistrain
followed by unloading and then reversal loading up to -gi
was applied on a sample (Fig.11(b)). These results guided the shear behavior modeling of the woven ply by a kine-matic pseudo-hardening law and enabled us to identify its parameters [21].
Experimental Tests on Notched Samples
This work focused on crack growth study and the apparatus was developed for this purpose. This involved the
introduction of one or several pre-cracks in specimens and different options were possible. Lakshminarayana [7], and Tan and Kim [8], introduced a center crack (with two tips) in the two shear areas of the sample so they were located in homogeneous shear areas. Their tests consist of the propa-gation under quasi-static loading of 4 cracks. Tan and Kim observed the growth of the 4 cracks but because of classical scatter in the failure stress level, the initiation did not occur simultaneously. The present study concerns crack growth under cyclic loading. It is well known that results are subjected to significant scatter, particularly because of the initiation time which can vary by one order of magnitude [1]. The study focused more particularly on the propagation stage of the crack growth, which follows the initiation phase. In a solution with multiple crack tips, the initiation of one of the cracks can interfere with initiation and prop-agation at another crack tip, which makes the comparison between results for two different samples awkward. It then appeared suitable to use a sufficiently long, single edge crack, to avoid free edge effects. The solution adopted consists of a 25 mm single edge crack practiced only on one side of the specimen (red dashed line on Fig.2). Pre-cracks were machined with a small circular saw, and with a 0.17 mm thick diamond thread saw for the last millimeters. Fig. 9 Longitudinal (a),
transversal (b), and shear (c) strain field of an un-notched sample under quasi-static loading for a homogeneous in-plane shear of g =0.0125
Fig. 10 Strain along left and right lines for an in-plane shear strain g =0.0125
Quasi-Static Toughness
Even though we focused our attention on crack growth under fatigue loading, we first carried out crack growth tests under quasi-static loading.
The stacking sequences used were [0/90]4and [0/90; ±45]s.
Three different samples of each stacking sequence were cut out according to the geometry specified earlier. Tests proceeded with a central rail motion imposed at speeds com-prised between 0.005 and 0.03 mm/s. An extensometer was bonded to the un-notched part of the sample to measure homogeneous shear strain. 3-D DIC was used on one test to check potential out-of-plane displacement or buckling.
In Fig.12a [0/90]4sample is shown at different states of
the test. The same scenario occurred for the 3 specimens. Tests were performed without buckling, and propagation occurred with stable crack growth. It propagated at 45° to
the initial pre-crack direction, orthogonally to the direction of maximum tension.
To predict crack extension direction in anisotropic mate-rials Buczek and Herakovich [22] proposed a criterion based on the ratio between normal stress σθin a given direction θ
and corresponding tensile strength Tθ:
R θð Þ ¼σθ Tθ
The criterion postulates that the crack will propagate in the direction orthogonal to θcwhere R(θc) is maximum. This
criterion requires the knowledge of stress field in the spec-imen and the strength of the ply in each direction. Numerical works could be carried out to compute stress field in the specimen in taking into account non-linearity of this mate-rial’s behavior. We can nevertheless point out that as for [0/90] cross-ply laminates, strength of a woven ply is Fig. 11 Stress–strain response
of [0/90]4under shear loading
for two different loading sequences
Fig. 12 Progressive failure of a notched [0/90]4laminate under
quasi-static loading. Different states are shown for different strain levels reported on the stress–strain curve. Strain field in ±45 frame, obtained by 3D-DIC, is plotted for state 3, and final failure pattern is shown at the bottom right
minimal at 45° since stress is not aligned with fibers. The normal stress ratio criterion could then be reached more easily in this direction.
The stress–strain curve of the test is also plotted Fig.12. As we can see, the load decrease due to crack propagation is very little, with a slight break in the stress–strain curve at strain g =0.08). It can be explained by the overly high cross section of the specimen compared to the propagation length. The energy release rate was therefore not measured.
On [0/90; ±45]s samples, the failure phenomenon were
noticeably different. We can see the damage progression in a sample in Fig.13, and the 2 other samples failed in the same way: as the load increased, a crack initiated at the pre-crack tip but with an angle at 45° in the other direction (state 2). Its propagation was stable until it reached the fixture, and we observed that it occurred under a compressive state of stress normal to the crack direction (see ε22field of state 3). Then,
a second crack initiated at the initial pre-crack tip (state 4). The geometrical angle induced by the first compression crack may have caused stress concentration and provoked the second crack initiation at this point. This second crack was also stable, and it propagated at 45° under tension opening loading (ε11field of state 5). At the end of the test,
final failure occurred as delamination and buckling at the center of the sample (states 7 and 8). These phenomena were obviously dependent on geometrical parameters of the test. We can nevertheless note the ability of the test to generate stable crack growth under tangential compression stress.
Fatigue Crack Growth Under Shear
The same coupon’s geometry was used to study the crack growth under fatigue loading. A strain-imposed cyclic
loading was applied. This driving mode was adopted to be consistent with previous study methods and with in-flight loading. Maximum shear strain was gmax= 0.012. It was
chosen high enough for the pre-crack to initiate and propa-gate at a sufficiently low speed to be representative of a high-cycle fatigue test. The strain ratio was R=gmin/gmax=
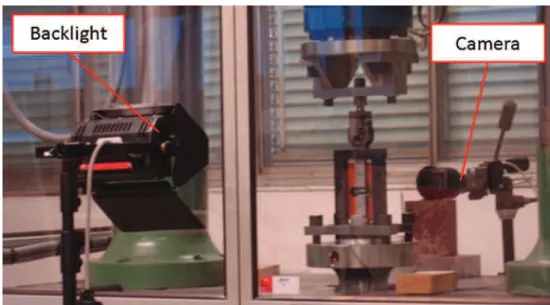
1/3. The test frequencies were either 10 or 20Hz. A PID controller was used to ensure hydraulic actuator control. Tests were divided into sequences of ΔN cycles. After each sequence of ΔN cycles the actuator stopped; a halogen backlight illuminated the opposite face of the sample while a camera captured an image of the front face of the sample. A photograph of the system is shown in Fig. 14. This backlight technique reveals the resin whitening, classically attributed to matrix damage, through transparency. ΔN var-ied from 1,000 to 10,000 cycles which generated several hundred images for a single test. The procedure was auto-mated with a Labview routine and the associated interfaces, which managed and received signals from the actuator driv-er and controlled the spotlight and triggdriv-ered the camdriv-era.
For the two specimens [0/90]4tested under these
condi-tions, the same scenario occurred. After a few thousand cycles, the crack initiated, and a damage area below the pre-crack clearly appeared. Its direction quickly angled from the initial pre-crack orientation. This direction was close to an axis given by the crossover points (see Fig.15). At these points, warp and weft bundles weave together, and are then subjected to stress concentration [23]. We also observed vertically oriented damage which initiated at regular spatial intervals. It is similar to the kind of damage already ob-served by Mandell on cyclic compact tension tests on cross-ply laminates. He called it ‘subcracks’ as he observed them running in the loading direction, parallel to fibers [24]. One
Fig. 13 Progressive failure of a notched [0/90;±45]slaminate under quasi-static loading. Different states are shown, and strain field in ±45 frame,
of the samples was cut out and its surface was polished to observe the cracked area. Figure16shows SEM micrograph of the crack shape, on a plane where bundles are mainly vertical. We can clearly notice the main crack, going from the left to the right of the picture, guided by crossover points. At regular intervals, every three bundles, a subcrack appears vertically. This characteristic width of three bundles can be related to the weaving pattern of the laminate (see
Fig.15(b)).
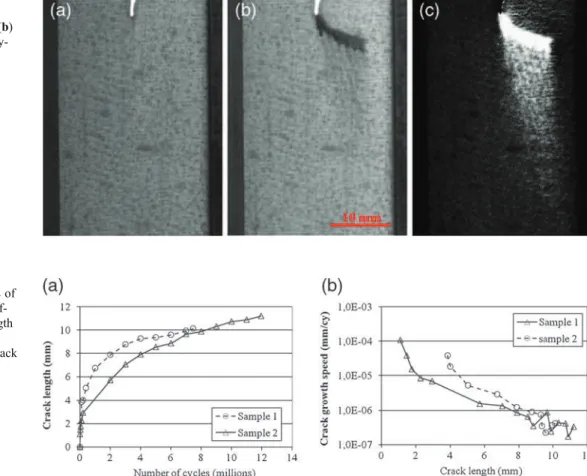
In addition, we could distinguish a color contrast between the area below the crack and the other parts of the sample. This resin whitening indicated a pronounced damage area
revealed by backlight images (Fig.17(b)) in comparison to the coupon before testing (Fig.17(a)). Each test attained the total of about 107cycles before propagation stabilization. Actually, while propagating, the crack tip approached the fixture in which the sample was clamped. This rigid linkage limited the crack opening and thus reduced the energy release rate.
An in-house Matlab routine was developed to observe the damage expansion. The routine has two images taken at different times in input. It aligns them, according to the result of a spatial convolution product, and computes their difference. Then a stage of threshold adjusting and filtering Fig. 14 Photograph of the crack
monitoring device
Fig. 15 Comparison between crack growth directions of 2 samples and the weave pattern of the fabric
shows the output image with the damage spread between the two times. We can see a result of this method in Fig.17(c)
with the comparison between images at zero cycles and 7.106cycles. The damage zone spread 20 mm below the crack. It seemed to have enlarged vertically as the crack was growing. The exploitation of these images also enabled
us to measure the crack length at regular intervals which was plotted against the number of cycles for the two samples (Fig. 18(a)). Then the crack growth speed was computed and plotted against the number of cycles for the two samples in Fig.18(b), showing the speed decrease when the crack tip came close to the fixture.
Fig. 16 SEM view of a sample after fatigue crack propagation. It points out subcracks parallel to the fibers and the main crack propagating through crossover points
Fig. 17 Monitoring of crack propagation: (a) before test, (b) after 7.106cycles, (c) pixel-by-pixel difference of grey level between (a) and (b) pictures
Fig. 18 Experimental results of fatigue crack growth for 2 dif-ferent samples: (a) crack length versus number of cycles, (b) crack growth speed versus crack length
Conclusions
An original solution of an experimental device adapted to the study of thin laminate behavior under in-plane shear loading has been proposed. It can be used under quasi-static and cyclic loading and it has demonstrated the follow-ing advantages and functions:
& The sample is loaded under pure in-plane shear on a large area without buckling and limited out-of-plane displacement.
& It can be operated successively in both directions with-out looseness in the apparatus.
& The shear strain can be directly measured and the fatigue test can be driven using the resulting data.
& Stable crack growth under shear loading can be observed.
& The apparatus can be adapted to a tension/compression testing machine without a grip.
Validation and characterization tests provided an outline of the rheological aspects of a woven glass/epoxy laminate, under shear. The [0/90]4laminate behavior determined by
the epoxy resin behavior is highly non-linear. Its rheology demonstrated non-linear elasticity, permanent strains, recov-ery, and important hysteresis.
Through-the-thickness crack growth tests have also been carried out under quasi-static and fatigue loading. The latter constitute very original tests. Results obtained are significantly different under quasi-static and fatigue loading, and the crack direction depends on the stacking sequence. For [0/90]4 laminates, it respects the
maxi-mum tangential stress criterion under quasi-static load-ing whereas it follows crossover points of the weavload-ing pattern in the fatigue case. A wide damage area has been identified in both cases. For [0/90, ±45]s laminates
stable compression crack growth is observed before a second crack initiates.
All these results can be exploited to enrich the numerical modeling of crack growth and to control the accuracy of the model’s results.
References
1. Bizeul M, Bouvet C, Barrau JJ, Cuenca R (2010) Influence of woven ply degradation on fatigue crack growth in thin notched composites under tensile loading. International Journal of Fatigue 32(1):60–65
2. Bizeul M, Bouvet C, Barrau JJ, Cuenca R (2011) Fatigue crack growth in thin notched woven glass composites under tensile loading. Part I: Experimental Composites Science and Technology 71(3):289–296
3. Bizeul M, Bouvet C, Barrau JJ, Cuenca R (2011) Fatigue crack growth in thin notched woven glass composites under tensile
loading. Part II: Modelling Composites Science and Technology 71(3):297–305
4. Tarnopol’skii Y, Kulakov V, Aranautov A (2000) Measurements of shear characteristics of textile composites. Computers & Structures 76(1–3):115–123
5. Lee S, Munro M (1986) Evaluation of in-plane shear test methods for advanced composite materials by the decision analysis tech-nique. Composites 17(1):13–22
6. Lessard LB, Eilers OP, Shokrieh MM (1997) Modification of the three-rail shear test for composite materials under static and fatigue loading. Composite Materials: Testing and Design. Ed. American Society for Testing and Materials Thirteeth: 217–233
7. Lakshminarayana HV (1984) A symmetric rail shear test for mode II fracture toughness (GIIC) of composite materials—finite ele-ment analysis. Journal of Composite Materials 18(3):227–238 8. Tan S, Kim R (1988) Fracture of composite laminates containing
cracks due to shear loading. Experimental Mechanics 28(4):364–372 9. Coker EG (1912) An optical determination of the variation of stress in a thin rectangular plate subjected to shear. Proc R Soc Lond A 86(587):291–319
10. Whitney JM, Stansbarger DL, Howell HB (1971) Analysis of the rail shear test applications and limitations. Journal of Composite Materials 5:24–34
11. Sims D (1973) In-plane shear stress–strain response of unidirectional composite materials. Journal of Composite Materials 7:124–128 12. Garcia R, Weisshaar T, McWithey R (1980) An experimental and
analytical investigation of the rail shear-test method as applied to composite materials. Experimental Mechanics 20(8):273–279 13. Yaniv G, Daniel IM, Lee JW (1989) Method for monitoring
in-plane shear modulus in fatigue testing of composites, Northwest-ern Univ Evanston IL Dept Of Civil Engineering
14. Lessard LB, Eilers OP, Shokrieh MM (1995) Testing of in-plane shear properties under fatigue loading. Journal of Reinforced Plas-tics and Composites 14(9):965–987
15. Ng S-P, Tse P-C, Lau K-J (1998) Numerical and experimental determination of in-plane elastic properties of 2/2 twill weave fabric composites. Composites Part B: Engineering 29(6):735–744 16. De Baere I, Van Paepegem W, Degrieck J (2008) Design of a modified three-rail shear test for shear fatigue of composites. Polymer Testing 27(3):346–359
17. Mohseni Shakib SM, Li S (2009) Modified three rail shear fixture (ASTM D 4255/D 4255 M) and an experimental study of nonlinear in-plane shear behaviour of FRC. Composites Science and Tech-nology 69(11–12):1854–1866
18. ASTM (1994) ASTM D4255/D4255M-83: Standard Guide for Testing In-Plane Shear Properties of Composite Laminates (Two-and Three-Rail Shear Test)
19. Zrida M, Laurent H, Rio G, Pimbert S, Grolleau V, Masmoudi N, Bradai C (2009) Experimental and numerical study of polypropyl-ene behavior using an hyper-visco-hysteresis constitutive law. Computational Materials Science 45(2):516–527
20. Blès G, Gadaj SP, Nowacki WK, Tourabi A (2002) Experimental study of a PA66 solid polymer in the case of cyclic shear loading. Warszawa 54:155–174
21. Rouault T, Bouvet C, Bizeul M, Nègre V, and Rauch P (2012) A bundle-scale model of propagation of a through-the-thickness notch in a thin woven composite under fatigue loading. Venice, Italy 22. Buczek MB, Herakovich CT (1985) A normal stress criterion for crack extension direction in orthotropic composite materials. Jour-nal of Composite Materials 19:544–578
23. Melro AR, Camanho PP, Andrade Pires FM, Pinho ST (2012) Numerical simulation of the non-linear deformation of 5-harness satin weaves. Computational Materials Science 61:116–126 24. Mandell JF (1975) Fatigue crack propagation rates in woven and
nonwoven fiber glass laminates. ASTM special technical publica-tion 580:515–527
![Fig. 1 Sketch of 3-rail shear test principle as described in ASTM standard [18]](https://thumb-eu.123doks.com/thumbv2/123doknet/3583009.105092/3.892.460.816.571.1028/fig-sketch-rail-shear-principle-described-astm-standard.webp)
![Fig. 4 Technological solution proposed by De Baere et al. (a) [16] and Mohseni Shakib and Li (b) [17] of 3-rail shear apparatus for fatigue experiments with negative load ratio](https://thumb-eu.123doks.com/thumbv2/123doknet/3583009.105092/5.892.353.815.80.266/technological-solution-proposed-mohseni-shakib-apparatus-experiments-negative.webp)
![Fig. 12 Progressive failure of a notched [0/90] 4 laminate under quasi-static loading](https://thumb-eu.123doks.com/thumbv2/123doknet/3583009.105092/9.892.256.818.78.318/fig-progressive-failure-notched-laminate-quasi-static-loading.webp)
![Fig. 13 Progressive failure of a notched [0/90;±45] s laminate under quasi-static loading](https://thumb-eu.123doks.com/thumbv2/123doknet/3583009.105092/10.892.128.767.714.1028/fig-progressive-failure-notched-laminate-quasi-static-loading.webp)