Publisher’s version / Version de l'éditeur:
Journal of Physics B : Atomic, Molecular and Optical Physics, 44, 9, p. 095601,
2011-04-20
READ THESE TERMS AND CONDITIONS CAREFULLY BEFORE USING THIS WEBSITE.
https://nrc-publications.canada.ca/eng/copyright
Vous avez des questions? Nous pouvons vous aider. Pour communiquer directement avec un auteur, consultez la
première page de la revue dans laquelle son article a été publié afin de trouver ses coordonnées. Si vous n’arrivez pas à les repérer, communiquez avec nous à [email protected].
Questions? Contact the NRC Publications Archive team at
[email protected]. If you wish to email the authors directly, please see the first page of the publication for their contact information.
NRC Publications Archive
Archives des publications du CNRC
This publication could be one of several versions: author’s original, accepted manuscript or the publisher’s version. / La version de cette publication peut être l’une des suivantes : la version prépublication de l’auteur, la version acceptée du manuscrit ou la version de l’éditeur.
For the publisher’s version, please access the DOI link below./ Pour consulter la version de l’éditeur, utilisez le lien DOI ci-dessous.
https://doi.org/10.1088/0953-4075/44/9/095601
Access and use of this website and the material on it are subject to the Terms and Conditions set forth at
Separation of target structure and medium propagation effects in
high-harmonic generation
Jin, Cheng; Worner, Hans Jakob.; Tosa, V.; Le, Anh-Thu; Bertrand, Julien B.;
Lucchese, R. R.; Corkum, P. B.; Villeneuve, D. M.; Lin, C. D.
https://publications-cnrc.canada.ca/fra/droits
L’accès à ce site Web et l’utilisation de son contenu sont assujettis aux conditions présentées dans le site LISEZ CES CONDITIONS ATTENTIVEMENT AVANT D’UTILISER CE SITE WEB.
NRC Publications Record / Notice d'Archives des publications de CNRC:
https://nrc-publications.canada.ca/eng/view/object/?id=a3ba8b75-1e44-41cd-a1d9-e92caa63baa9 https://publications-cnrc.canada.ca/fra/voir/objet/?id=a3ba8b75-1e44-41cd-a1d9-e92caa63baa9
Generation
Cheng Jin,1Hans Jakob W¨orner,2
V. Tosa,3 Julien B. Bertrand,2 Anh-Thu Le,1 R. R. Lucchese,4 P. B. Corkum,2 D. M. Villeneuve,2 and C. D. Lin1
1J. R. Macdonald Laboratory, Physics Department,
Kansas State University, Manhattan, Kansas 66506-2604, USA
2Joint Laboratory for Attosecond Science, National Research Council of Canada and University of Ottawa,
100 Sussex Drive, Ottawa, Ontario, Canada K1A 0R6
3National Institute for R&D of Isotopic and Molecular Technologies, 400293 Cluj-Napoca, Romania 4Department of Chemistry, Texas A&M University, College Station, Texas 77843-3255, USA
(Dated: October 24, 2010)
We calculate high-harmonic generation (HHG) by intense infrared lasers in atoms and molecules with the inclusion of macroscopic propagation of the harmonics in the gas medium. We show that the observed experimental spectra can be accurately reproduced theoretically despite that HHG spectra are sensitive to the experimental conditions. We further demonstrate that the simulated (or experimental) HHG spectra can be factored out as a product of a “macroscopic wave packet” and the photo-recombination transition dipole moment where the former depends on the laser properties and the experimental conditions, while the latter is the property of the target only. The factorization makes it possible to extract target structure from experimental HHG spectra, and for ultrafast dynamic imaging of transient molecules.
PACS numbers: 42.65.Ky,31.70.Hq,33.80.Eh
High-harmonic generation (HHG) has been employed to probe electronic structure of molecules on an ultra-fast time scale in recent years [1–3]. When molecules are placed in an intense laser field, electrons that are removed earlier may be driven back to recollide with the parent ion. HHG occurs when the returning electrons recombine with the parent ion with the emission of high-energy pho-tons as in an inverse photoionization (PI) process. Since PI is a sensitive tool for probing electronic structure of molecules, HHG may serve likewise, but with the advan-tage of ultrafast temporal resolution as well as covering a coherent broad spectral range from XUV to soft-X-rays. Experimentally, however, HHG is generated from all the molecules in the interaction region. The radiations from them co-propagate with the fundamental infrared (IR) beam nonlinearly. To extract structure information of individual molecules, e.g., the amplitude and phase of PI transition dipole from the measured HHG, the prop-agation effect in the medium should be investigated. For molecular targets, this has not been done so far. Instead, it was often assumed that HHG was measured under the perfect phase-matching condition and that the observed harmonics were directly proportional to the harmonics from a single molecule. While such assumptions may be adequate for explaining many experimental observa-tions qualitatively, such as the dependence of HHG on molecular alignment and on symmetry of the molecular orbital, the two-center interference [4, 5], and multiple-orbital contributions to HHG [6], they are inadequate if accurate structure information of individual molecules are to be extracted from the observed HHG spectra.
The effect of macroscopic propagation (MP) on the
observed HHG spectra for atoms has been investigated extensively in the past two decades in connection with the generation of attosecond pulses. However, we are not aware of any direct comparison between experimen-tal HHG and theoretical simulations over an extended spectral region. The Maxwell’s equations that govern the propagation of the fundamental driving IR field and the generated harmonics are well established. To carry out such propagation calculations, accurate induced atomic dipoles generated by lasers for hundreds of peak intensi-ties should be calculated which serve as the source term of the harmonics. These induced dipoles are often cal-culated using the strong-field approximation (SFA), or the so-called Lewenstein model [7]. The SFA does not describe the laser-atom interactions accurately, thus the results from the propagation can only be used to qualita-tively interpret the experiments. While accurate induced dipoles can be obtained from solving the time-dependent Schr¨odinger equation (TDSE), the calculation is rather time consuming and was rarely attempted except for very few occasions [8]. Thus after two decades, our under-standing of experimental HHG data is still mostly at the qualitative level.
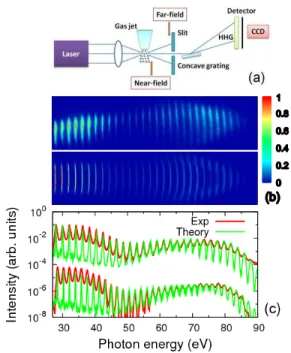
In this Letter, we show that such limitations have been removed. We generate HHG spectra theoretically under experimental conditions and the results are compared di-rectly to the observed data. The simulated spectra agree well with the measured one, over a broad photon energy region. The experiments were taken in a geometry as de-picted in Fig. 1(a), using IR laser pulses with wavelengths of 1200 nm and 1360 nm, respectively, generated in a high-energy optical parametric amplifier (HE-TOPAS).
2 The TOPAS was pumped by the output of a multipass
femtosecond amplifier system (8 mJ, 32 fs, 50Hz). High-harmonic radiation generated from the gas jet is allowed to propagate and a slit is placed downstream. After the slit, a concave grating disperses the harmonics which are then detected with a CCD detector. The gas jet is formed from a supersonic expansion of Ar or N2at a stagnation pressure of 3 bars. Experiments were performed on either isotropic or aligned N2molecules.
Fig. 1(b) shows the HHG spectra of Ar generated by a 1200 nm laser. The horizontal axis is the photon en-ergy and the vertical axis is the transverse spatial dimen-sion. The upper frame is from the measurement, while the bottom frame is from the simulation. There is a general agreement of the two spectra. The “up-down” asymmetry in the experimental HHG spectra is due to asymmetry in the laser beam profile. The faint features near 50 eV are the “famous” Cooper minimum in Ar [9], observed in photoionization, as well as in earlier HHG spectra [10, 11]. The harmonic yields integrated over the vertical dimension are compared in the upper half of Fig. 1(c). The lower half shows the HHG spectra taken with 1360 nm laser. In both cases, we can see very good agreement between theory and experiment over the 30-90 eV region covered. Experimentally, the gas jet is 0.5 mm long and placed 3 mm after the focus. A vertical slit with a diameter of 100 µm is placed 24 cm after the gas jet. For the 1200 (1360) nm the beam waist at the laser focus is 47.5 (52.5) µm, and the pulse duration is ∼40 (∼50) fs. To achieve best overall agreement, in the simulation the peak intensity and gas pressure for each wavelength are adjusted till best overall fit in the data are achieved. Thus for 1200 nm laser, the peak intensity for experi-ment (theory) is 1.6 (1.5)×1014
W/cm2
, gas pressure is 28 (84) Torr. For the 1360 nm laser, the correspond-ing parameters are 1.25 (1.15)×1014
W/cm2
, and 28 (56) Torr, respectively.
In the theoretical simulation, we first obtain single-atom induced dipole using the quantitative rescattering (QRS) theory [12–14]. The Ar is treated in the single-active electron approximation using model potential pro-posed by Muller [15]. The resulting induced dipole for different peak intensities are then fed into the Maxwell’s equations. The propagation equations for the fundamen-tal and the harmonics are the standard ones [16–18]. For Ar target, we include dispersion, absorption, Kerr and plasma effects on the fundamental field in the medium. For the harmonics, only the dispersion and absorption are included. The harmonic yields emitted at the exit face of the gas jet (near field) are propagated to the far field where the harmonics are measured. They are ob-tained from the near-field harmonics through a Hankel transform [19, 20]. We assume the laser beam in the entrance of gas jet has the Gaussian shape.
A careful examination of Figs. 1(b) and (c) reveals that there are still small discrepancies between the
experimen-FIG. 1: (Color online) (a) Typical configuration for measur-ing HHG in the far field. (b) HHG spectra of Ar generated by 1200 nm laser. Upper frame: experiment; lower frame: the-ory. (c) Comparison of theoretical (green curves) and exper-imental (red curves) HHG yields integrated over the vertical dimension for 1200 nm (upper curves) and 1360 nm (lower curves) lasers. Laser parameters are given in the text.
tal data and the simulation. The harmonic width (or harmonic chirp) is narrower from the theory than from the experiment. Harmonic chirp is a direct consequence of temporal variation of laser intensity. The harmonic width is mainly influenced by the pulse duration, pres-sure, and laser intensity [21–23]. The width decreases with increasing pulse duration, and with increasing gas pressure. Other experimental factors like the use of slits and location of the detector also can affect the HHG spec-tra.
High-order harmonics from molecules by 1200 nm lasers have been reported for aligned and randomly dis-tributed N2 and CO2 recently [24]. Here we report our simulated results for N2, at the two peak laser intensities, 0.9 and 1.1×10¹⁴
W/cm2
, reported in [24]. To achieve good agreement in the cutoff positions, the two inten-sities used in the theory are 0.78 and 0.9×10¹⁴
W/cm2 instead, respectively. Since the experiment was carried out at low laser intensity and low gas pressure, the har-monics are propagated without absorption and disper-sion effects from the medium, and the fundamental laser field is not modified through the medium [25]. In the theoretical simulation, we first obtain induced dipoles of fixed-in-space molecules using QRS theory [13, 14] for different laser peak intensities. The induced dipoles are averaged coherently according to the alignment
distribu-10-8 10-6 10-4 10-2 100 30 40 50 60
Intensity (arb. units)
(a)
Random 0.9I0 0.78I0 10-8 10-6 10-4 10-2 100 30 40 50 60Photon energy (eV)
Aligned 0.9I0
0.78I0
(b)
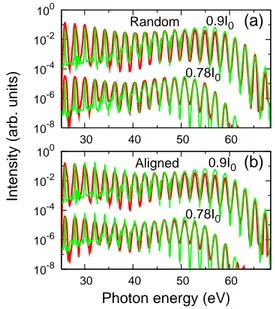
FIG. 2: (Color online) Comparison of HHG spectra from the-ory (green curves) and experimental results (red curves) of Ref. [24], (a) for randomly distributed N2 and (b) for N2
aligned along laser polarization direction. The laser intensi-ties are indicated where I0=10
14
W/cm2
. See text for addi-tional laser parameters.
tion and then fed into the Maxwell’s equations. Fig. 2 shows the good overall agreement between the measured and the simulated spectra, for both randomly distributed and aligned N2. By examining the experimental HHG spectra more carefully, they reveal a shallow minimum at 38±2eV (low intensity) and at 41±2eV (high intensity) for both aligned and unaligned molecules. The theory also predicts a minimum: for unaligned molecules, the minimum is at ∼39eV for low intensity and ∼40eV for high intensity. For aligned molecules, the minimum is at ∼42eV for low intensity and ∼44eV for high intensity. In the experiment, the degree of alignment was estimated to be hcos2
θi=0.6-0.65. In the simulation, an alignment distribution of cos4
θ is used. Note that only HOMO is included in the calculation. We believe that this is the first time that HHG from molecules have been cal-culated including the propagation effect in the medium and the simulated results have been compared directly to the measured spectra. In the future, HHG spectra taken at different alignment angles should be compared together. Such comparison would help to identify factors that contribute to the remaining discrepancies between experiment and simulation.
The macroscopic HHG spectra can be expressed as [25] Sh(ω) ∝ ω
4
|W (ω)|2 |d(ω)|2
(1) where W (ω) (the complex amplitude) is called “Macro-scopic wave packet” (MWP), d(ω) is PI transition dipole moment for the atom. For the molecule d(ω) is taken to be the coherently averaged PI transition dipole
mo-ment davg(ω) =Rπ 0 N(θ)
1
2ρ(θ)d(θ, ω) sin θdθ, where N (θ)
is the alignment-dependent ionization probability, ρ(θ) is the alignment distribution, and d(θ, ω) is alignment-dependent transition dipole moment [26]. The polariza-tion of pump laser is assumed parallel to probe laser. For unaligned molecules, ρ(θ) is a constant. Actually, MWP has the clear physical meaning. It can be consid-ered as the collective effect of microscopic wave packets for the returning electrons [13, 14], which is governed by Maxwell’s equations. In other words, the laser and macroscopic medium effects are all combined into MWP. The validity of Eq. (1) has been checked in Jin et al. [25] when both the laser intensity and the gas pressure are low. The correctness of this relation has been as-sumed in Itatani et al. [1] by comparing Ar with N2, and in Levesque et al. [27] for rare gas atoms. However, this relation has not been carefully checked for different fo-cusing conditions and laser parameters. Theoretically, we have checked the validity of Eq. (1) carefully. We carried out macroscopic propagation calculation of HHG using single-atom (single-molecule) induced dipole obtained by QRS and by SFA. We have been able to show that the MWP obtained from the two calculations agree rather well, irrespective of laser parameters or the focusing con-ditions. In other words, the medium propagation only affects HHG through its modifications on the MWP. In this way, to study propagation effect on HHG, we can just study how the MWP (only the amplitude is consid-ered below) depends on the lasers and the experimental conditions.
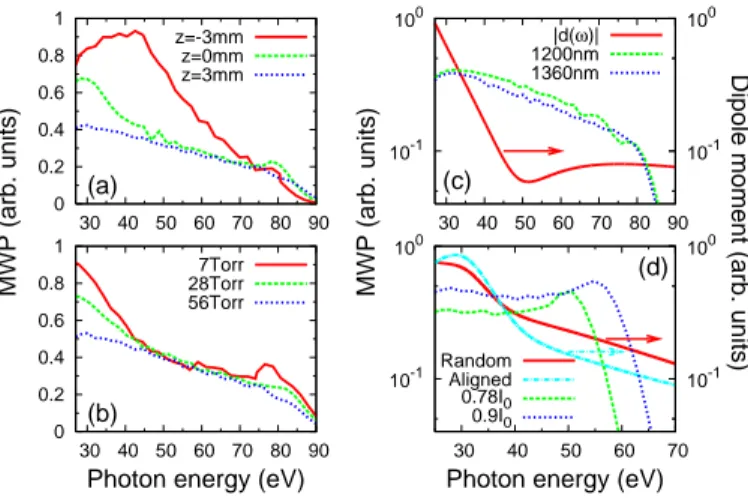
In Fig. 3(a) we show the dependence of MWP on the position of the Ar gas jet with respect to the laser fo-cus. The laser intensity is 1.6×10¹⁴
W/cm2
, and the gas pressure is 56 Torr. For easy visualization we show the smooth envelope of |W (ω)|. The three curves are for the gas jet at z=-3 (before), 0 (at) , +3 (after) mm with re-spect to the laser focus. It is generally known that HHG achieves best phase matching if the gas jet is placed be-hind the laser focus where the dipole phase from the har-monic can be partially canceled by the Gouy phase. Thus among the three curves, the “after” curve is the flattest one. For the “before” focus, the MWP varies most as the photon energy is changed, and in the HHG spectra, the width of each harmonic (not shown) is not sharp, and the phase varies widely from order to order — reflecting the poor phase matching for this geometry.
In Fig. 3(b) we compare the MWP derived from chang-ing the Ar gas pressure for the “after” focuschang-ing condition. The MWP has been normalized by the ratio of the pres-sure. Under perfect phase matching condition, the MWP |W (ω)| (the amplitude) should be proportional to the pressure [28]. The three curves are on top of each other from 45-75 eV, indicating good phase-matching in this energy region, but differ somewhat at lower and higher energies, indicating good phase matching condition is not fulfilled. This demonstrates that phase matching
condi-4 0 0.2 0.4 0.6 0.8 1 30 40 50 60 70 80 90 MWP (arb. units) (a) z=-3mm z=0mm z=3mm 0 0.2 0.4 0.6 0.8 1 30 40 50 60 70 80 90
Photon energy (eV) (b) 7Torr 28Torr 56Torr 10-1 100 30 40 50 60 70 80 90 10-1 100 (c) MWP (arb. units)
Dipole moment (arb. units)
|d(ω)| 1200nm 1360nm 10-1 100 30 40 50 60 70 10-1 100
Photon energy (eV) (d)
Random Aligned 0.78I0 0.9I0
FIG. 3: (Color online) (a) Dependence of macroscopic wave packet |W (ω)| (MWP) on the position of the Ar gas jet with respect to laser focus; (b) Effect of gas pressure on MWP. The curves are renormalized such that they should fall on the same curve if perfect phase matching condition is fulfilled. (c) The MWP for the two lasers, and the magnitude of the PI transition dipole moment of Ar. (d) Same as in (c) but for N2. The MWP is for two different laser intensities, and
the averaged PI transition dipoles are for isotropic vs aligned molecules. The laser intensities are indicated where I0=10
14
W/cm2
. See Text.
tion cannot be achieved for all the harmonics in a given experiment.
According to Eq. (1), the minimum in the HHG spectra can occur for different reasons. In Fig. 3(c), the MWP derived from Ar target using 1200 nm and 1360 nm lasers are shown. The two MWP’s are quite similar but near 50 eV, they have slight different slopes. On the other hand, the PI transition dipole reveals a clear but broad Cooper minimum near 50 eV. Thus the broad minimum in the HHG spectra shown in Fig. 1(c) is due to the minimum in the PI transition dipole. To pin down the position of the “real” minimum, on the other hand, is not as easy since the minimum position can be modified somewhat by the MWP.
Similar analysis can be carried out on the HHG spec-tra of N2 shown in Fig. 2. The averaged PI transition dipole indeed shows a rapid drop near 40 eV, which is due to the presence of a shape resonance [29] of N2 in the lower energy. The rapid drop is more pronounced for aligned molecules than for random ones, see Fig. 3(d). For the MWP, under the same laser intensity, we have checked that they are the same for randomly distributed and aligned molecules. Thus it explains why the HHG from single-molecule response can be used to interpret how the intensity of each harmonic changes with pump-probe time delay in Le et al. [30]. However, the MWP changes more rapidly with laser intensity, especially for the longer wavelength laser used here. We note that the two MWP’s in Fig. 3(d) have somewhat different slopes
near 40 eV. The multiplication of the MWP and the PI transition dipole results in a weak minimum in the ob-served HHG. The minimum would be more clearly seen if the molecules were better aligned. From Le et al. [13], the minimum in PI transition dipole changes rapidly with the alignment angle and the effect is severely averaged out when molecules are not well aligned. We further mention that the MWP in Figs. 3(c) and (d) are rather different. They are due to the large difference in the laser peak intensities used [25].
In summary, we demonstrated that experimental HHG spectra can now be accurately reproduced from ab ini-tio calculations. The theory starts with the calculation of laser-induced dipoles from single atoms or molecules using the recently developed quantitative rescattering (QRS) theory [13, 14]. The propagation effect of the fundamental field and the harmonics in the medium is incorporated by solving the Maxwell’s equations. We further showed that the simulated (and experimental) HHG spectra can be expressed as the product of a macro-scopic wave packet and the photo-recombination transi-tion dipole moment. The latter is a property of the tar-get, and is independent of the lasers, nor of the propaga-tion effect. This factorizapropaga-tion makes it possible to extract target structure information from the experimental HHG spectra. It provides the needed theoretical basis for us-ing HHG as ultrafast probes of excited molecules, such as those demonstrated recently [3]. Clearly, this work also opens up opportunities for the quantitative studies of the phases of HHG which are fundamental to the generation of attosecond pulses.
This work was supported in part by Chemical Sciences, Geosciences and Biosciences Division, Office of Basic ergy Sciences, Office of Science, U.S. Department of En-ergy.
[1] J. Itatani et al., Nature (London) 432, 867 (2004). [2] O. Smirnova et al., Nature (London) 460, 972 (2009). [3] H. J. W¨orner et al., Nature (London) 466, 604 (2010). [4] T. Kanai et al., Nature (London) 435, 470 (2005). [5] M. Lein et al., Phys. Rev. Lett. 88, 183903 (2002). [6] B. K. McFarland et al., Science 322, 1232 (2008). [7] M. Lewenstein et al., Phys. Rev. A 49, 2117 (1994). [8] M. B. Gaarde et al., Phys. Rev. A 74, 053401 (2006). [9] J. W. Cooper, Phys. Rev. 128, 681 (1962).
[10] H. J. W¨orner et al., Phys. Rev. Lett. 102, 103901 (2009). [11] S. Minemoto et al., Phys. Rev. A 78, 061402 (2008). [12] T. Morishita et al., Phys. Rev. Lett. 100, 013903 (2008). [13] A. T. Le et al., Phys. Rev. A 80, 013401 (2009). [14] C. D. Lin et al., J. Phys. B 43, 122001 (2010). [15] H. G. Muller, Phys. Rev. A 60, 1341 (1999). [16] E. Priori et al., Phys. Rev. A 61, 063801 (2000). [17] M. B. Gaarde et al., J. Phys. B 41, 132001 (2008). [18] V. Tosa et al., Phys. Rev. A 71, 063807 (2005). [19] A. L’Huillier et al., Phys. Rev. A 46, 2778 (1992).
[20] V. Tosa et al., Phys. Rev. A 79, 043828 (2009). [21] M. B. Gaarde et al., Phys. Rev. A 59, 1367 (1999). [22] A. Za¨ır et al., Phys. Rev. Lett. 100, 143902 (2008). [23] X. He et al., Phys. Rev. A 79, 063829 (2009).
[24] H. J. W¨orner et al., Phys. Rev. Lett. 104, 233904 (2010). [25] C. Jin et al., Phys. Rev. A 79, 053413 (2009).
[26] A. T. Le et al., Phys. Rev. A 82, 023814 (2010). [27] J. Levesque et al., Phys. Rev. Lett. 98, 183903 (2007). [28] V. S. Yakovlev et al., Opt. Express 15, 15351 (2007). [29] R. R. Lucchese et al., Phys. Rev. A 25, 2572 (1982). [30] A. T. Le et al., Phys. Rev. Lett. 102, 203001 (2009).