Publisher’s version / Version de l'éditeur:
Vous avez des questions? Nous pouvons vous aider. Pour communiquer directement avec un auteur, consultez la première page de la revue dans laquelle son article a été publié afin de trouver ses coordonnées. Si vous n’arrivez pas à les repérer, communiquez avec nous à [email protected].
Questions? Contact the NRC Publications Archive team at
[email protected]. If you wish to email the authors directly, please see the first page of the publication for their contact information.
https://publications-cnrc.canada.ca/fra/droits
L’accès à ce site Web et l’utilisation de son contenu sont assujettis aux conditions présentées dans le site LISEZ CES CONDITIONS ATTENTIVEMENT AVANT D’UTILISER CE SITE WEB.
Technical Report (National Research Council of Canada. Institute for Ocean Technology); no. TR-2006-15, 2006
READ THESE TERMS AND CONDITIONS CAREFULLY BEFORE USING THIS WEBSITE.
https://nrc-publications.canada.ca/eng/copyright
NRC Publications Archive Record / Notice des Archives des publications du CNRC :
https://nrc-publications.canada.ca/eng/view/object/?id=e918452a-d525-449e-904d-1366cf82f720 https://publications-cnrc.canada.ca/fra/voir/objet/?id=e918452a-d525-449e-904d-1366cf82f720
For the publisher’s version, please access the DOI link below./ Pour consulter la version de l’éditeur, utilisez le lien DOI ci-dessous.
https://doi.org/10.4224/8896272
Access and use of this website and the material on it are subject to the Terms and Conditions set forth at Dual-view ice crushing experiments
REPORT NUMBER TR-2006-15
NRC REPORT NUMBER DATE June 2006 REPORT SECURITY CLASSIFICATION
Unclassified
DISTRIBUTION Unlimited TITLE
DUAL-VIEW ICE CRUSHING EXPERIMENTS
AUTHOR(S)
Claude Daley1 and Robert Gagnon2
CORPORATE AUTHOR(S)/PERFORMING AGENCY(S) 1
Faculty of Engineering and Applied Science, Memorial University of Newfoundland 2Institute for Ocean Technology, National Research Council, St. John’s, NL
PUBLICATION
SPONSORING AGENCY(S) PERD/CHC Report 8-109
IOT PROJECT NUMBER NRC FILE NUMBER
KEY WORDS
Ice, crushing, behaviour, loads, models
PAGES ii, 39, App. FIGS. 20 TABLES SUMMARY
Ice is a unique and fascinating material. Much like the rock of the earth’s crust, sea ice can form a crust on the cold oceans of the world. The eastern coastal waters in Canada are prone to extensive ice coverage. Ice will often be the dominant consideration in the design of ships and offshore structures in Canadian waters. There are many Polar and sub-Polar areas of the world where sea ice is also the dominant natural feature and the key design challenge. Consequently, improving our understanding of ice loads is a topic of large practical significance, as well as being a fascinating scientific challenge.
Several studies of ice crushing behavior have been conducted over of the past few
decades. Some of the more recent investigations included in situ visual observations using indentors (Joensuu and Riska, 1988, Muhonen 1991, Gagnon, 1998; Fransson et al., 1991, Daley 1994) and a ship hull (Riska et al., 1990) that incorporated windows for viewing the indented ice surface. There have also been test apparatus that allowed viewing of the ice/indentor interface through the ice samples (Gagnon, 1994a; Gagnon and Mølgaard, 1991). These have lead to significant new insights into the ice crushing process. Numerical contact process models based on available visual observations have been developed (Daley 1991, Daley et al. 1996). Further developments of these models is one of the continuing aims of this experimental work.
ADDRESS National Research Council Institute for Ocean Technology Arctic Avenue, P. O. Box 12093 St. John's, NL A1B 3T5
DUAL-VIEW ICE CRUSHING EXPERIMENTS
TR-2006-15
Claude Daley and Robert Gagnon
June 2006
Prepared for
National Research Council of Canada
By
Claude Daley
Faculty of Engineering and Applied Science Memorial University of Newfoundland and
Robert Gagnon
Institute for Ocean Technology
National Research Council of Canada
March 20, 2006
D
D
u
u
a
a
l
l
-
-
V
V
i
i
e
e
w
w
I
TABLE OF CONTENTS
Acknowledgement
1 INTRODUCTION ... 4
2 METHOD AND APPARATUS ... 5
2.1 Test Apparatus ... 5
2.2 Pressure Sensor ... 5
2.3 Ice Preparation ... 7
2.4 Digital Imaging ... 7
3 ANALYSIS OF A PHASE 1 TEST ... 8
3.1 High Speed Images ... 8
3.2 Pressure Measurement ... 12
3.3 Wetting Process... 13
4 PHASE 2 TESTS... 15
5 ELIMINATION OF IN-PLANE FRACTURES ... 17
6 CONCLUSIONS ... 26
7 REFERENCES ... 27
Appendix - Ice Crushing Images- Test 10 Table of Figures Figure 1. (a) Conceptual schematic of the ice crushing test method. (b) Details of the ice holder...5
Figure 2. Schematic of the crushing platen (a) and pressure sensor working principle (b) and (c). ...6
Figure 3. High speed digital video camera from HIS Inc. ...7
Figure 4. High-speed digital images (with time stamps) from a typical well-behaved test. The ice slab is in the plane of the image and the view is through a Plexiglas plate as shown in Figure 1. Images of the platen/ice contact from the top camera are inset (to scale) on three of the high-speed images. The test was conducted at –10ºC...9
Figure 5. Image from the high-speed video record indicating various aspects of the apparatus and ice behavior. The image is the same as that shown in Figure 4, at t = 1.086 s. ...10
Figure 6. Load record for the test shown in Figures 4 and 5 with markers (open circles) corresponding to the first 7 video images in Figure 4...10
Figure 7. Three images from Test No. 1 showing pressure distribution overlying the ice contact. Sensor contact with the platen is outlined. Intact ice (dark) is labeled while the rest of the view is pulverized ice. The height of each image is the thickness of the platen, 1 cm. ...13
Figure 8. Two high-speed digital images from a phase 2 test with the original apparatus. The ice slab is in the plane of the image and the view is through a Plexiglas plate as shown in Figure 1. Images of the platen/ice contact from the top camera are inset (to scale) on the high-speed images. Fairly intact ice is visible in the area subscribed from the base of the inset images up to the white line. Similarly the pressure sensor contact is the area subscribed from the bottom of the inset images up to the black line. The test was conducted at –10ºC, where the crushing platen moved at a rate of 10 mm/s...15
Figure 9. Load record for the test shown in Figure 8 with markers (open circles) corresponding to the two images. The images and makers are in sequence from left to right. ...16
Figure 10. Original ice-holder apparatus shown on left with portion modeled by finite element shown on the right. 17 Figure 11. Finite element model of the original ice-holder apparatus showing deformation of the aluminum bracing bars and the Plexiglas plates in response to a uniformly applied pressure to the lower half of the inner surface of the Plexiglas plates. The numbers on the color scheme are millimeters. The maximum deflection is 0.139mm 18 Figure 12 Finite element model with heavy ring steel confinement. The maximum deflection is 0.028 mm. ...19
Figure 13 Finite element model with heavy ring steel confinement, and with Aluminum in place of the Plexiglas. The maximum deflection is 0.008 mm ...19 Figure 14. Evolution of the ice-holder apparatus from the original version (top), to the stiffened version with
Plexiglas plates (center), to the present version where the Plexiglas plates have been replaced by aluminum plates (bottom). ...20 Figure 15. Load record for the test shown in Figure 16 with markers (open circles) corresponding to the three
images. The images and makers are in sequence from left to right. ...21 Figure 16. Three high-speed video images as viewed through the crushing platen showing ice contact during the first
test. The images are ordered according to the points indicated on the load record in Figure 15. The intact hard zones (dark areas) are outlined and lighter areas are generally pulverized ice. The width of each image is 1 cm. The images are grainy due to enhancement required because of inadequate light levels during the test. ...22 Figure 17. View of an intact hard zone in the ice-holder following the test shown in Figure 16. The hard zone
corresponds to the last image in Figure 8. ...23 Figure 18. Load record for the test shown in Figure 19 with markers (open circles) corresponding to the five images. The images and makers are in sequence from left to right. ...24 Figure 19. Five high-speed video images as viewed through the crushing platen showing ice contact during the
second test. The images are ordered from left to right according to the points indicated on the load record in Figure 18. The intact hard zones (dark areas) are outlined and lighter areas are generally pulverized ice. The bright areas are light reflections from the lighting system. The dark band in the middle of the bright zone near the top of the images is the pressure sensor contact width. The width of each image is 1 cm...24 Figure 20. Photos of ice inside the partially dismantled ice-holder following the second test. The dark area at the top
of the ice in the left image is an intact hard zone, with intact ice below it, free of in-plane fractures. Pulverized ice appears white. The right image shows the other side of the same ice, rotated 180o...25
Acknowledgement
The work was made possible with the support of funding from PERD (Panel on Energy Research and Development). The authors wish to thank Dr. Garry Timco of the NRC/CHC (Canadian Hydraulics Centre) for his support.
1 Introduction
Ice is a unique and fascinating material. Much like the rock of the earth’s crust, sea ice can form a crust on the cold oceans of the world. The eastern coastal waters in Canada are prone to extensive ice coverage. Ice will often be the dominant consideration in the design of ships and offshore structures in Canadian waters. There are many Polar and sub-Polar areas of the world where sea ice is also the dominant natural feature and the key design challenge. Consequently, improving our understanding of ice loads is a topic of large practical significance, as well as being a fascinating scientific challenge.
Several studies of ice crushing behavior have been conducted over of the past few decades. Some of the more recent investigations included in situ visual observations using indentors (Joensuu and Riska, 1988, Muhonen 1991, Gagnon, 1998; Fransson et al., 1991, Daley 1994) and a ship hull (Riska et al., 1990) that incorporated windows for viewing the indented ice surface. There have also been test apparatus that allowed viewing of the ice/indentor interface through the ice samples (Gagnon, 1994a; Gagnon and Mølgaard, 1991). These have lead to significant new insights into the ice crushing process. Numerical contact process models based on available visual
observations have been developed (Daley 1991, Daley et al. 1996). Further developments of these models is one of the continuing aims of this experimental work.
The present study incorporates a similar concept to that of Wilson (1999), except that the strain rate is much higher, and is in the range associated with ice crushing rather than plastic
deformation. The loads are much higher and the apparatus is correspondingly stronger. Experiments similar to the present ones have been performed by Gagnon (2004).
While much progress has been made in the last 2 decades concerning the processes involved in ice crushing, considerable study remains in order to resolve divergent views that have developed. The importance of observing the ice behavior is, no doubt, a key factor. Here we report on-going development and results from a novel apparatus (Figure 1) designed to permit direct viewing of ice behavior during crushing. The goal for the design was to essentially take a slice of ice and observe its behavior during edge-on crushing as though it were part of a larger piece being crushed. The success of the apparatus until now has been limited because of in-plane fractures that persistently occurred in the ice specimens (Figure 5), with pulverized ice forming on one side of the fracture tending to obscure observations and likely influence the ice behavior (Gagnon and Daley, 2005).
2 Method
and
Apparatus
2.1 Test ApparatusFigure 1a shows a conceptual schematic of the test method. The ice specimen is a 1 cm thick section. The sample is confined between two thick plates (12 cm x 13 cm x 3.8 cm) of transparent Plexiglas. The Plexiglas plates are mounted in a holder (Figure 1b), made from 19 mm thick Aluminum plate, that keeps the Plexiglas and ice specimen in place. The Plexiglas plates are separated by small plastic spacers (1 cm thick) between the plates at the sides. The holder provided confinement to the ice sample at the bottom and at the side edges to a height of 6 cm from the bottom. Notches are cut in the upper portion of the side confining plates (above 6 cm) to allow for lateral escape of crushed ice during the tests. Aluminum braces, with adjustment bolts, hold the plates together. The crushing platen was made of Plexiglas and had dimensions 11 cm height x 10 cm width x 1 cm thickness. The platen had a protrusion off to one side that served as a view port through the platen to the ice/platen contact zone for the regular video camera. When the ice holder was mounted and carefully aligned in the MTS test frame, the crushing platen could snuggly slide between the Plexiglas confining plates to make contact with the exposed edge of the ice sample.
(a) (b)
Figure 1. (a) Conceptual schematic of the ice crushing test method. (b) Details of the ice holder.
2.2 Pressure Sensor
A novel pressure sensor was used to measure the pressure at the ice/platen interface (Figure 2). It consisted of a transparent strip of Plexiglas 10 cm long x 1 cm width x 4 mm thickness. The bottom surface of the strip was flat and polished. The top surface was sanded and polished to have a slightly convex shape (approximately 0.45 m radius of curvature) laterally along its whole length (Figure 2b). A load/pressure applied to the bottom of the strip caused it to press against the bottom face of the crushing platen. This leads to some elastic flattening of the curved surface and
ice contact zone was not obstructed by the transparent strip but a small amount of ambient light always reflected off the top surface of the strip. At the places where there was contact between the platen and the strip however, the ambient reflected light would be frustrated and the consequent difference in light contrast would make the contact area between the platen and strip visible. The width of the contact was proportional to the pressure on the bottom face of the strip. The sensor had been calibrated prior to the tests by pressing it against a stack of 3 plywood pieces that could deform in such a way as to provide uniform pressure over the contacted area. During an ice crushing test the faint image of the platen/sensor contact area would overlie the view of the ice contact zone and would thereby give a map of pressure along the strip for the whole region of platen/ice contact.
Figure 2. Schematic of the crushing platen (a) and pressure sensor working principle (b) and (c).
Plexiglas Pressure Sensing Strip Plexiglas Crushing Platen (side view) Crushing Platen (front view) Pressure Sensor Pressure No Pressure Increase in contact area Video Camera View Port (a) (b) (c)
2.3 Ice Preparation
Preparation of the ice samples was critical to insure uniform confinement. This was achieved by first cutting the ice with a band saw to roughly the right size and then carefully melting it against a warmed metal plate to a fixed thickness so that it could closely fit into the space between the Plexiglas confining plates. The space between the plates was filled with degassed deionzed water at 0ºC. The ice sample was then carefully inserted into the space, displacing water in so doing until fully inserted. Hence all the space was filled with ice primarily and a small amount of water in any gaps around the edges not filled by the ice. The ice holder, with ice sample and water, was wrapped in an insulating material exposing only the bottom plate and was then laid on a cold metal surface in the cold room at –10ºC. This caused the small amount of water in the holder to freeze from the bottom up enabling a perfect fit of the ice and avoiding stress associated with trapped freezing water. Once the sample was fully frozen in, its exposed top edge was rounded, by melting with a piece of warm metal, to insure that initial contact with the crushing platen occurred at the center. The ice holder and sample were then left to thermalize to –10ºC prior to testing.
For all ten tests conducted the c-axis for the single crystal samples was vertical and in the plane of the ice slab shown in Figure 1. For one experiment the c-axis was oriented at 90 degrees in the plane of the sample from that of the other tests. The crushing platen nominal movement rate was the same for all tests, 10 mm/s. The method of growing the large single crystals has been
described by Gagnon (1994a).
2.4 Digital Imaging
A digital high-speed video camera (Lightning RDTTM see Figure 3) was used to record the ice behavior during the tests. The image capture rate was 500 frames /s and the resolution of the black and white images was 1280 x 1024 pixels. Typical tests resulted in approximately 2000 images, each approximately 750kB (as jpegs), which makes ~1.5 GB per test for the high-speed imagery.
3 Analysis of a Phase 1 Test
3.1 High Speed Images
A series of images, with time stamps, from the video record (Figure 4) show various aspects of Test No.7, a typical well-behaved test. Figure 4 is a reference figure where features of the
apparatus and ice behavior discussed below are indicated for the reader’s convenience. The image in Figure 5 is the same image in Figure 4 at t = 1.086 s. The load record for the test is shown in Figure 6 with markers (open circles) corresponding to the first 7 video images in Figure 3. Note that we show the record for the time up to just beyond the large shatter event in Figure 4, t = 1.788 s. Beyond this time there is no intact ice contact and the platen begins to penetrate so far into the ice holder as to start restricting the escape of pulverized ice through the egress slots cut in the side plates.
In the following description when a feature of the ice behavior is referred to in an image the feature will have occurred exactly at the time stamp on the image or some time before. This is done for presentation purposes because sometimes the feature in question is more clearly visible in a later image than when it first appears.
When the platen makes contact with the ice, load begins to increase (Figure 6). The high-speed video record shows that one of the ice faces usually loses its adherence to the Plexiglas confining plate early in the test. As the loss of adherence progresses a fan-shaped fracture surface appears in the plane of the ice specimen (Figure 4 , t=0.216 s) separating the ice that has adhered to the Plexiglas from the ice that has let go of the Plexiglas. This in-plane fracture continues to extend as the platen moves forward and is tilted about 20-30 degrees from vertical. Linear out-of-plane cracks also begin to appear in a radial pattern centered at the platen/ice contact zone. Eventually the out-of-plane fractures at the sides of the image lead to complete separation of pieces from the ice specimen near the peak in load at around t=0.266 s in the test (just after the first image in Figure 4).
Figure 4. High-speed digital images (with time stamps) from a typical well-behaved test. The ice slab is in the plane of the image and the view is through a Plexiglas plate as shown in Figure 1. Images of the platen/ice contact from the top camera are inset (to scale) on three of the high-speed images. The test was conducted at –10ºC.
Figure 5. Image from the high-speed video record indicating various aspects of the apparatus and ice behavior. The image is the same as that shown in Figure 4, at t = 1.086 s.
0 1 2 3 4 5 0 0.2 0.4 0.6 0.8 1 1.2 1.4 1.6 1.8 2 Time (s) Loa d (k N)
Figure 6. Load record for the test shown in Figures 4 and 5 with markers (open circles) corresponding to the first 7 video images in Figure 4.
Apparently the portion of the ice sample on the backside of the large in-plane fracture (relative to the camera), with the face that has lost adherence to the Plexiglas, is more susceptible to fracture-generating stresses. This arises because in-plane lateral confinement is no longer provided by adherence to the Plexiglas or by attachment to the rest of the ice, due to the in-plane fracture. Consequently this ice portion shatters and is pulverized as the platen moves ahead. In the video record the pulverized ice can be seen flowing away to the left and right from the central region of the ice specimen, where the pressure is higher. The remaining ice on the front side of the in-plane
fracture stays relatively intact however and as the platen moves further the size of the intact region, visible through the view port on the edge of the crushing platen (Figure 1), increases (Figure 4, insets at t = 0.216 and 0.700 s). The increase in size of the intact contact area with penetration is a reflection of the shape of the intact ice segment created when the in-plane fracture occurred. As discussed below the record from the pressure sensor indicates that the pulverized ice provides a varying degree of confinement that probably helps the intact ice remain in its
undamaged state.
During the time t = 0.25 - 0.48 s in the test spalling from the back and sides of the intact ice contact is visible, each spall corresponding to a drop in load in the sawtooth pattern of load. The test then enters a period of seemingly continuous penetration where spalls, if present at all, are very tiny (both video records) and the load record is relatively smooth. At t = 0.95 s the
pronounced spall/load drop activity resumes. The process of spalling, and consequent shaping of the intact ice contact, is illustrated at t = 1.276 s in Figure 4 where the image, and inset image, show spalls at the sides of the central intact ice. Smaller spall events continue and, due to the broading shape of the impinging intact ice, the area of contact with intact ice increases (Figure 4, t = 1.740 s) until eventually the load, and contact area on intact ice, reach high values and a large portion of the remaining intact ice completely shatters at around t = 1.77 s (Figure 4, t = 1.788 s). Following that, the load record becomes relatively smooth again and steadily increasing because the platen penetration into the ice holder begins to restrict the flow of ice debris out to the side exit notches.
While the shattered and pulverized ice is removed from the contact zone by simply flowing away, a dramatically different mechanism accounts for the removal of intact ice at the ice/platen contact, namely melting. This is evident in the video record that shows a thin layer of liquid extruding from between the platen and ice interface (Figures 4 and 5). The liquid aspect of the layer is evident in that it can be seen wetting the pulverized material adjacent to the sides and behind the intact ice. The liquid can also be seen flowing from between the ice and the platen into the narrow gap between the crushing platen and the Plexiglas plate in the plane of the image (Figures 4 and 5), where it then refreezes. Similar observations were made by Gagnon (2004) during the first series of tests using the same ice holder with a metal crushing platen.
It is interesting that there are occasions in the tests when ice-ice contact occurs and the same process of liquid generation at the contact is evident, along with spalling behaviour. This was visible near the end of the test under consideration some time after the shattering of the large portion of intact ice (Figure 4, t = 2.658 s). One of the pieces left over from the shatter event remains in contact with the crushing platen but is sliding to the left as it impinges on some remaining intact ice that contacts it from below. Wetting of surrounding material at the contact region is evident, as are some spalls from the upper ice piece.
The relative movement of the platen against the ice is continuous for a portion of the record shown (t = 0.5 - 0.8 s), that is, at the nominal test rate of 0.010 m/s. In other time segments, where spalls break away from the intact ice/platen contact area that cause abrupt substantial load drops to occur (e.g. t = 0.29 -0.48 s and t = 0.96 -1.75 s), the penetration rate at each load drop is momentarily much higher due to the release of elastic stress in the system. The high-speed video record shows that all abrupt drops in load seen in the load record are caused by spalls either at the
was caused by the spall at the left shown at time t = 1.276 s (Figure 4).
Due to the high resolution of the digital images, and the close-up view, we can estimate directly from the high-speed video images the compliance of the ice/apparatus system, and the rate of penetration during the load drops induced by the spall events. Using the large load drop at t = 1.25 s the video record indicated that during the ascending portion of the sawtooth approximately 0.16 mm melted off the top of the intact ice as the load increased by 2.783 kN. The corresponding actuator displacement was 0.46 mm. Hence the elastic strain of the ice/apparatus system was 0.46-0.16 mm = 0.30 mm for a change in load of 2.783 kN. This yields a compliance of 1.07x10⁻⁷ m/N. On the sharp descending side of the sawtooth the load dropped by about 3.44 kN in about 0.3 ms. Hence, using the compliance, we see that the platen moved against the ice 3.68x10⁻⁴ m in 0.3 ms, that is, at a rate at ~ 1.23 m/s during the load drop, that is, over 100 times the nominal penetration rate! Alternatively the penetration at the load drop can be measured off the images to yield a similar penetration rate.
We attach significance to spalling because it is known to be a major factor in the behavior of ice impact and indentation. The characteristic sawtooth pattern in load records from ice indentation tests (Michel and Blanchet, 1983; Evans et al., 1984; Määttänen, 1983; Timco and Jordaan, 1988; Sohdi and Morris, 1984; Joensuu and Riska, 1988, Frederking et al., 1990), and shape evolution of the ice contact, stems from spalling at the high pressure ice/indentor contact region (Gagnon, 1999). Numerical simulations with just spalling (Daley 1991) and spalling with granular extrusion (Daley, Tuhkuri and Riska, 1996) support the spalling explanation for the sawtooth pattern.
3.2 Pressure Measurement
The novel pressure sensor provided an intriguing record of pressure distribution over the contact area for the duration of tests. Space permits only a cursory discussion. Some general
characteristics of the ice behaviour can be summarized as follows. Any time that intact ice spanned all or most of the sensor width (Figure 7, center of bottom image), the sensor would contact the full thickness of the platen, i.e. it ‘maxed out’, indicating an average pressure of at least 30 MPa. On the other hand the pressure could vary considerably when the sensor was over pulverized ice. For example, when pulverized ice lay on top of intact ice the pressure increased as the pulverized ice thickness decreased with the upward movement of the intact ice. Also,
pulverized ice pressure was generally less at the sides of the contact zone than in the center (e.g. right side of images in Figure 7). A related observation, was that pulverized ice debris would always flow from regions where the sensor indicated higher pressure to regions of lower pressure.
Figure 7. Three images from Test No. 1 showing pressure distribution overlying the ice contact. Sensor contact with the platen is outlined. Intact ice (dark) is labeled while the rest of the view is pulverized ice. The height of each image is the thickness of the platen, 1 cm.
3.3 Wetting Process
Another factor that seemed to affect the pressure in pulverized ice was its degree of wetness from liquid produced in high-pressure intact ice zones. Images from Test No. 1 (Figure 7) illustrate this phenomenon. It was also observed in two other well-behaved tests that showed intact ice at the beginning and throughout a substantial part of the test. In these tests shortly after contact of the platen with the ice was first made there would be a thin area of intact ice visible against the Plexiglas side plate facing the high speed camera (Figure 6, top image). The rest of the contact was pulverized ice (top image). The average pressure across the mixed material contact was maximum, that is, at least 30 MPa, because the contact between the sensor and the crushing platen spanned the full width of the sensor, implying at least 30 MPa for the pulverized ice and intact ice at that time. With further platen penetration, however, the intact ice thickness (its height in the middle image) increased because it was wedge-shaped, as mentioned above, but the pressure sensor indicated a lower average pressure across the width of the sensor (left of middle image). This implied that the pressure on the pulverized ice had diminished considerably (to around 1 MPa) during that time interval since the contact thickness of the intact ice was increasing, and the pressure on intact ice was known to be always at least 30 MPa. We speculate that the marked change in pressure (softening) in the pulverized ice was due to the wetting and saturation that occurred from liquid produced at the high-pressure intact ice / platen contact zone, as seen in the video records.
The melting process has been observed before and explained in detail (Gagnon and Mølgaard, 1991; Gagnon 1994a, 1994b; Gagnon and Sinha, 1991). In the region of high pressure contact
1859), or one that is produced by pressure melting, starts to flow because of the extreme pressure. The viscous flow of the liquid generates heat and additional melting occurs immediately since the liquid layer is in direct contact with ice. The process can happen at relatively slow rates, such as the continuous crushing rate seen in the present load record and also at much faster rates, such as occurs during a load drops in the record where the pressure is momentarily higher.
In summary we note the following similarities between previous tests and the present ones. 1. Regions of intact ice exist where the pressure is high at the ice/platen interface. 2. Melting, and flow of the melt in a thin layer at the high-pressure contact interface occurs. 3. Rapid relative displacement of the platen/ice occurs during load drops. This is caused by spalling at the intact ice/platen interface. Consequently much higher rates of melting and liquid flow occur at the load drops than at other times during the crushing tests.
It is interesting that much more spalling / load drop behaviour, typical in ice indentation tests, occurred in this test series in comparison to the first test series Gagnon (2004) where relatively little occurred. This is likely due to the greater compliance of the Plexiglas crushing platen (and pressure sensor) in comparison to the metal platen used before. The mechanism responsible for the majority of the energy dissipation, however, is the same in the present and previous studies, namely melting and viscous flow of melt (Gagnon, 1999).
4 Phase 2 Tests
In an attempt to control the in-plane cracking, several changes were made to the apparatus, and the test setup. The changes included tightening the bolts holding the sample and shaping the ice sample to lessen the magnitude of the first lad peak. It has become obvious that these changes were not sufficient to control the in-plane cracking. The results of the phase 2 tests are presented here.
Figure 8. Two high-speed digital images from a phase 2 test with the original apparatus. The ice slab is in the plane of the image and the view is through a Plexiglas plate as shown in Figure 1. Images of the platen/ice contact from the top camera are inset (to scale) on the high-speed images. Fairly intact ice is visible in the area subscribed from the base of the inset images up to the white line. Similarly the pressure sensor contact is the area subscribed from the bottom of the inset images up to the black line. The test was conducted at –10ºC, where the crushing platen moved at a rate of 10 mm/s.
The test was conducted at –10ºC with the crushing platen moving at a nominal speed of 10 mm/s. Figure 8 shows two images from the high-speed video record. Figure 9 shows the corresponding portion of the load data with the points at which the images were acquired. Hence the load shows a load drop event had occurred between the two images due to a spall in the region of contact. Figure 8 shows inset images (correctly positioned and to scale) from the downward viewing regular video camera of the contact region between the ice and the platen. While the ice has some cracks in it, it remains largely intact in the region of contact. This is evident from the transparency of the ice in the high-speed video images and also from the downward looking images, where intact ice shows up dark (between the base and the white line) and pulverized ice is usually lighter. Overlain on the inset images are the contact areas for the pressure sensor (the area between the base of the image and dark line). We see that the intact ice spans close to the full width of the ice, and that the pressure on the ice where the span is thickest spans the full width, i.e. at least 30 MPa (Gagnon and Daley, 2005). If we take the area of the intact ice and the
material, where the pressure is lower, mostly out of view. Gagnon (2004) has described the method whereby ice is removed from the intact zones, i.e. through melting as a result of heat generation in the flow of a thin layer of liquid under high pressure. Spalling occurs both at the sides of the intact zone, and also at the lateral edges of the intact ice. Each spall leads to a load drop, large or small, depending on the size of the spall. The production of liquid and wetting of surrounding pulverized ice was observed here as in previous experiments.
Figure 9. Load record for the test shown in Figure 8 with markers (open circles) corresponding to the two images. The images and makers are in sequence from left to right.
The vertical compliance of the ice/apparatus system has been determined (Gagnon and Daley, 2005) so that the actual movement of the platen towards the ice during a load drop can be
calculated. On the sharp descending side of the sawtooth between the image markers in Figure 9 the load dropped by about 5.8 kN in about 0.35 ms. Hence, using the compliance (1.07x10⁻⁷ m/N), we see that the platen moved against the ice 6.20x10⁻⁴ m in 0.35 ms, that is, at a rate at ~ 1.77 m/s during the load drop, 177 times the nominal penetration rate! Alternatively the
5 ELIMINATION OF IN-PLANE FRACTURES
Various means were tried in this test series to eliminate the in-plane fractures. Different shapes for the top of the ice were employed, a semi-cylindrical platen head was tried, a test was run at a higher temperature of –6ºC, and a test run at a slower nominal indentor speed, 5 mm/s. No scenario worked to effect, however close scrutiny of the ice-holder apparatus showed evidence of considerable lateral compliance in the space filled by the ice. Consequently some compliance tests were conducted with the apparatus where the space between the Plexiglas plates was filled with several sheets of rubber instead of ice and load was applied with the platen inserted between the plates to create a fairly uniform pressure between the plates. The lateral compliance of the apparatus was measured and it was evident that the aluminum bars and Plexiglas were bending and bulging outward to a considerable degree that could not be accommodated by the ice without causing fractures. Figure 10 shows the original ice holder with a sketch of the portion modeled in the finite element model. The symmetry of the system allowed for a relatively simple finite element model.
A first finite element model showed a similar degree of deformation as was found in the compliance test (Figure 11). This explained why there were times during some crushing tests where the ice slab would lose contact with the Plexiglas in places, that is, a small gap appeared between the ice slab and the deformed Plexiglas.
Figure 10. Original ice-holder apparatus shown on left with portion modeled by finite element shown on the right.
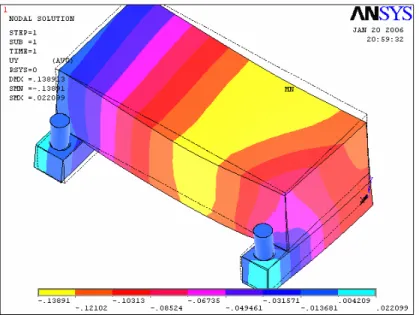
Figure 11. Finite element model of the original ice-holder apparatus showing deformation of the aluminum bracing bars and the Plexiglas plates in response to a uniformly applied pressure to the lower half of the inner surface of the Plexiglas plates. The numbers on the color scheme are millimeters. The maximum deflection is 0.139mm
To eliminate the bending of the bars, and minimize bulging of the Plexiglas, a much more rigid design was used incorporating thick steel plates, with relatively small viewing portals and more securing bolts, to constrain to Plexiglas, as shown in Figure 14, center. This practically eliminated bending and bulging of the outer faces of the Plexiglas plates, relative to what it had been before. When subsequent ice crushing experiments were conducted, however, the ice behavior had improved somewhat but the in-plane fractures still occurred. Analysis of the finite element results (see Figure 12) showed that even though the steel plates eliminated the former bending and bulging of the outer Plexiglas surfaces, the Plexiglas itself would still deform by compression as a result of the applied inner pressure. This was an inherent characteristic of the Plexiglas which could only be resolved by using a material with a substantially higher modulus of elasticity.
Figure 12 Finite element model with heavy ring steel confinement. The maximum deflection is 0.028 mm.
To test the hypothesis the Plexiglas plates were replaced by solid aluminum plates of the same dimensions (Figure 14, bottom) and two more ice crushing tests were conducted. Of course the aluminum does not provide a view of the ice from the side, however, the downward looking view through the crushing platen could still show the ice behavior. The high-speed camera was now used for the downward view and it clearly revealed that the ice was behaving as desired in the original intent of the apparatus. No in-plane fractures could be discerned and virtually all spalling activity, and subsequent movement of material, was along the axis of the slot between the plates, rather than laterally as was the case prior to using the aluminum plates.
Figure 13 Finite element model with heavy ring steel confinement, and with Aluminum in place of the Plexiglas. The maximum deflection is 0.008 mm
Figure 14. Evolution of the ice-holder apparatus from the original version (top), to the stiffened version with Plexiglas plates (center), to the present version where the Plexiglas plates have been replaced by aluminum plates (bottom).
Figure 15 shows the load record for the first test using the stiffened apparatus. Figure 16 shows images from the high-speed video as viewed looking down through the crushing platen that are associated with the points indicated on the load record. The images are somewhat grainy because they required enhancement since the lighting was inadequate during the test. The first image shows an example of a hard zone spanning the full width of the slot. The area of the zone, assuming a pressure of 30 MPa, indicates it supported about 50% of the load. The second and third images show another hard zone spanning the slot prior to and after a spall event that considerably reduces the size of the intact hard zone. The zone before the load drop supports about 10 kN, ~75% of the load. After the load drop the reduced zone supports around 2 kN, ~25% of the load. The load distribution between hard zones and pulverized ice clearly varies considerably throughout these tests. The load drop associated with this spall event is seen on the load record and corresponds to about 9 kN, that is, between the peak and the bottom of the load drop. Hence in this case the change in the size of the hard zone due to the spall accounts for most of the change in load at the load drop. The hard zone in the third image was the last hard zone appearing at the end of the test. A photo was taken after the test with the ice still inside the ice-holder to confirm the integrity of the ice, and to verify that it spanned the width of the slot (Figure 17).
Figure 15. Load record for the test shown in Figure 16 with markers (open circles) corresponding to the three images. The images and makers are in sequence from left to right.
Figure 18 shows the load record for the second test with the rigid apparatus. Figure 19 shows five images from the high-speed video associated with the test, where the images are indicated on the load record. The lighting was better for this test so the images required less enhancing than the first test. The first image shows a fairly large zone, where the load supported is around 2.6 kN (~33% of the total load), again assuming a pressure of 30 MPa over its area. The rest of the load would have been supported by the remaining intact ice in view and likely more pulverized and
hard zones each before and after a spall breaks away from it. These images show hard zone areas that are relatively small. Hence they support relatively small loads compared to the total load, thus indicating that the greater majority of load is supported by the pulverized ice, and possible intact and pulverized ice that is out of view. The images nevertheless show spalling from the hard zones at the load drops. The load drops associated with the spalling events are indicated on the load record, i.e. the drop between Images 2 and 3, and between Images 4 and 5. Following similar calculations as in the first test above we can determine that about 25% of the first load drop is associated with the change in area of the hard zone, assuming the pressure of 30 MPa as before. Hardly any of the second load drop can be associated with the change in area of the hard zone since in this case the spall caused a shape change to the hard zone but not much of a change in area because the right side of the hard zone increased in size as the platen moved against the ice during the load drop.
Figure 16. Three high-speed video images as viewed through the crushing platen showing ice contact during the first test. The images are ordered according to the points indicated on the load record in Figure 15. The intact hard zones (dark areas) are outlined and lighter areas are generally pulverized ice. The width of each image is 1 cm. The images are grainy due to enhancement required because of inadequate light levels during the test.
Figure 17. View of an intact hard zone in the ice-holder following the test shown in Figure 16. The hard zone corresponds to the last image in Figure 8.
All of the discussion above should be taken for the most part as qualitative since there was not a full view of the complete contact area between the platen and ice in these tests, hence
there was pulverized ice out of the view, and quite likely even hard zones areas. The exercise was intended more to demonstrate that intact hard zones of ice did span the space between the platens as evidence that no in-plane fractures had occurred in the ice. The images of the ice crushing presented above require a fair amount of explanation due to the somewhat complex nature of the ice behavior during crushing and limitations of printed media. The images are much easier to interpret when one views the actual video records and can see the spalling behavior and flow of material away from higher pressure zones as the crushing experiment progresses.
We note that spalling in the former apparatus, as shown in the test in Figure 3, occurred routinely at the lateral edge of the intact zone, rather than at the sides of the hard zones in the slot as in the latter tests. This also confirms that the stiffened apparatus achieves the desired goal.
Figure 18. Load record for the test shown in Figure 19 with markers (open circles) corresponding to the five images. The images and makers are in sequence from left to right.
Figure 19. Five high-speed video images as viewed through the crushing platen showing ice contact during the second test. The images are ordered from left to right according to the points indicated on the load record in Figure 18. The intact hard zones (dark areas) are outlined and lighter areas are generally pulverized ice. The bright areas are light reflections from the lighting system. The dark band in the middle of the bright zone near the top of the images is the pressure sensor contact width. The width of each image is 1 cm.
Following the last experiment the apparatus was dismantled to reveal the ice that remained. As expected the ice was intact in the hard zone region and no in-plane fractures were visible (Figure 20).
Figure 20. Photos of ice inside the partially dismantled ice-holder following the second test. The dark area at the top of the ice in the left image is an intact hard zone, with intact ice below it, free of in-plane fractures. Pulverized ice appears white. The right image shows the other side of the same ice, rotated 180o.
These outcomes constitute a significant advancement for the apparatus. In the next incarnation the apparatus will have solid glass plates instead of the aluminum plates. The glass has a stiffness of about 50% of the aluminum whereas the Plexiglas was around 20 times more compliant. Hence the solid glass will have the necessary stiffness to prevent the in-plane fractures and provide the transparency to enable the all-important visual observations.
6 CONCLUSIONS
A new type of ice crushing experiment has been conducted that enables dual-axis viewing perspectives of the ice behavior. A new pressure sensor, with a promising future, has yielded intriguing information about pressure distribution at the ice contact area.
The important phenomena of melting, due to viscous flow of a thin layer of high-pressure liquid at the ice/structure interface, and spalling at the ice contact zone have been observed in
unprecedented detail. As in previous crushing experiments, high-speed video has proven to be a very useful data acquisition system and an invaluable tool for interpretation of the results.
It would be very instructive to conduct similar tests at larger scales and under more uniform confinement scenarios.
The design of a unique apparatus for studying ice crushing processes was modified to eliminate in-plane fractures that previously occurred in the ice during crushing experiments. The problem was shown to be associated with the compliance of the apparatus. By stiffening the ice-holder and replacing the ‘soft’ Plexiglas plates with aluminum plates the problem was solved. Hence, the next version of the apparatus will have hard glass plates in place of the aluminum plates, with a much higher elastic modulus than the former Plexiglas plates, to provide visual access to the ice behavior.
7 References
1. Daley, C. G., “Ice Edge Contact - A Brittle Failure Process Model” Acta Polytechnica Scandinavica, Mechanical Engineering Series No. 100, Helsinki 1991, 92 pp. Published by the Finnish Academy of Technology
2. Daley, C.G., “MSI Ice Loads Data - Compilation of Medium Scale Ice Indentation Test Results and Comparison to ASPPR”, Report by Daley R&E to National Research Council, March 1994, Transport Canada Publication Number TP 12151E.
3. Daley, C.G., Tuhkuri, J., and Riska, K., "Discrete Chaotic Ice Failure Model Incorporating Extrusion Effects", Report submited to the National Energy Board by Daley R&E and the Helsinki University of Technology, Nov., 1996.
4. Fransson, L., Olofsson, T. and Sandkvist, J. 1991. Observations of the Failure Process in Ice Blocks Crushed by a Flat Indentor. Proceedings of the 11th International Conference on Port and Ocean Engineering Under Arctic Conditions, St. John's, Canada, Vol. 1, 501-514.
5. Gagnon, R. (2004), “Side-Viewing High-Speed Video Observations of Ice Crushing”, Proceedings of IAHR 2004, St. Petersburg, Russia, Vol. 2, 289-298.
6. Gagnon, R.E. 1994a. Generation of Melt During Crushing Experiments on Freshwater Ice. Cold Regions Science and Technology, Vol. 22, No. 4, 385-398.
7. Gagnon, R.E. 1994b. Melt Layer Thickness Measurements During Crushing Experiments on Freshwater Ice. Journal of Glaciology, 1994, Vol. 40, No. 134, 119-124.
8. Gagnon, R.E. 1998. Analysis of Visual Data from Medium Scale Indentation Experiments at Hobson’s Choice Ice Island. Cold Regions Science and Technology, Vol. 28, 45-58. 9. Gagnon, R.E. 1999. Consistent Observations of Ice Crushing in Laboratory Tests and
Field Experiments Covering Three Orders of Magnitude in Scale. Proceedings of the 15th International Conference on Port and Ocean Engineering under Arctic Conditions, POAC-99, Helsinki, Finland, Vol. 2, 858-869.
10. Gagnon, R.E. and Daley, C. 2005. “Dual-axis video observations of ice crushing utilizing high-speed video for one perspective”, Proceedings of POAC 2005, Potsdam, New York, Vol. 1, 271-282.
11. Gagnon, R.E. and Mølgaard, J. 1991. Evidence for pressure melting and heat generation by viscous flow of liquid in indentation and impact experiments on ice. Proceedings of the
Glaciol., 15: 254-260.
12. Gagnon, R.E. and Sinha, N.K. 1991. Energy Dissipation Through Melting in Large Scale Indentation Experiments on Multi-Year Sea Ice. Proc. of the 10th International
Conference on Offshore Mechanics and Arctic Engineering, Stavanger, Vol. IV, Arctic/Polar Technology, 157-161.
13. Joensuu, A., Riska, K., "Jään ja Rakenteen Välinen Kosketus"(Contact Between Ice and Structure) Helsinki University of Technology, Laboratory of Naval Architecture and Marine Engineering, Report M-88, Otaniemi, 1988. (in Finnish)
14. Muhonen, A., “Medium Scale Indentation Tests - PVDF pressure measurements, ice face measurements and Interpretation of crushing video”, Client Report by Helsinki University of Technology, Ship Laboratory, Feb.20, 1991.
15. Riska, K., Rantala, H. and Joensuu, A. 1990. Full scale observations of ship-ice contact. Laboratory of Naval Architecture and Marine Engineering, Helsinki University of Technology, Report M-97.
16. Wilson, C.J. 1999. Downloadable movie from the website of the School of Earth Sciences - The University of Melbourne - Australia. Copyright Notice - The University of
Appendix – Ice Crushing Images- Test 10
These images were taken at 500 frame/sec. Shown below is every 10th image, starting from initial contact to the end of penetration.