• Aucun résultat trouvé

Differences in elemental composition of tailings, soils, and plant tissues following five decades of native plant colonization on a gold mine site in Northwestern Québec

N/A
N/A
Protected

Academic year: 2021

Partager "Differences in elemental composition of tailings, soils, and plant tissues following five decades of native plant colonization on a gold mine site in Northwestern Québec"

Copied!
5
0
0

Texte intégral

(1)

density classes (VDC). The different letters represent a significant difference after unbalanced ANOVA test followed by Tukey’s multicomparison test. Dotted line: the maximum elemental concentration allowed by the Government of Québec for sites destined for industrial use (MERN, 2016). Error bars represent standard error of the mean (SEM). 

1 2 3 4 5 6 1 10 100 VDC p pm (l og 10 ) A. Sodium a a a a a a 1 2 3 4 5 6 1 10 100 1000 10000 VDC p p m (l o g10 ) B. Magnesium a ab ab ab b ab 1 2 3 4 5 6 1 10 100 1000 10000 VDC p p m (l o g10 ) C. Aluminum a a a a a a 1 2 3 4 5 6 1 10 100 VDC p pm (l og 10 ) D. Titanium ab ac b abc c c 1 2 3 4 5 6 1 10 100 VDC p p m (l o g10 ) E. Vanadium a ab b ab c abc 1 2 3 4 5 6 1 10 100 VDC p p m (l o g10 ) F. Chromium 800 ppm a a a ab b ab VDC VDC VDC VDC VDC VDC ug .g -1(lo g10 ) ug .g -1(lo g10 ) ug .g -1(lo g10 ) ug .g -1(lo g10 ) ug .g -1(lo g10 ) ug .g -1(lo g10 ) 800ug.g-1

(2)

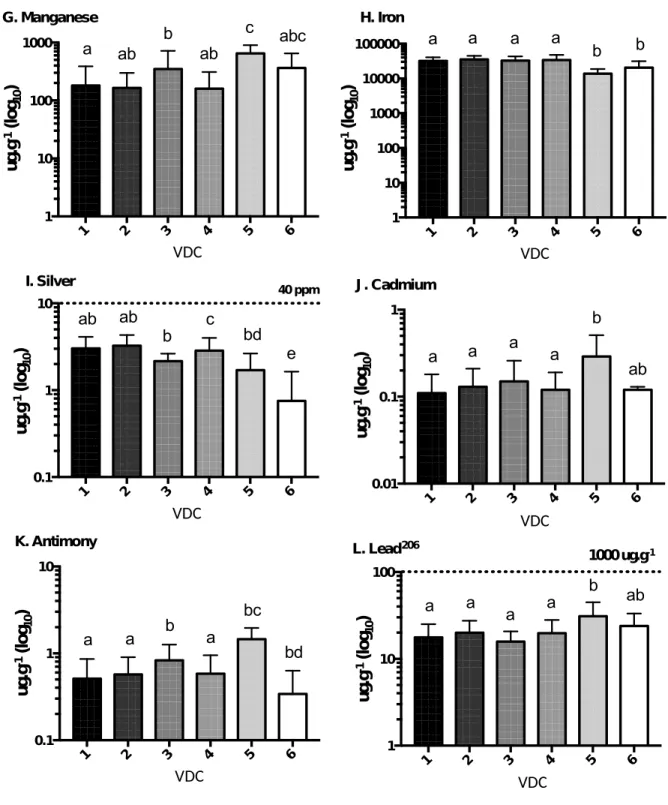
Fig. S1. Continued. 1 2 3 4 5 6 1 10 100 1000 VDC p p m (l o g10 ) G. Manganese a ab b ab c abc 1 2 3 4 5 6 1 10 100 1000 10000 100000 VDC p p m (l o g10 ) H. Iron a a a a b b 1 2 3 4 5 6 0.1 1 10 VDC p p m (l o g10 ) I. Silver 40 ppm ab ab b c bd e 1 2 3 4 5 6 0.01 0.1 1 VDC p p m (l o g10 ) J . Cadmium a a a a b ab 1 2 3 4 5 6 0.1 1 10 VDC p p m (l o g10 ) K. Antimony a a b a bc bd 1 2 3 4 5 6 1 10 100 VDC p p m (l o g10 ) L. Lead206 1000 ppm a a a a b ab VDC VDC VDC VDC VDC VDC ug .g -1(lo g10 ) ug .g -1(lo g10 ) ug .g -1(lo g10 ) ug .g -1(lo g10 ) ug .g -1 (lo g10 ) ug .g -1 (lo g10 ) 1000ug.g-1

(3)

different vegetation density classes (VDC). The different letters represent a significant difference after an unbalanced ANOVA test followed by Tukey’s multicomparison test. ANOVA test were performed on the same species group. Dotted line: the maximum elemental concentration allowed by the Government of Québec for sites destined for industrial use (MERN, 2016). Error bars represent standard error of the mean (SEM).

(4)
(5)

Figure

Fig. S1. Continued. 1 2 3 4 5 61101001000 VDCppm (log10)G. Manganeseaabb ab c abc 1 2 3 4 5 6110100100010000100000 VDCppm (log10)H
Fig. S2. Continued.

Références

Documents relatifs

The quantitative data show clearly that for the lowest holding time the average chemical composition of the precipitates evidences a partitioning of all elements, but

Figure 7.9 – Mean Cu contents and isotope ratios in bulk soils, soil solutions, roots and leaves of different soil modalities. The other soil modality leaving the trend for

Since we applied this algorithm on Backward Stochastic Differential Equations in CMCLDI, we show here its strength for the simulation of risk measures and optimal stopping

Except in pubertal boys, the correlation of foot-to-foot BIA measurements of fat mass with anthropometric measurements of fat mass, or plasma leptin were similar in adults

Aerodynamic and Structural Optimisation of Powerplant Integration under the Wing of a Transonic Transport Aircraft..

Genetic diversity and genetic relationships in invasive Corbicula clams estimated through a Discriminant Analysis of Principal Components (Figure 5) based on multilocus genotypes from

We do not think this is a FIP bias effect (the lines from the hotter S ions, S iii – iv are consistent with the lines from other ions formed at similar temperatures), but it is

Wilson and Hartnett (1998) studied AM fun- gal colonization of 85 prairie plant species in a greenhouse experiment and found that AM fungal colonization of an- nual and biennial