Publisher’s version / Version de l'éditeur:
Optics Express, 18, 11, pp. 11483-11494, 2010-05-24
READ THESE TERMS AND CONDITIONS CAREFULLY BEFORE USING THIS WEBSITE. https://nrc-publications.canada.ca/eng/copyright
Vous avez des questions? Nous pouvons vous aider. Pour communiquer directement avec un auteur, consultez la
première page de la revue dans laquelle son article a été publié afin de trouver ses coordonnées. Si vous n’arrivez
Questions? Contact the NRC Publications Archive team at
[email protected]. If you wish to email the authors directly, please see the first page of the publication for their contact information.
NRC Publications Archive
Archives des publications du CNRC
This publication could be one of several versions: author’s original, accepted manuscript or the publisher’s version. / La version de cette publication peut être l’une des suivantes : la version prépublication de l’auteur, la version acceptée du manuscrit ou la version de l’éditeur.
For the publisher’s version, please access the DOI link below./ Pour consulter la version de l’éditeur, utilisez le lien DOI ci-dessous.
https://doi.org/10.1364/OE.18.011483
Access and use of this website and the material on it are subject to the Terms and Conditions set forth at
Vibrational sum frequency generation spectroscopy using inverted
visible pulses
Weeraman, Champika; Mitchell, Steven A.; Lausten, Rune; Johnston, Linda
J.; Stolow, Albert
https://publications-cnrc.canada.ca/fra/droits
L’accès à ce site Web et l’utilisation de son contenu sont assujettis aux conditions présentées dans le site LISEZ CES CONDITIONS ATTENTIVEMENT AVANT D’UTILISER CE SITE WEB.
NRC Publications Record / Notice d'Archives des publications de CNRC:
https://nrc-publications.canada.ca/eng/view/object/?id=42a2f893-a096-4eb6-a967-9465d0e6be58 https://publications-cnrc.canada.ca/fra/voir/objet/?id=42a2f893-a096-4eb6-a967-9465d0e6be58Vibrational sum frequency generation
spectroscopy using inverted visible pulses
Champika Weeraman, Steven A. Mitchell, Rune Lausten, Linda J. Johnston and Albert Stolow*
Steacie Institute for Molecular Sciences, National Research Council, 100 Sussex Drive, Ottawa, Ontario K1A 0R6 Canada.
Abstract: We present a broadband vibrational sum frequency generation
(BB-VSFG) scheme using a novel ps visible pulse shape. We generate the fs IR pulse via standard procedures and simultaneously generate an ‘inverted’ time-asymmetric narrowband ps visible pulse via second harmonic generation in the pump depletion regime using a very long nonlinear crystal which has high group velocity mismatch (LiNbO3). The
‘inverted’ ps pulse shape minimally samples the instantaneous nonresonant response but maximally samples the resonant response, maintaining high spectral resolution. We experimentally demonstrate this scheme, presenting SFG spectra of canonical organic monolayer systems in the C-H stretch region (2800-3000 cm−1).
2010 Optical Society of America
OCIS codes: (240.4350) Nonlinear optics at surfaces; (300.6340) Spectroscopy, infrared. References and links
1. P. Guyot-Sionnest, R. Superfine, J. H. Hunt, and Y. R. Shen, “Vibrational spectroscopy of a silane monolayer at air/solid and liquid/solid interfaces using sum-frequency generation,” Chem. Phys. Lett. 144(1), 1–5 (1988). 2. M. A. Belkin, T. A. Kulakov, K. H. Ernst, L. Yan, and Y. R. Shen, “Sum-frequency vibrational spectroscopy on
chiral liquids: a novel technique to probe molecular chirality,” Phys. Rev. Lett. 85(21), 4474–4477 (2000). 3. J. C. Conboy, M. C. Messmer, and G. L. Richmond, “Investigation of surfactant conformation and order at the
liquid-liquid interface by total internal reflection sum-frequency vibrational spectroscopy,” J. Phys. Chem.
100(18), 7617–7622 (1996).
4. L. J. Richter, T. P. Petralli-Mallow, and J. C. Stephenson, “Vibrationally resolved sum-frequency generation with broad-bandwidth infrared pulses,” Opt. Lett. 23(20), 1594–1596 (1998).
5. F. Rotermund, V. Petrov, and F. Noack, “Difference-frequency generation of intense femtosecond pulses in the mid-IR (4-12 mu m) using HgGa2S4 and AgGaS2,” Opt. Commun. 185(1-3), 177–183 (2000).
6. M. K. Reed, and M. K. S. Shepard, “Tunable infrared generation using a femtosecond 250 kHz Ti:sapphire regenerative amplifier,” IEEE J. Quantum Electron. 32(8), 1273–1277 (1996).
7. H. C. Allen, N. N. Casillas-Ituarte, M. R. Sierra-Hernández, X. K. Chen, and C. Y. Tang, “Shedding light on water structure at air-aqueous interfaces: ions, lipids, and hydration,” Phys. Chem. Chem. Phys. 11(27), 5538– 5549 (2009).
8. A. N. Bordenyuk, H. Jayathilake, and A. V. Benderskii, “Coherent vibrational quantum beats as a probe of Langmuir-Blodgett monolayers,” J. Phys. Chem. B 109(33), 15941–15949 (2005).
9. A. Lagutchev, S. A. Hambir, and D. D. Dlott, “Nonresonant background suppression in broadband vibrational sum-frequency generation spectroscopy,” J. Phys. Chem. C 111(37), 13645–13647 (2007).
10. M. Smits, M. Sovago, G. W. H. Wurpel, D. Kim, M. Muller, and M. Bonn, “Polarization-resolved broad-bandwidth sum-frequency generation spectroscopy of monolayer relaxation,” J. Phys. Chem. C 111(25), 8878– 8883 (2007).
11. P. Guyot-Sionnest, “Coherent processes at surfaces: Free-induction decay and photon echo of the Si-H stretching vibration for H/Si(111),” Phys. Rev. Lett. 66(11), 1489–1492 (1991).
12. J. C. Diels, and W. Rudolph, Ultrafast Laser Pulse Phenomena (Academic Press, 1996).
13. J. Comly, and E. Garmire, “Second harmonic generation from short pulses,” Appl. Phys. Lett. 12(1), 7–9 (1968). 14. M. Smits, C. A. de Lange, S. Ullrich, T. Schultz, M. Schmitt, J. G. Underwood, J. P. Shaffer, D. M. Rayner, and
A. Stolow, “Stable kilohertz rate molecular beam laser ablation sources,” Rev. Sci. Instrum. 74(11), 4812–4817 (2003).
15. M. Himmelhaus, F. Eisert, M. Buck, and M. Grunze, “Self-assembly of n-alkanethiol monolayers. A study by IR-visible sum frequency spectroscopy (SFG),” J. Phys. Chem. B 104(3), 576–584 (2000).
16. I. V. Stiopkin, H. D. Jayathilake, A. N. Bordenyuk, and A. V. Benderskii, “Heterodyne-detected vibrational sum frequency generation spectroscopy,” J. Am. Chem. Soc. 130(7), 2271–2275 (2008).
1. Introduction
Vibrational sum frequency generation (VSFG) spectroscopy is a powerful interface-selective spectroscopic tool for the characterization of molecular structure, orientation and dynamics at interfaces and surfaces. Some advantages of VSFG are: (1) the richness of the molecular level information; (2) the ability to perform in situ non-destructive measurements; and (3) access to buried interfaces. A standard method for acquiring SFG spectra is to scan a narrow band IR pulse over the vibrational resonance of interest, in the presence of narrow band visible pulse (nanosecond or picosecond) [1–3]. Alternatively, broadband sum frequency generation (BB-SFG) makes use of femotosecond (fs) broad bandwidth IR pulses (~200-300 cm−1 FWMH) which are sum-mixed with picosecond (ps) narrow band visible pulses at an interface. The resulting SFG signal is typically spectrally dispersed in an imaging spectrometer containing a cooled CCD detector [4]. BB-SFG is a single-shot spectral measurement that requires neither long acquisition times nor the tuning of any lasers wavelengths.
Two key issues in SFG are (i) the spectral resolution and (ii) the contrast with respect to the non-resonant background (NRB). The resolution of BB-SFG is typically limited to a few wavenumbers by the spectral bandwidth of the upconverting ps visible pulse. This, however, is sufficient for many applications. The issue of contrast is very important. The NRB, shown in blue in Fig. 1(a), is due to the instantaneous electronic response contained in the second order electric susceptibility. The resonant response, shown in red in Fig. 1(a), leads to the time-delayed and oscillatory free induction decay (FID) emission. As the NRB is non-resonant but emits dipole radiation in the same direction as the FID response, the NRB interferes spectrally at the detector with the resonant response, leading to a wavelength independent background and distortion of the spectral lineshapes. The former reduces contrast and sensitivity whereas the latter hinders spectral analysis, arguably a chief merit of SFG. It is therefore worthwhile to consider schemes which reduce the electronic response, maintain the required spectral resolution, and maximize the resonant vibrational response. Here we present a new and highly efficient scheme for achieving this, based upon the use of time-asymmetric “inverted” ps pulses, as described in the following.
A typical BB-SFG arrangement is based on amplified fs Ti:Sa pump lasers (P, typically λ = 0.8 m). These are employed for fs optical parametric amplification (OPA), generating broad band near-IR signal (S, 1.1 – 1.6 m) and idler (I, 1.6 – 2.6 m) pulses. In subsequent difference frequency generation (DFG), S and I pulses are mixed in a thin crystal to produce BB fs IR pulses (e.g. λ = 3 m) [5,6]. Using the broad tunability of fs OPAs and available nonlinear optical crystals, very broad tunability of the output BB fs IR is achievable, easily reaching beyond λ = 10 m. The fs pulse durations of these can correspond to typical full bandwidths of ~200-300 cm−1, allowing single-shot coverage of broad IR spectral ranges. The general difficulty in fs BB SFG arrangements is in generating the synchronized narrow band (ps) visible pulses required for upconversion at an interface. One successful approach, albeit complex, was based on the use of a synchronized ps amplifier [7]. Alternatively, an automatically synchronized narrow band visible pulse can be generated via spectral filtering a fraction of the fs Ti:Sa 0.8 m pump pulse used to pump the OPA. However, all spectral filtering schemes are very inefficient: they require high energy input pulses, as typically only a few percent of the total energy is transmitted. Spectral filtering can be done in ways that generate either symmetric or asymmetric narrow band ps pulses. A general time-symmetric scheme is based on the use of 4-f pulse shapers [4] wherein an adjustable slit at the Fourier plane of the shaper is used to select the desired bandwidth. Such an arrangement yields ps pulses of the symmetric sin(ωt)/ωt (i.e. sync function) form, as shown in Fig. 1(b). A general time-asymmetric scheme is based on the use of air-spaced Fabry-Perot étalons [8–10]. If the étalon air-gap d is chosen to be less than the coherence length lc of the pulse, the
transmitted pulse has a smooth time-asymmetric shape, appearing in form as an exponential decay with decay constant equal to the photon cavity lifetime, as shown in Fig. 1(c) [9].
In considering the resolution and contrast of a given BB-SFG scheme, it is helpful to consider a mixed time and frequency domain picture. In general, the BB-SFG spectrum involves a convolution of the FID with the instantaneous NR response and the effective bandwidth of the upconverting ps visible pulse. Due to this, vibrational bands in a SFG spectrum can be broad, asymmetric and frequency-shifted with respect to the molecular response. NRB suppression can be achieved by introducing a time-delay between the fs IR and the ps visible pulses, as demonstrated for the case of time-asymmetric pulses from an étalon [9]. We note, however, that applying a time delay in this case may exclude the initial part of the FID, potentially leading to broad vibrational peaks in the observed SFG spectrum. Here we propose an alternate time-asymmetric pulse shape, one that is the inverse of the étalon pulse shape. As shown in Fig. 1(d), this pulse has an envelope which increases exponentially with time, before being suddenly truncated. Such a visible pulse shape would minimally sample the NR electronic response while maximally sampling the full FID. Here we investigate the use of ‘inverted’ ps visible pulses in BB-SFG, as they have advantages for suppressing the NRB while maintaining high spectral resolution.
We experimentally demonstrate, using only a single fs OPA, a simple and very efficient scheme for generating both the fs BB IR and the synchronized inverted ps visible pulses. This is based on second harmonic generation in long nonlinear crystals (1-2 cm) having a large group velocity mismatch (LiNbO3). It is the interplay between pump depletion and group
velocity mismatch that leads to the formation of the inverted pulse shape. Using time-delayed inverted pulses, we reproduced well known BB-SFG spectra in the C-H stretch region (2800-3000 cm−1) of (i) self-assembled monolayers (SAM) of alkylthiols on gold, (ii) 1-octanol at the air-water interface, and (iii) saturated lipid monolayers on glass. We demonstrate that this scheme yields good signal-to-noise ratios at ~7 cm−1 spectral resolution in relatively short acquisition times.
This paper is structured as follows. In section 2, we present a theoretical analysis of the effects of visible pulse shape (4f, étalon and inverted) and time delay on BB-SFG spectra. A detailed description of experimental setup is provided in section 3. In section 4, we present our experimental SFG spectroscopy results, using the inverted ps pulse shape, for three different interfacial systems.
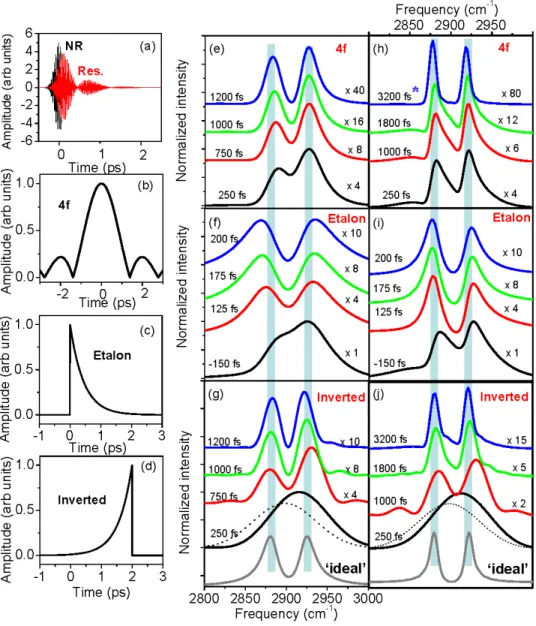
Fig. 1. Schematic representation of time domain pictures for BB-SFG and the effect of ps pulse shape of the SFG spectra. (a) resonant (red) and nonresonant (black) contributions to the oscillating first order polarization P(1)(t) . The ps visible pulse shapes, each with 24 cm−1 linewidth are shown: (b) the symmetric pulse from a 4f pulse shaper; (c) the time-asymmetric pulse shape from a Fabry-Perot étalon; (d) the ‘inverted’ time-time-asymmetric pulse shape obtained via second harmonic generation in a long LiNbO3 crystal. The BB-SFG spectra were calculated for two IR transitions, centered at 2880 cm−1 and 2920 cm−1, in the presence of a large (5 × ) NRB having a phase shift of π/2. The 150 fs IR laser pulse spectrum was centered at 2900 cm−1. The left column, (e), (f) and (g) shows results for a ps visible pulse of 24 cm−1 FWHM and resonance linewidths of 30 cm−1 FWHM. The right column, (h), (i) and (j) shows results for a narrow ps visible pulse of 10 cm−1 FWHM and narrow resonance linewidth of 12 cm−1. The effects of the shaped, delayed ps visible pulse are shown as a function of delay for: the 4f pulse shape in (e) and (h); the etalon pulse shape in (f) and (i); the inverted pulse shape in (g) and (j). The magnification relative to the short time (250 fs) response of the inverted pulse (solid black line in (g) and (j)) are given on the right of each spectrum. It can be seen that the signal levels decreases rapidly as a function of delay. The fs IR pulse spectrum is shown as a dashed line in (g) and (j). For comparison, ‘ideal’ spectra (without NRB) for both computed examples are given in (g) and (j). For discussion, see the text.
2. Theory
The BB-SFG scheme requires narrowband ps visible and fs IR pulses, the former determining the spectral resolution. In a time domain representation of a BB-SFG experiment, the fs IR pulse induces an oscillating time dependent first order polarization
(1) (1) (1) ( ) NR( ) R ( ) P t =P t +P t (1) where (1) ( ) NR
P t is the instantaneous electronic response of the system to the electric field of the IR pulse and is only present during the IR pulse. The second term, (1)
( )
R
P t , the free-induction decay (FID), contains the oscillating vibrational coherences induced by the resonant response of the system and has a decay lifetime related to the inverse linewidths of the IR transitions [8,11]. In a time domain SFG measurement, the envelope of the oscillating coherences can be measured by upconverting the first order polarization with a delayed ultrashort visible pulse. In a frequency domain BB-SFG measurement, it is a ps visible pulse which upconverts the oscillating first order polarization to the second order field (2)
( )
SFG
P t which is subsequently measured as the SFG power spectrum (2)
( )
SFG
P ω in a spectrometer.
In a mixed frequency and time domain representation, BB-SFG can be formulated as follows. The time domain molecular response function is given by [8]
( ) NRexp( NR) ( ) ( ) j jexp( j j )
j
S t′ =A iϕ δ t −iθ t′ BΓ −Γ −t′ iωt′
∑
(2)The first term represents the instantaneous nonresonant contribution, the second the resonant vibrational coherences, assuming a set of homogeneously broadened Lorentzian line
shapes. The factors ANR and ϕ are the amplitude and phase of the nonresonant response, NR
with respect to the vibrational coherence. For the resonant response term, Bj,Γ and j ω are j
the Lorentzian amplitudes, line widths and central frequencies, respectively, of the IR
transitions and θ is the Heaviside step function. The short IR pulse interacts with the system
and induces the first order polarization (1)
( ) P t , (1) ( ) IR( ') ( ') ' P t E t t S t dt +∞ −∞ =
∫
− (3)For the result presented in Fig. 1(a), we assumed that the fs IR pulse has Gaussian duration of 150 fs FWHM and that the material system has two resonant IR transitions spaced by 40 cm−1, each having a Lorentzian lineshapes of 24 cm−1 FWHM. In the radiated field, the instantaneous nonresonant response may be the dominant term, particularly so for metal substrates, less so for dielectric substrates. Therefore, it is critical to suppress the instantaneous nonresonant contribution to the extent possible. NRB suppression can be achieved by applying a time-delay between the fs IR and ps visible pulses. The second order polarization obtained by upconversion of the first order polarization by the time-delayed ps visible pulse is given by
(2) (1)
( , ) vis( ) ( )
P tτ ∝E t−τ P t (4) where τ is the time-delay between IR and visible pulses. The second order nonlinear polarization (2)
( , )
P tτ can be Fourier transformed to (2)
( , )
P ω τ and the power spectrum of the SFG signal is given by
2 2 (2) (2) ( , ) ( , ) exp( ) I P ω τ P tτ i t dtω +∞ −∞ ∝ =
∫
(5)In the following, we will compare these SFG power spectra as a function of time-delay for three different ps visible pulse shapes; the 4f, étalon and inverted pulse shapes and for two different ps laser spectral resolutions. For the SFG simulations, we considered the case of two
Lorentzian transitions (central frequencies of 2880 cm−1 and 2920 cm−1) having the same
amplitude and linewidths. These Lorentzian linewidths are 30 cm−1 FWHM for (e)-(g) and 12
cm−1 FWHM for (h)-(j). The fs IR pulse is assumed to be a Gaussian (150 fs FWHM)
centered at 2900 cm−1 and the spectral bandwidths of the shaped ps visible were taken to be
24 cm−1 FWHM for (e)-(g) and 10 cm−1 for (h)-(j). In order to emphasize the dependence of
NRB suppression on the ps pulse shape, we have introduced a large nonresonant contribution
(ANR = 5) with a relative phase shift ϕ of NR π/2. We show the commonly used ps visible pulse
shapes for 24 cm−1 bandwidth: the symmetric 4f pulse shape, Fig. 1(b), and the
asymmetric étalon pulse shape, Fig. 1(c). The computed SFG spectra as a function of
time-delay between the fs IR and the 24 cm−1 visible pulses for the 4f and étalon pulse shapes are
given in Figs. 1(e) and 1(f), respectively. The general convention used here, and in the following section, is that the IR pulse arrives at t = 0, and the visible pulse can either be delayed to arrive later (corresponding to a positive delay) or earlier (corresponding to a negative delay). In all examples the IR power, molecular response function (S) and visible pulse power is kept constant. The resulting VSFG spectra are normalized, in order to be able to compare the resolution for different visible pulse shapes [(e) to (g) and (h) to (f)]. By introducing time delays, the 4f pulse shape suppresses the NRB and increases the SFG spectral resolution as the FID is more fully sampled, see Fig. 1(e). Importantly, the magnitudes of the signals as a function of delay are different for these pulse shapes, with the 4f shape falling most rapidly. This issue is discussed below. We also note that optimal NRB suppression for the 4f pulse shape occurs at a time delay corresponding to the first minimum in the sync function. As previously noted [9], optimum time-delay for a time-asymmetric étalon pulse is comparable with the IR pulse duration. The étalon pulse also suppresses the NRB but at the expense of reduced sampling of the resonant response at short time. It thus generally produces broader line shapes, as in Fig. 1(f). We note that for broader vibrational transitions (e.g. O-H, N-H stretch), NRB suppression with delayed étalon pulses may produce artificially broad lines and peak shifts. The same plots of the VSFG spectra are shown in
panels (h) and (i), for narrower resonance linewidths 12 cm−1 and visible pulse bandwidths of
10 cm−1. Again, it can be seen that the 4f pulse shape yields higher spectral resolution but at
the expense of signal magnitude. The longest time delay, 3200 fs (*), corresponds to the zero in the sync function and, hence, the most symmetric lineshapes. However, the signal levels at this delay may be unacceptably small.
We now discuss the formation of ‘inverted’ time-asymmetric ps visible pulses using second harmonic generation (SHG) in a long nonlinear crystal having high group velocity mismatch. The theory of SHG and the effects of crystal length are well known [12,13]. Assuming exact phase matching at the pulse carrier frequencies and small conversion efficiencies (less than few percent), the fundamental pulse does not suffer losses upon propagation through the nonlinear crystal, thus producing, due to the walk-off between the
second harmonic (group velocity v2) and the fundamental (group velocity v1), time-symmetric
square-top ps pulses. In this ideal case, the pulse duration is determined by the crystal length
(L) and the group velocity mismatch, approaching a value of 1 1
1 2
/
L v− −v− . In reality, the fundamental pulse does deplete due to high conversion. In a nonlinear crystal where both the conversion efficiency and the group velocity mismatch are high, SHG yields a long time-asymmetric pulse whose intensity increases exponentially with time, as in Fig. 1(d). For our experiments, we specifically chose LiNbO3 as the nonlinear crystal since it has very high
For this inverted pulse shape, a positive time delay (peak of the pulse arriving after the resonant IR pulse) is essential in order to preferentially sample the resonant response, as shown in Fig. 1(g) and 1(j). At short time delay (250 fs, solid black), the strongest contribution to the SFG signal comes from nonresonant response (dashed), essentially reproducing the Gaussian fs IR pulse spectrum. At longer time delays, the inverted pulse minimally samples the nonresonant response while maximally sampling the resonant response. This SFG spectrum has spectrally resolved vibrationally resonant transitions with very small contributions from the NRB.
In the BB-SFG approach, the time delayed inverted pulse provides spectral resolution and NRB suppression similar to the time-delayed 4f pulse shape. The signal levels as function of time delay, however, behave quite differently. At the highest spectral resolution (3200 fs), the 4f signal level in (h) is more than 5 times smaller than the inverted signal in (j). At 1800 fs time delay, closely resembling our experimental conditions, the inverted pulse shape is expected to be superior in both resolution and signal magnitude. Ultimately, the choice of optimal ps pulse shape will depend on the specific characteristics of the material system. In the following, we demonstrate the utility of the inverted ps pulse shape for applications in vibrational spectroscopy.
3. Experiment
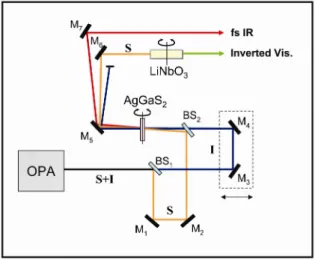
Our BB-SFG setup, depicted in Fig. 2, is based on Ti:sapphire high power fs laser system which was described in detail elsewhere [14]. Briefly, 80 fs, 800 nm pulses at a 1 kHz repetition rate are produced by fs Ti:sapphire regenerative amplifier (Coherent, Legend). Approximately 400 J of the Ti:Sa fundamental is used to pump a fs optical parametric amplifier (LightConversion TOPAS), producing signal (S, 1300 nm) and idler (I, 2080 nm) outputs. Signal and idler are separated and recombined for non-collinear difference frequency mixing in a 1.2 mm AgGaS2 crystal, producing broad bandwidth (~150 cm−1 FWHM) fs IR
pulses centered around 2900 cm−1. As shown in Fig. 2, the residual signal S (~30 J) emerging from the AgGaS2 crystal is spatially separated from the idler I and DFG fs IR
signals. The residual S is used to produce narrow bandwidth ‘inverted’ ps visible pulses (centered at ~650 nm) by second harmonic generation in a long LiNbO3 crystal (either 1 or 2
cm, θ = 58.9°).
Fig. 2. Schematic diagram of the optical system layout for broad band fs IR generation and simulataneous narrowband ps visible pulse generation. A fs OPA produced signal (S) and idler (I) pulses. These are different frequency mixed in a thin AgGaS2 crystal, producing fs IR pulses. The residual signal (S) is doubled in a long LiNbO3 crystal, producing a narrowband visible pulse having an inverted time-asymmetric profile, due to the SHG process.
The synchronized fs IR pulses and ps visible pulses are spatially and temporally overlapped at the horizontal sample surface. The incidence angles for visible and IR beams are ~62° and ~60°, respectively, from surface normal. The beams are focused using two lenses, (f = 50mm, CaF2 for IR and f = 25mm, BK7 for visible). For systems of biological
interest, optical damage by intense fs laser pulses is a concern. Low laser pulse energies at the sample were implemented: ~1.7 J/pulse for the fs IR and ~3 J/pulse for the ps visible. Large spot sizes, 250 m for the IR and 150 m for the visible, we used in order to further minimize potential damage at the sample. The polarization of the visible was controlled by Berek’s polarization compensator (BC) while the polarization of IR was set to be vertical using a periscope. The SFG signal from the sample surface was recollimated and frequency filtered, passing through a 300 mm monochromator (Acton Spectra-Pro 300i) before being detected by a cooled (−40 °C) nanosecond gated intensified CCD camera (Princeton Instruments PI-MAX: 1024 Unigen II, 1024 × 256 pixels). We used a 200 nanosecond gate to minimize background light. For data acquisition, 8 pixels horizontal binning on the CCD chip was applied to further reduce noise. Data collection times for SFG spectra ranged from 2 to 9 min, depending on SFG signal level (2 min for SAM on gold, 9 min for the 1-octanol-air water interface and LB films). To optimize the resonant signals and simultaneously suppress the NRB, IR-visible time delays of ~1.5 ps were used, as described in the theory section.
The time profile of the ‘inverted’ visible pulse was measured via SFG cross correlation using the nonresonant signal from a GaAs crystal interface. The time delay was controlled by a Newport MFN linear stage with 0.1 m accuracy. The cross correlation signal was detected using a 1P28 photomultiplier tube (PMT) and amplified with a gain of 25 by a preamplifier coupled through 470 pf into a boxcar integrator (Stanford Research Systems).
1-dodecanethiol coated SAM on gold was prepared by incubating a clean gold slide in an ethanoic thiol solution (24 hours at room temperature), followed by rinsing with ethanol to remove excess thiols from the surface. A monolayer of 1,2-dimyristoyl-sn-glycero-3-phosphocholine (DMPC, Avanti Polar Lipids) was prepared on glass by standard Langmuir-Blodgett (LB) methods. These samples were dried for at least 24 hours in a N2 purged
desiccator before SFG measurement. A 1 mM 1-octanol (BDH, 95%) solution was prepared using Milli-Q water (resistivity 18 M .cm, total organic carbon <10 ppb). For SFG measurement, the solution was kept for 10 min in a clean Teflon Petri dish to form an equilibrium 1-octanol monolayer at the air-water interface.
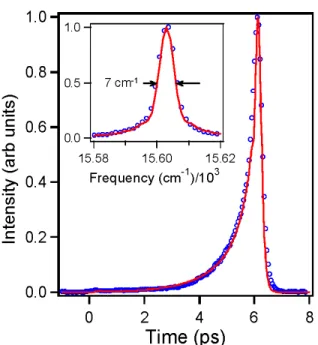
Fig. 3. The experimental cross correlation, shown as open blue circles, of the time-asymmetric pulse from a 2 cm LiNbO3 crystal. The thin red line shows the independent result from a calculation (no adjustable parameters). The inset shows the measured visible pulse spectrum, as blue circles, and, as the red line, the Fourier transform power spectrum of the computed deconvolved cross correlation shown in the main figure. For details, see the text.
4. Results and discussion
In Fig. 3 we present the measured fs IR – ps visible cross correlation and, inset, the measured spectrum of visible ps pulse. Data for the case of a 2 cm LiNbO3 SHG crystal are shown as
open blue circles. The solid red lines are obtained by independent calculation of the SH generation process using SNLO v.48, plane-wave short pulse mixing (A.V. Smith, AS-photonics, Albuquerque, NM). There were no adjustable parameters – the red lines are not a fit. The computed spectrum corresponds to Fourier transformation of the time profile. The agreement between experiment and calculation is excellent. It can be seen that the long LiNbO3 SHG crystal produces a well characterized ‘inverted’ pulse shape. The cross
correlation and spectrum for SHG using a 1 cm LiNbO3 crystal (not shown) are also in
agreement with the computed SNLO results. The spectral line width of the visible pulse (~7 cm−1 and ~13 cm−1 for 2 cm and 1 cm crystals, respectively) is well suited to high quality spectroscopic resolution in the C-H stretch region for most surface molecular systems. In the cross correlation shown in Fig. 3, the signal rises from less than 10% of the maximum intensity to the maximum value in approximately 2.5 ps, indicating substantial NRB suppression is expected, as depicted in Fig. 1(g) and 1(j).
Due to pump depletion and back-conversion, SHG in a long crystal can in principle lead to pulse shapes and spectra which depend on radial position (i.e. intensity) within the Gaussian spatial mode of the output pulse. In order to check this, we scanned a pinhole over the collimated SHG beam emerging from the long LiNbO3 crystal and recorded spectra as a
function of spatial position with the laser spot. In our case, no variation of the pulse spectrum with radial position was observed.
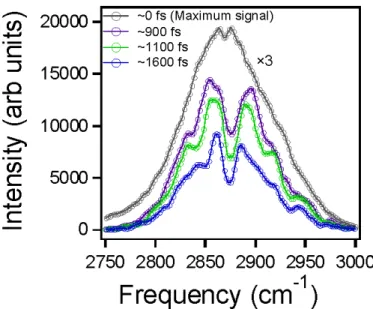
Fig. 4. BB-SFG spectra of 1-dodecanethiol SAM on gold for different IR and visible time- delays, recorded using PPP polarization. A time delay between the IR and visible is applied to minimally sample the NRB from gold and maximally sample the resonant signal.
SFG spectra of 1-dodecanethiol SAM on gold of C-H stretch region are shown in Fig. 4. For these spectra, inverted pulses from 1 cm LiNbO3 crystal were used. The time delay of ~0
fs is defined as the delay position which gives maximum SFG signal, essentially reproducing the Gaussian IR spectrum as described in Fig. 1. Introducing a time-delay between the IR and inverted visible pulses, the vibrational C-H transitions appear as negative going dips in the Gaussian IR envelope [15]. The NRB signal from gold is a few orders of magnitude larger than calculated spectra in Fig. 1. It is therefore not feasible to completely suppress it. SFG spectra were recovered by dividing the SFG spectrum of SAM on gold by the NRB signal from bare gold, as is shown in Fig. 5(a). In order to record VSFG spectra in a reproducible manner, it is important to be able to set and control the spectrum of the visible pulse. In our scheme this is defined by the signal wavelength, and the phase matching angle of the long LiNbO3 crystal. In this paper we discuss mainly VSFG in the C-H stretch region around 2900
cm−1, however, in order to probe different vibrational transitions adjacent to alkyl C-H stretch, it will be required to tune the IR frequency. This involves changing the signal and idler wavelengths which in turn requires tuning of the generation of the visible pulse.
Fig. 5. BB-SFG spectra of: (a) 1-dodecanethiol SAM on gold using PPP polarization; (b) LB monolayer of DMPC under SSP polarization at two surface pressures; (c) 1-octanol air-water interface under SSP polarization. These results confirm the utility of the inverted pulse BB-SFG scheme.
For two different ‘inverted’ visible pulses (1 cm and 2 cm LiNbO3), SFG spectra of
1-dodecanethiol SAM on gold were recorded and the results are shown in Fig. 5(a). The spectra in the C-H stretch region are dominated by three transitions which can be assigned to the CH3
symmetric stretch (v r+) = 2882 cm−1, the Fermi resonance of r+, (v rFR)
+
= 2940 cm−1 and the CH3 asymmetric stretch, (v r−) = 2970 cm
−1
. Due to the gauche conformation of the SAM monolayer, two weak CH2 transitions are observed that are centered at 2850 cm
−1
(symmetric stretch, d+) and 2919 cm−1 (asymmetric stretch, d−). All the spectra were fitted using a standard multi-Lorentzian approximation [8]. These spectra are in good agreement with the reported SFG spectra of similar SAM on gold surfaces [15]. The SFG spectrum produced with inverted visible pulses from 2 cm LiNbO3 crystal show higher spectral resolution,
resolving the CH2 asymmetric stretch adjacent to the terminal CH3 group ( (v dω+) = 2868
cm−1) in the d+band. This clearly demonstrates the capability of the inverted pulse BB-SFG approach for resolving finer features of vibrational spectra at interfaces.
The SFG spectra for a LB monolayer of DMPC are shown, at two different surface pressures (20 and 30 mN/m), in Fig. 5(b). Four main transitions are seen and are attributed to
d+ (2855 cm−1), r+ (2875 cm−1), d− (2920 cm−1) and rFR
+
(2942 cm−1). Qualitatively, the increasing of the intensity of the CH3 stretch transitions ( r+ and rFR
+
) relative to those of the CH2 ( d+and d−) stretch transitions shows the closer packing of monolayer upon increasing
spectrum for well known model system of 1-octanol at the air-water interface [16]. The two strong transitions are assigned to r+ (2879 cm−1) and rFR
+
(2944 cm−1) and the two weak transitions are attributed to d+ (2850 cm−1) and d− (2916 cm−1), showing good agreement with prior studies. The results of these three surface studies show that the present ‘inverted’ pulse scheme is very comparable to other BB-SFG schemes.
5. Conclusion
We have presented a BB-SFG arrangement based on a single OPA system whose output is used to produce both broad band fs IR and an ‘inverted’ narrowband ps visible pulse. Second harmonic generation from a long nonlinear crystal having high group velocity mismatch is demonstrated to be a good approach for generating narrow band visible pulses with a time-asymmetric pulse profile which rise exponentially over a couple of ps, efficiently suppressing the electronic nonresonant background. Varying the time delay between the fs IR and the inverted visible pulse can be used to achieve good spectral resolution while minimizing contributions from the nonresonant background signal. This is achieved without significant artificial line broadening or peak shifting. The time delay between IR and visible pulses can be used as a variable to trade off spectral resolution vs. signal intensity. At the time delays used in these experiments (~1500 fs), we expect, as shown in Fig. 1, that the inverted pulse scheme will have both better spectral resolution and high signal levels than either the 4f or étalon. Finally, this approach makes very efficient use of fs Ti:Sa amplifier pulses, as no additional 800 nm pulse is required to generate the narrowband ps visible pulse.