Publisher’s version / Version de l'éditeur:
PERD/CHC Report 20-86, 2007-03
READ THESE TERMS AND CONDITIONS CAREFULLY BEFORE USING THIS WEBSITE.
https://nrc-publications.canada.ca/eng/copyright
Vous avez des questions? Nous pouvons vous aider. Pour communiquer directement avec un auteur, consultez la
première page de la revue dans laquelle son article a été publié afin de trouver ses coordonnées. Si vous n’arrivez pas à les repérer, communiquez avec nous à [email protected].
Questions? Contact the NRC Publications Archive team at
[email protected]. If you wish to email the authors directly, please see the first page of the publication for their contact information.
Archives des publications du CNRC
For the publisher’s version, please access the DOI link below./ Pour consulter la version de l’éditeur, utilisez le lien DOI ci-dessous.
https://doi.org/10.4224/12327229
Access and use of this website and the material on it are subject to the Terms and Conditions set forth at
PERD Iceberg Sighting Database: 2007
Trott, B.; Comfort, G.
https://publications-cnrc.canada.ca/fra/droits
L’accès à ce site Web et l’utilisation de son contenu sont assujettis aux conditions présentées dans le site LISEZ CES CONDITIONS ATTENTIVEMENT AVANT D’UTILISER CE SITE WEB.
NRC Publications Record / Notice d'Archives des publications de CNRC:
https://nrc-publications.canada.ca/eng/view/object/?id=7283f570-9d54-4a9a-aefb-285362f673cc https://publications-cnrc.canada.ca/fra/voir/objet/?id=7283f570-9d54-4a9a-aefb-285362f673cc
for the Grand Banks of Canada
This report is a compilation of the individual reports that have been prepared to describe the database and annual updates to the PERD Grand Banks Iceberg Sighting Database (formerly known as the PERD Iceberg Population Database). The database was initiated in 1998 to assimilate all of the information on the annual iceberg population on the East Coast. It is updated each year with new data from the previous ice season. Also,
improvements to the database are usually made in identifying new sources of data and eliminating duplicate records. The individual annual update reports are presented here beginning with the most recent.
The database can be accessed through the NRC-CHC by downloading the file
PERD_Iceberg_Sighting_Database_07.mdb
The work is supported as part of the Ice-Structure Interaction Activity of the Program of Energy Research and Development (PERD). For information on this activity please
contact G.W. Timco at [email protected]
By: B. Trott G. Comfort
Submitted to: Dr. Garry W. Timco Canadian Hydraulics Centre National Research Council Canada
Ottawa, Ontario K1A 0R6
Submitted by:
BMT Fleet Technology Limited 311 Legget Drive
Kanata, ON K2K 1Z8
BMT Contact: George Comfort Tel: 613-592-2830, Ext. 226
Fax: 613-592-4950 Email: [email protected]
PERD ICEBERG SIGHTING DATABASE UPDATE & QUALITY ASSURANCE: 2006-2007
DRAFT FINAL REPORT
BMT DOCUMENT QUALITY CONTROL DATA SHEET
REPORT: PERD Iceberg Sighting Database Update & Quality Assurance: 2006-2007
DATE: March 30, 2007
PREPARED BY: B. Trott
REVIEWED BY:
G. Comfort
Manager, Cold Regions Technology Centre
APPROVED BY:
G. Comfort
Manager, Cold Regions Technology Centre
PROJECT TEAM MEMBERS:
Brad Trott – Project Execution (Data Assembly, Data Checking, Database Population) George Comfort - Project Manager & Technical Direction
ACKNOWLEDGEMENTS
Dr. Garry Timco of the National Research Council was the project officer. He is thanked for his suggestions and guidance throughout the project.
Don Murphy of the International Ice Patrol (IIP) is thanked for his efforts to supply iceberg data for the Year 2006 for inclusion in the PERD Iceberg Sighting Database.
Pip Rudkin of PAL Environmental (Provincial AirLines) is thanked for his efforts to supply iceberg observations at oil industry sites, and their Iceberg Management Database for insertion in the database.
Brian Hill of the Institute of Ocean Technology (IOT) of the National Research Council is thanked for providing historic iceberg sighting data for the period from 1890 to 1959.
Luc DesJardins of the Canadian Ice Service (CIS) is thanked for supplying quality-checked flight track data for flights made by the CIS and the IIP during 2004 and 2005.
DISCLAIMER
The views expressed in this report are those of BMT Fleet Technology Limited, and are not necessarily representative of those of the National Research Council.
TABLE OF CONTENTS
1. INTRODUCTION ... 1
1.1 Background ... 1
1.2 Objectives & Tasks ... 2
2. INSERTION OF ADDITIONAL DATA AND QUALITY ASSURANCE... 3
2.1 Summary of Data Checks and Quality Assurance Procedures ... 3
2.1.1 Icebergs Located on Land ... 3
2.1.2 Duplicate Numbering ... 8
2.1.3 Format Changes required for the Historical Data ... 9
2.2 2005 Sightings Made by the IIP and the CIS... 11
2.3 2005 Sightings Made by the Offshore Oil Industry ... 11
2.4 Historical Iceberg Sightings... 11
3. FLIGHT TRACK DATA FOR 2004 AND 2005 ... 12
3.1 Data Source and Analysis Procedure ... 12
3.2 Flight Track Data ... 12
4. DATABASE IMPROVEMENTS ... 14
4.1 Summary ...Error! Bookmark not defined. 5. PRESENT STATUS OF DATABASE AND RECOMMENDATIONS ... 17
5.1 Summary of Work Done and Present Status of Database... 17
5.2 Recommendations ... 17
LIST OF FIGURES
Figure 2.1: Sample Plot of Iceberg Sightings for Individual Year ... 4
Figure 2.2: Sample Individual Year Plot for Land-Based Sightings ... 5
Figure 2.3: Google Earth plot showing icebergs from 1930’s... 6
Figure 2.4: 1938 Google Earth Plot Showing Icebergs from 1938... 7
Figure 2.5: Google Earth, Places Controller... 8
Figure 2.6 - Duplicate IOT vs IMD Sightings for 1952 ... 9
Figure 2.7: Original Duplicate Entries for Raw Historical Sightings Noting 148 from 1952 ... 10
Figure 2.8: Corrected Duplicate Entries for Historical Sightings Noting 148 from 1952... 10
Figure 3.1: Sample Flight Track: PAL # 1358 ... 13
Figure 4.1: Quick Area Tool query process length warning... 15
Figure 4.2: Advanced Tool Result Without Plotting Control ... 16
LIST OF TABLES Table 5.1: PERD Iceberg Sighting Database Summary ... 17
1.
INTRODUCTION
1.1 BackgroundBMT Fleet Technology Limited (BMT) compiled a database in 1998 initially called the “PERD
Grand Banks Iceberg Database”. The name was recently changed to the “PERD Iceberg
Sighting Database” for iceberg sightings within the Grand Banks and eastern Canada. The project was undertaken in collaboration with Agra Earth and Environmental (now AMEC) [2]. The PERD Iceberg Sighting Database has been updated annually and improved since 1998 [3]; [4]; [5]; [6]; [7]; [8]; [9]; [10]. In addition, the work included the following:
(a) an extensive query of the database [7] – first, a large-scale query was done which
produced files with iceberg sighting data for each month of each year for 1° latitude-by-longitude cells. Then, a detailed query was done for 0.5° latitude-by-latitude-by-longitude cells in the oil development area of the Grand Banks.
(b) the addition of sighting data from other databases and major sources – sightings from the
PERD Iceberg Shape Database [2], the PERD Iceberg Management Database [1], and the PERD Ship-Iceberg Collision Database [3] were added. In addition, historical iceberg sighting data dating back to 1610 were added to the database.
(c) the creation of a new data table containing flight track data [9]; [10]; [11] – a new data table (termed PERD aircraft.mdb) was produced in MS Access, and linked to the existing iceberg sighting data table. The “PERD aircraft.mdb” data table was populated with quality-checked flight track data for all International Iceberg Patrol (IIP) and Canadian Ice Service (CIS) flights done over the 1986-1991 and 1998-2003 periods. The
combination of the two data tables allowed a user to determine the search area associated with the icebergs sighted. This allowed iceberg area densities to be calculated (e.g., [11]).
The above projects were all funded by the Program on Energy Research and Development (PERD).
1.2 Objectives & Tasks
The objectives and tasks of the current project were to:
(a) add historical iceberg sighting data that have recently been assembled by B. Hill of the
Institute of Ocean Technology (IOT) for 1910 to 1959. During the course of this project, additional historical iceberg sighting data dating back to 1890 became available from B. Hill. These additional data were also added to the Iceberg Sighting Database.
(b) add additional quality-checked flight track data for all IIP and CIS flights done in 2004 and 2005.
(c) obtain and insert all 2005 iceberg sighting data from the IIP.
(d) obtain and insert all 2005 iceberg sighting data collected by the oil industry.
2.
INSERTION OF ADDITIONAL DATA AND QUALITY ASSURANCE
2.1 Summary of Data Checks and Quality Assurance ProceduresData quality assurance procedures have been developed over the years, and the same ones were followed this year. For brevity, they are not described here. The following checks were made:
(a) icebergs located on land – the positions of all iceberg sightings were plotted. Any ones that fell on land were not inserted into the database.
(b) duplicate numbering – a series of checks were made following the usual procedures.
(c) variations in formats – the format of the historical data differed from that in the database. The most significant variation was that the historical data treated multiple sightings with the same position as one sighting with multiple “counts”. The database treats each individual iceberg as a separate record. A program was written to convert the historical data to the same format as the existing Iceberg Sighting database.
2.1.1 Icebergs Located on Land
As part of the data reduction for newly received iceberg information, all sightings were plotted using the geographic mapping program Versamap. As in previous years, the newly received data were plotted using the latitude and longitude coordinates of each iceberg to determine if any sightings fell on land. The sightings for each year were plotted individually to reduce the number of bergs on a single map (See Figure 2.1 for sample plot), thereby allowing plots to be done at expanded scale for individual sightings on land with tagged numbers for each iceberg (Figure 2.2). It should be noted that the numbers used on the Versamap plots do not represent the iceberg number used in the database, but are used as a reference to indicate the iceberg latitude and longitude in the working spreadsheets used for data reduction.
An additional iceberg plotting step was done, in which Versamap plots which located sightings on land were re-plotted using Google Earth. See Figure 2.3 for example plot. This provided better resolution for determining whether or not a given iceberg was actually on land.
Figure 2.3: Google Earth plot showing icebergs from 1930’s
Figure 2.3 provides a plot of all land-based icebergs noted for the 1930-1939 decade. Each sighting was plotted displaying the iceberg number used by the Institute of Ocean technology (IOT) and is the proper number as found in the database. An additional feature of Google Earth is the capability to tag each plotted point with additional information and to remove/enable each plot. Figure 2.4 displays the Google Earth plot for only the land-based iceberg sightings for 1938. Figure 2.5 displays the Google Earth Places controller which contains additional information about each plot and controls the remove/enable function for each plot point.
Figure 2.5: Google Earth, Places Controller
2.1.2 Duplicate Numbering
As was done for previous seasons, checks were made for duplicate numbering, in which the same iceberg had been sighted by two different sources. Duplicate sightings were not entered into the database.
For the current season, only historical sighting data, from 1890 to 1959 as supplied from the Institute of Ocean Technology (IOT), were available for entry into the database. These historical data contained some sightings that had been entered into the PERD Sighting Database
previously, under the “IMD” data source. Figure 2.6 illustrates duplicate sightings between original PERD sighting database from IMD and the new full set of sighting information from IOT for 1952.
Figure 2.6 - Duplicate IOT vs IMD Sightings for 1952
After discussions with B. Hill of the Institute of Ocean Technology, it was discovered that 9810 records of the recently-supplied IOT data from 1890 -1950 were the same data as the original “IMD” data. These 9810 “IMD” records were removed from the Sighting Database, and the full historical data set received from B. Hill of IOT for 1890–1959 was inserted into the Sighting Database.
2.1.3 Format Changes required for the Historical Data
The 1890 – 1959 historical data was supplied with latitude and longitude values in a DMS (Degrees Minutes Seconds) type format. Because the PERD Sighting Database requires that positional data be entered in decimal degrees, the as-supplied data were converted to this format within Excel.
Also, work was required to put the historical data in the same format as the existing database with respect to the number of “counts”. In the historical data, one record might have several “counts” whereas in the database, each iceberg is a unique record. The historical data often grouped additional icebergs under one latitude and longitude position as displayed in the data example of Figure 2.7, where values greater than one may appear in the # columns to the right of
Figure 2.7: Original Duplicate Entries for Raw Historical Sightings Noting 148 from 1952
A macro program written in MS Excel was used to search for all iceberg entries where more than one berg was tracked in an XY position and to expand that sighting with additional line items to match the number of sighted bergs. Each new entry was then given an iceberg number which incremented the base number by one. This step was required to ensure that the PERD Sighting Database properly represented the number of icebergs sighted as the database.
Figure 2.8 represents iceberg # 148 from 1952 after being expanded to include the four sightings that it actually represented.
Figure 2.8: Corrected Duplicate Entries for Historical Sightings Noting 148 from 1952
A total of 105,740 individual iceberg sightings were tabulated for the 1890–1959 period in the historical data supplied by IOT. Of these, 9810 sightings were found to be already in the sighting database (described previously). As a result, a total of 95,930 sighting records were entered into the PERD Sighting Database for the 1890–1959 period.
2.2 2005 Sightings Made by the IIP and the CIS
No icebergs were sighted during the surveys made by the IIP and the CIS during 2005.
2.3 2005 Sightings Made by the Offshore Oil Industry
No icebergs were sighted during the surveys made by the offshore oil industry during 2005.
2.4 Historical Iceberg Sightings
A total of 95,930 sightings were added to the database. These sightings were made over the 1890 to 1959 period, as described previously.
3.
FLIGHT TRACK DATA FOR 2004 AND 2005
3.1 Data Source and Analysis ProcedureQuality-checked flight track data were obtained in electronic format from L. DesJardins of the CIS for all IIP and CIS flights for 2004 and 2005. These were encoded using MANICE [12]. During a previous project [10], a program was written in C++ to decode and extract flight track information from these files. This same program was used again in this project.
This program converts the raw MANICE output files to a comma delimited text file that can be parsed and converted to Excel spreadsheet files. After a separated data file was created, a mathematical program within the database is able to convert the radar and visual coverage distance to metric measurements and then create flight leg coverage by calculating the outside points of the radar/visual coverage.
3.2 Flight Track Data
Two years of flight data was supplied by Luc Desjardins of the Canadian Ice Service (CIS) for 2004 and 2005. These two years included 3 datasets, a 2004 Provincial Airlines (PAL) dataset for 2004 and 2005 as well as one CIS dataset for 2005.
A total of 44 flights were supplied by the CIS for 2004 and 2005. Figure 3.1 shows a sample flight track.
4.
DATABASE IMPROVEMENTS
The following improvements were made:
(a) During execution of the database, in the Flight Information Database, it was noticed that
the Advanced Tool Results did not clear when an aircraft vs iceberg query was run. This caused some confusion to users as the results would remain available after all queries were reset to default tables. This was corrected such that after any resetting of queries, the Advanced Tool Results tab would be cleared and hidden.
(b) A notice was added to the Quick Area Tool of the aircraft search tab. The purpose of the
Quick Area Tool is to allow users to quickly search for aircraft flights that fall within a boundary of four latitude and longitude positions. It was found that running this tool on all 1378 flights in the database took an extended period of time. To warn users about this extensive processing time, a message box has been created which will make the user aware that this action may require a longer period of time to execute. Selecting “YES” to the message box will run the required query while selecting “NO” will close the Quick Area Tool immediately.
Reducing the number of aircraft flights in the flight list using the Flight Information Search will allow the Quick Area Tool to perform much faster.
Figure 4.1 represents this message box which is displayed when the Query Flights button of the Quick Area Tool is clicked.
Figure 4.1: Quick Area Tool query process length warning
(c) The previous version of the PERD Iceberg Sighting and Flight Information Database
includesd the development of the Flight Analysis tool and graphical plotting of the iceberg sightings with corresponding aircraft flights. This plot was located on the Advanced Tool Results tab of the database interface. This graphical plot utility was removed in this project from the Advanced Tool Results due to the fact that some users of the PERD Iceberg Sighting and Flight Information Database may not have system
privileges to install the required chart graph control.
Removing the plotting control still allows for all statistical calculations for flight
coverage and iceberg densities per flight to be retained. Only the graphical representation of the flight is not available at this time. Removing the plotting capability ensures that the database can still be offered as a standard Microsoft .mdb database file.
5.
PRESENT STATUS OF DATABASE AND RECOMMENDATIONS
5.1 Summary of Work Done and Present Status of DatabaseThe following has been done:
(a) historical iceberg sighting data for the 1890 to 1959 period have been added. A total of 95,930 sightings were added to the database from this source.
(b) searches have been made for iceberg sighting data from the CIS and the IIP for 2005.
Unfortunately, no iceberg sighting data were available from this source for 2005.
(c) searches have been made for iceberg sighting data from the offshore oil industry for 2005.
Unfortunately, no iceberg sighting data were available from this source for 2005.
(d) quality-checked flight track data for all IIP and CIS flights done in 2004 and 2005 has been
added to the database.
(e) improvements have been made to the database
The PERD Iceberg Sighting Database now extends back as far as 1619, and has 295352 records (Table 5.1).
Table 5.1: PERD Iceberg Sighting Database Summary
Data Source # of Sightings Period of Record
Large-Scale Surveys (e.g., IIP, CIS) 174,445 1960 to 2005
Data From Oil Industry Wellsites 18,611 1981 to 2005
Historical Data 111,077 1619 to 1959
Detailed Iceberg Field Surveys 876 1979 to 1997
5.2 Recommendations
The PERD Iceberg Sighting Database should continue to be updated as more data becomes available.
The database is beginning to see the limitations of Microsoft Access. The volume of data and involved data queries may start to become too advanced for Microsoft Access. Future
investigations into a larger Microsoft SQL database engine may be required to contain the data and efficiently extract data for analysis purposes.
6.0 REFERENCES
[1] Rudkin, P., 2004, Iceberg Management Database, prepared by Provincial AirLines Ltd.,
(PAL), submitted to the National Research Council.
[2] Singh, S., Green, S., Ennis, T., Comfort, G., and Davidson. L., 1998, PERD Iceberg
Database for the Grand Banks Regions, report 4807 submitted by Fleet Technology Ltd. and AGRA to the National Research Council.
[3] Singh, S., Li, X., and Comfort, G., 1999, PERD Grand Banks Iceberg Database Update,
Fleet Technology Ltd report 4901 submitted to the National Research Council.
[4] Verbit, S., Trott, B., Gong, Y., and Comfort, G., 2000, PERD Grand Banks Iceberg
Database Update II, FTL report 5068 submitted to the National Research Council.
[5] Verbit, S., and Comfort, G., 2001, Update and Quality Assurance of the PERD Grand
Banks Iceberg Database, FTL report 5186 submitted to the National Research Council.
[6] Verbit, S., Trott, B., and Comfort, G., 2002, Update and Quality Assurance of the PERD
Grand Banks Iceberg Database, FTL report 5273 submitted to the National Research Council.
[7] Verbit, S., Trott, B., and Comfort, G., 2003, Update, Quality Assurance and Query
Results for the PERD Grand Banks Iceberg Database: 2003, FTL report 5432 submitted to the National Research Council.
[8] Verbit, S., Comfort, G. and Trott, B., 2004, “PERD Iceberg Sighting Database: 2004
New Data Insertion and Flight Data Investigation”, BMT Fleet Technology Limited report 5723 submitted to the National Research Council.
[9] Verbit, S., Comfort, G. and Trott, B., 2005, “PERD Iceberg Sighting Database: Data
Insertion And Linkage to the Iceberg Management Database”, BMT Fleet Technology Limited report 5899 submitted to the National Research Council.
[10] Verbit, S., and Comfort, G., 2006, PERD Iceberg Sighting and Flight Information
Database Development, BMT Fleet Technology Limited report 5954 submitted to the National Research Council.
[11] Verbit, S., Comfort, G., and Timco, G., 2006, Development of a Database for Iceberg
Sightings Off Canada’s East Coast, proc. Ice Symposium of the IAHR, Sapporo, Japan.
[12] Canadian Ice Service (CIS), 2002, MANICE – Manual of Standard Procedures for
Observing and Reporting Ice Conditions, 9th edition, Environment Canada website,
5954C.FR
PERD ICEBERG SIGHTING DATABASE: FLIGHT INFORMATION DEVELOPMENT I
PERD/CHC 20-86 FINAL REPORT
March 2006
Submitted to: Dr. Garry W. Timco
Canadian Hydraulics Centre (CHC) National Research Council Canada
Ottawa, Ontario, K1A 0R6
Submitted by:
BMT FLEET TECHNOLOGY LIMITED 311 Legget Drive
Kanata, ON K2K 1Z8
BMT Contact: George Comfort Tel: 613-592-2830, Ext. 226
Fax: 613-592-4950
BMT DOCUMENT QUALITY CONTROL DATA SHEET
REPORT: PERD Iceberg Sighting and Flight Information Database Development I
DATE: March 2006
PREPARED BY:
Stephanie Verbit, Mechanical Engineering Specialist
REVIEWED BY:
George Comfort, Manager Cold Regions Technology Centre
APPROVED BY:
Aaron Dinovitzer, President
REPORT
PRODUCTION BY:
Karen Scrimshaw
PROJECT TEAM MEMBERS:
Stephanie Verbit Mechanical Engineering Specialist
Brad Trott Programmer Analyst
ACKNOWLEDGEMENTS
Dr. Garry Timco of the National Research Council was the project officer. He is thanked for his suggestions and guidance throughout the project.
Ann Collins undertook an invaluable data quality checking task which helped improve user confidence in the PERD Iceberg Sighting Database. She was also a key participant in focusing the direction of the project.
Luc Desjardins of the Canadian Ice Service is thanked for supplying flight message data files, and providing the project team with a solid understanding of the flight data.
Don Murphy of the International Ice Patrol (IIP) is thanked for offering his expertise with regard to aircraft radar performance information.
QUESTIONS, COMMENTS, CONCERNS
The PERD Iceberg Sighting Database for which this report was written is a newly developed tool and user feedback is strongly encouraged. Please direct any questions, comments, or concerns regarding this report and/or the database to both:
Dr. Garry Timco [email protected] Canadian Hydraulics Centre (CHC)
TABLE OF CONTENTS
1. INTRODUCTION ... 1 1.1 Background ... 1 1.2 Objectives ... 1 1.3 Project Overview ... 2 2. ICEBERG SIGHTING DATABASE ... 3
2.1 General... 3 2.2 Iceberg Data ... 3 3. FLIGHT INFORMATION DATABASE... 5 3.1 General... 5 3.2 Flight Data ... 5 3.3 Database Development ... 9 4. INTERIM DEVELOPMENT PROGRAM ... 11 5. CROSS REFERENCE TOOL ... 12
5.1 General... 12 5.2 Query Designer ... 12 5.3 Database Interaction... 13
5.3.1 Iceberg Sighting Database ... 13 5.3.2 Flight Information Database ... 13 5.4 Cross-Reference Results Tab... 14
5.4.1 Advanced Analysis Inputs ... 14 5.4.2 Nominal Results... 14 5.4.3 Flight and Sighting Global Results ... 15 5.4.4 Detailed Flight Leg Areas... 15 5.4.5 Charting Tools ... 15 5.4.6 Save Results Button ... 16 6. FLIGHT LEG AREA CALCULATION ... 17 6.1 Bounded Leg Area Calculation... 18 6.2 Partially Bounded Leg Area Calculation ... 18 7. TOTAL FLIGHT AREA CALCULATION... 20 7.1 Custom Grid Area Tool Method ... 21 7.2 Existing GIS software method ... 22 7.3 Integrate Total Flight Polygons and Area Intersections ... 24 8. DISCUSSION & THE WAY FORWARD ... 25 8.1 Iceberg Sighting Database ... 25 8.2 Flight Information Database ... 25 8.3 Database Cross Referencing Tool... 25 8.3.1 Custom Grid Area Estimation Option... 26 8.3.2 GIS Software Utilization Option ... 27 8.3.3 Pre-Processed Flight Information and Area Intersection Algorithm Option .. 28 8.4 Future Development Planning: Batch Run Mode... 28
9. RECOMMENDATIONS... 30 10. REFERENCES ... 31
LIST OF FIGURES
Figure 2.1: Iceberg Sighting Query Generation Layout ... 3 Figure 3.1: Example Flight Leg Area Schematic... 8 Figure 3.2: Flight Information Query Generation Layout ... 9 Figure 3.3: Quick Area Tool Input Form... 9 Figure 3.4: Flight Data Radio Button Options... 10 Figure 4.1: Development Program Interface ... 11 Figure 5.1: Cross-Reference Query Designer... 12 Figure 5.2: Advanced Tool Results Example ... 14 Figure 5.3: Flight Number 14 with Radar Range Leg Area Boundaries ... 15 Figure 5.4: Output Option Dialog... 16 Figure 5.5: Cross Reference Analysis Workbook Output ... 16 Figure 6.1: Example Leg and Boundary Intersection Schematic ... 17 Figure 6.2: Case 8 Triangle Area Schematic ... 19 Figure 7.1: Flight Number 14 with Radar Range Overlap Highlighted ... 20 Figure 7.2: Grid Area Conceptual Schematic ... 21 Figure 7.3: Example Flight Search Area... 24 Figure 8.1: Steps in Executing an “Interactive User” Search ... 27 Figure 8.2: Steps in Executing a Search with the “Stand-Alone” Option ... 29
LIST OF TABLES
Table 2.1: Renumbered Icebergs ... 4 Table 2.2: Flag Number Definitions ... 4 Table 3.1: Summary Flight Information ... 5 Table 3.2: Detailed Flight Track Information: Columns 1 to 10 ... 6 Table 3.3: Detailed Flight Information: Columns 1 and 11 to 18... 7 Table 3.4: Detailed Flight Information: Columns 1 and 19 to 26... 7
1.
INTRODUCTION
1.1 Background
The PERD Iceberg Sighting Database currently available for distribution contains sighting observations collected from various sources since its inception in 1998 [1]. The database was updated annually as new data became available [2, 3, 4, 5, 6, 7, 8.]. The annual updating process was modified in 2000 to include data quality verification to reduce the possibility of duplicate sightings, and the database functionality was regularly reviewed based on user comments. During the 2003 annual update [6], the sighting data were analyzed with respect to iceberg population density for positional grids as small as 0.1 square degrees. This exercise raised questions regarding the frequency of sampling carried out to obtain the observations. Because the database only contains sightings, it was not capable of providing information regarding iceberg frequencies, population densities, or fluxes. For example, if a query did not generate iceberg sightings, it was not possible to determine whether no icebergs were present in the specified search area during the specified time period, or whether no sampling observations were made for that area during the specified time period.
The 2004 annual update [7] included a task to investigate the availability and format of sampling information from aircraft. The Canadian Ice Service (CIS) was found to have extensive flight information data from 1986 to 2003. Sample flight information data files, or flight messages, from the year 2000 were examined using the MANICE code [10] to determine the feasibility of using these to establish a correlation between sampling and iceberg sighting densities. The availability of flight position information and visibility distance information within each flight message was deemed adequate to correlate aircraft sampling to iceberg sightings viewed by aircraft. The CIS has an automated decoding program which is a part of their BAPS system, which BMT was not authorized to use. Therefore, an automated method to decode and extract the flight track portion of the flight messages was developed in Visual Basic for Applications (VBA) for MS Excel. The program was used successfully to extract the information listed below for the 154 flight track messages available for the year 2000.
Along with inserting newly available iceberg sighting data, the 2005 annual update [8] involved the conceptualization and development of a preliminary aircraft versus iceberg sighting dual database. This preliminary database was well received, resulting in the development efforts described here. To further resolve the question of sampling frequency as it pertains to aircraft sighted icebergs, the current project involved the initial implementation of a combined database that cross-references iceberg sightings and flight information.
1.2 Objectives
It was concluded in a preceding project [8] that the utility of the Iceberg Sighting Database would be improved if flight track data were included in a manner that allowed this information to be linked to the iceberg sighting data. The objective of this project was to develop a meaningful joining of flight area sampling coverage and iceberg sighting data such that the two types of
1.3 Project Overview
The project was comprised of three stages. The first stage was planning and data evaluation where the previous project work was reviewed. This process involved:
(a) reviewing the available flight data and how to use it effectively; (b) reviewing the status of the existing dual database;
(c) determining what kind of database features to include or exclude from development;
(d) establishing how the two databases would be cross-referenced;
(e) outlining potential results and display methods to investigate; and (f) defining the display layout framework.
The second stage of the project was implementation, where three main actions were taken.
(a) The independent database units (i.e., sighting and flight) were enhanced based on the
initial development work accomplished in the initial dual database [8]. This phase allowed the databases to be easily queried independently.
(b) Algorithms for more advanced cross-referencing data between the two data sets were
developed using Microsoft Visual Basic.
(c) The final algorithms for cross-referencing the databases were transferred from Visual
Basic into the MS Access dual database.
The third stage of the project evolved during advanced algorithm development due to increasing familiarity with the flight data. Troubleshooting efforts were required in the determination of the total sampled surface area, for a given flight. Two options for the calculation were defined:
(a) developing an original algorithm to calculate the total surface area based on a grid squares method or;
(b) investigating the possibility of using existing geo-referenced software tools, either:
i. within the framework of the existing database, that is, using an embeddable
ActiveX component, or
ii. external to the framework of the existing database, that is, using stand alone software tools to complete the final calculation.
The above options were examined; however, given the constraints of the current development program, the solutions were not implemented.
All available flight message data were inserted into the database. The flight messages collected from Luc Desjardins of the Canadian Ice Service (CIS) date from 1986 to 2004. Flight track data for the years from 1992 to 1997 were not included because quality assurance steps have not yet been implemented for those years. An example of how the database is used is also presented.
2.
ICEBERG SIGHTING DATABASE
2.1 General
The sighting database has been evaluated and updated in previous database improvement programs and further efforts to improve the existing basic database functionality were
unnecessary. The addition of the new database cross-referencing tool involved cosmetic layout changes on this form to create space for the tool. The combined database is presented in a tab format where the sighting database is located on the first tab. Figure 2.1 shows the new query generation layout.
Figure 2.1: Iceberg Sighting Query Generation Layout
All of the buttons perform as before. The new database cross-referencing tool is named
“Sighting versus Flight Advanced Analysis Tool”. The function has been placed as a check box selection. The sighting databases can be independently queried as before when the tool is not selected. The tool is described in more detail in section 5.
2.2 Iceberg Data
Following the 2005 update [8], data entry inconsistencies with data originating from the Iceberg Management Database [9] were identified by NRC staff (Ann Collins). Several of the icebergs managed [9] corresponded to icebergs already entered into the database, but were numbered differently and therefore perceived as unique bergs.
Most of the errors occurred for the year 2000 largely due to the number of duplicate entries previously converted to a secondary sighting source. Iceberg sightings from the management database were given the flag number 10. The Sighting Database does not currently allow two flag entries for a single iceberg. The icebergs that were previously converted to a secondary source and that also corresponded to a managed iceberg were reverted to their original source and the affected sightings were re-flagged appropriately. Table 2.1 shows the affected icebergs.
Table 2.1: Renumbered Icebergs
Original Raw Data Previous Database Information New Database Format Case No.
Source Number Source Flag Number Source Flag Number
PAL 21 2 0 AMEC 141 AMEC 0 141 5 1 PAL* 00-21 PAL 10 00-21 PAL 10 21 PAL 32 2 0 AMEC 149 AMEC 0 149 5 2 PAL* 00-32 PAL 10 00-32 PAL 10 32 PAL 43 2 0 AMEC 150 AMEC 0 150 5 3 PAL* 00-43 PAL 10 00-43 PAL 10 43 PAL 48 2 0 AMEC 151 0 5 IIP 229 AMEC 7 151 6 4 PAL* 00-48 PAL 10 00-48 PAL 10 48 PAL 57 2 0 AMEC 173 AMEC 0 173 5 5 PAL* 00-57 PAL 10 00-57 PAL 10 57 PAL 68 2 0 AMEC 175 AMEC 0 175 5 6 PAL* 00-68 PAL 10 00-68 PAL 10 68 PAL 32 PAL 0 32 0 7
PAL* 00-32 PAL 10 00-32 PAL 10 32
* Entries originated from the iceberg management database
Table 2.2: Flag Number Definitions Sighting Source Converted Flag
Original Sighting Source Converted Sighting Source
2 Provincial Airlines Limited (PAL) AMEC
3 Provincial Airlines Limited (PAL) International Ice Patrol (IIP)
4 AMEC International Ice Patrol (IIP)
5 AMEC Provincial Airlines Limited (PAL)
6 International Ice Patrol (IIP) Provincial Airlines Limited (PAL)
7 International Ice Patrol (IIP) AMEC
8 International Ice Patrol (IIP) MEDS
Sighting Source Qualification
Database Entry Source Qualification
9 Collision Database The Ship-Ice Collision Database produced by Canatech et al
[11]
3.
FLIGHT INFORMATION DATABASE
3.1 General
A preliminary version of the flight information database was developed in the last database updating program [8] where the concepts were developed and partially applied to one year of flight information. All available data was inserted into the database and many of the concepts previously outlined were implemented in the current program.
3.2 Flight Data
The source flight message data and data extraction program were used. The Excel based VBA program developed previously [8] was used to decode and extract the required data from all of the available messages originating from 1986 to 2004, excluding 1992 to 1997. It is understood that Luc Desjardins of Canadian Ice Service is working toward completing data quality
verification for the missing years.
The extracted flight data was reviewed with respect to the process for converting these data from the original flight message format into data fields. The question to answer was whether the data fields extracted were appropriate to fulfill the purpose of the database. Flight data was extracted from individual flight messages and converted into two data sets:
(a) A summary table listing general flight parameters (Table 3.1), and
(b) A detailed table that provides the flight track information (i.e., positions, search areas, etc) for each individual leg of a flight (Tables 3.2, 3.3, 3.4).
The flight number is arbitrarily assigned to extracted flight datasets at BMT. The field was created as a referencing identifier due to the similarity between flight data. The Origin field refers to the country (e.g., CN for Canada, US for United States). The call sign is the aircraft identifier and the platform identification field describes the aircraft source. The platform type currently only contains a value of 1 which means “aircraft”. This field was included as a foundation for the potential of this database to include different platform types such as ships, stationary coastal observations or satellite surveillance in the future. The final field is the flight date.
Tables 3.2 through 3.4 show an example of the 26 columns of detailed flight track information included in the database for each flight.
Table 3.3: Detailed Flight Information: Columns 1 and 11 to 18
Table 3.2 contains all of the information directly extracted from the flight messages along with two calculated area values and the flight number. It should be noted that the original data contained in each row of the flight message is associated with each flight waypoint, whereas the calculated data corresponds to information associated with a flight leg. A flight leg is defined by two consecutive waypoints. The visibility is reported for radar and visual coverage for each flight leg. The data extracted for each way point include:
(a) positional latitudes and longitudes in decimal degrees;
(b) UTC time;
(c) radar sampling range to the left and right of the aircraft in kilometres; and (d) visual sampling range to the left and right of the aircraft in kilometres.
The radar and visual sampling areas are calculated by multiplying an “average visible width” by the flight leg length. The average visible width is the sum of the average of the ranges reported for each side of the aircraft between two way points. In the example shown in Figure 3.1, the average visible width is 35 km (i.e., Lavg + Ravg). If we assume the distance between waypoints A and B is 90 km, the area reported for this leg would be 3,150 sq. km (i.e., 35 km x 90 km).
Figure 3.1: Example Flight Leg Area Schematic
Tables 3.3 and 3.4 present columns 11 through 26 of the database. These contain the latitude and longitude coordinates that describe the calculated corners for the sampled areas for both the radar and visual surveys, respectively.
The points are reported in a clockwise order from the right side of the second way point of each leg, denoted here as “B”. The coordinates are currently used for plotting but may be used to calculate the total area of given flight in the future. Challenges with respect to flight leg area overlap were identified during the project. The issues encountered and possible solutions are described in more detail in section 5.
1 2
3.3 Database Development
The form layout was modelled after the new Iceberg Sighting Database layout. From the Flight Information Database tab, the user may select from one to four fields to query with the option between an “AND” and “OR” logical operator. The user can save an existing query, clear the current query entries and/or reset the form completely.
Figure 3.2: Flight Information Query Generation Layout
All of the buttons common to both databases perform in the same way. The flight database can be independently queried as well. To complete a deliverable product within the allowable
budget a few omissions were made. These should be rectified in a future update of the database. For example, the compounded query feature is absent. Currently, the user can only click the “Query” button once and then will need to reset and query from the main table again. The “Back” button query feature is also absent. It would remove the last compound query step. The “Bookmark” feature should be added to allow the Flight Database users to recall a previously completed query.
There are a couple of features unique to the Flight Information Database tab. The first is a new “Quick Area Tool” button, which was included to accommodate users interested in very specific geographical areas during a given analysis. The Quick Area Tool button allows the user to define maximum and minimum latitudinal and longitudinal limits to query the corresponding flights in one step.
The second new feature controls the data display. When a query is run, a list of the resulting flights is displayed, as in Table 3.1, and the “Show Flight Information” radio button is selected. The detailed flight information for a given flight, seen in figures 3.2 to 3.4, is accessible by clicking anywhere on the row of the flight of interest, and selecting the “Show Track Information” radio button.
Figure 3.4: Flight Data Radio Button Options
The database cross-referencing tool is also available from the Flight Information Database tab. It is accessed through a checkbox described in detail in section 5.
4.
INTERIM DEVELOPMENT PROGRAM
In earlier stages of the project, a data manipulation and calculation verification tool was created using Microsoft Visual Basic. The calculations included in the full database were developed using this tool. The program has two main functions:
(a) to convert flights positional of a single waypoint data into sampled boundary areas
described in section 3 (See Figure 3.1) for insertion into the database; and
(b) to provide a useful graphical and interactive tool, which allows for rapid elimination of algorithm development errors.
a) Main form
b) Boundary Mini-Chart Figure 4.1: Development Program Interface
The tool contains the same algorithms as the final database. Shown above, the “Main-Chart” shows the flight track, the user selected boundary of interest and the flight leg area boundary points. The “Mini-Chart” shows how the surveyed areas are cut off if they are outside the boundary. The flight leg area calculation is reported in the database, but not plotted. The area calculation is further discussed in section 6.
5.
CROSS REFERENCE TOOL
5.1 General
The Iceberg Sighting versus Flight Information Advanced Analysis Tool uses date and positional information of interest to determine how many unique icebergs were observed by a given flight or set of flights. It also provides the user with insight into the frequency of sampling for the selected time and location.
5.2 Query Designer
No matter which database the tool is called from, the query designer form shown in Figure 5.1 will appear. The inputs include a date range and positional latitude and longitude limits. The tool will extract those flights having either portions of or all of the flight data falling within the boundary and dates of interest as well as all the unique icebergs observed by each extracted flight.
5.3 Database Interaction
5.3.1 Iceberg Sighting Database
From the Iceberg Sighting Database tab, the tool will extract its default time and positional limits from the values found in the visible sighting data table. The query designer will then appear where these limiting values can be accepted or edited. The boundary information is considered the “User Input Criteria” for the advanced calculations. If the user proceeds, the program will:
(a) filter out any non-aircraft sighted data remaining in the sighting table;
(b) re-query the sighting data visible in the table if the User Input Criteria is altered;
(c) use the boundary information to query the flight data table based on date and position;
(d) Cross-reference the resulting icebergs and flights using the flight boundary information
(the algorithm will eliminate any duplicate icebergs on a given day); and
(e) present the results on the Advanced Tool Results tab.
Note that this method of cross-referencing the two databases may appear to provide erroneous iceberg positions in a case where an iceberg sighting may be located in an area perceived to be un-sampled by the aircraft. This phenomenon will occur near a waypoint where the aircraft has made a turn. The outer bank of the aircraft’s turn will be displayed as not sampled as
recommended by IIP (D. Murphy, IIP, personal communication) due to the unreliability of a radar system during a turn. However, the area may have been partially sampled and an iceberg sighted. These icebergs are counted and included in the database. The principal source of detection errors will stem from the level of accuracy of the reported visibility limits from the flight messages. Since the areas are averaged, as shown in Figure 3.1, it is also possible that an iceberg that was detected near the outer edge of a leg boundary may not be counted. This error is minimized when there is overlap in the leg boundaries, but not along the exterior boundary of a flight’s sample area.
5.3.2 Flight Information Database
From the Flight Information Database tab the tool will extract its default time and positional limits from the values within the visible flight data table. The query designer will allow the user to accept or edit the criteria. If the user proceeds, the program will:
(a) re-query the flight data if input criteria were edited; (b) cross over to the sighting database;
(c) filter out any non-aircraft data;
(d) use the boundary information to query the sighting data table based on the flight
boundaries; and
(e) present the results on the Advanced Tool Results tab.
The algorithms implemented are common to both interaction options. Since the code is common, the output results will match given identical input criteria from either database.
5.4 Cross-Reference Results Tab
A meaningful joining of flight area sampling and iceberg sighting data can be defined by a quantification of iceberg density or quantity per unit area. Due to a number of challenges with respect to an appropriate flight area calculation, only a nominal value of density is presented. These challenges are described further in section 6. The results information was divided into five sections as seen in Figure 5.2 and described below.
Figure 5.2: Advanced Tool Results Example
5.4.1 Advanced Analysis Inputs
This section displays the values used in the cross-referencing analysis. The analysis is based on when and where the flight took place and what the radar and observers detected during the flight. The first two questions are user inputs presented in this section.
5.4.2 Nominal Results
The nominal results section shows a calculated “Nominal Area” value in square kilometres which corresponds to the total area bounded by the user input coordinates. It also shows the “Total Sightings”, the number of unique icebergs sighted by all extracted flights within the bounded area, and the “Nominal Density” which is the ratio of the previous two values:
Area
Icebergs of
Number
Density= ⋅ ⋅ (5.1)
5.4.3 Flight and Sighting Global Results
The global results refer to the cross-referencing results for each flight detected within the user input range. The flight number and date are shown to distinguish flights from one another if more than one is found. The results table included on the Results tab was designed to relay similar information for the nominal results. The global case refers to radar and visual flight specific sampling areas, detected icebergs and resulting radar and visual iceberg densities. However, due to the challenges with respect to total area values (see Section 6), the total area values are not available in this database iteration.
5.4.4 Detailed Flight Leg Areas
This section displays the surface area covered by each leg of a selected flight. The flight is selected from the flight number list. The leg areas are also presented in square kilometers. It should be noted that this flight selector is also used for charting purposes and that the chart will plot only one flight at a time.
5.4.5 Charting Tools
The charting tools and chart displays are contained in this section. The plot will show the flight track, its associated icebergs, and the user input boundary line by default. There is a button that will plot and remove the radar sampling area leg boundaries (Figure 5.3) and one to plot or remove the visual sampling area leg boundaries.
The chart can also be edited by right clicking anywhere on the chart. Data can be added, removed, and saved directly from the component chart’s menus. Titles and labels can be
changed, added, or removed from the chart and the chart can be exported as a *.jpg graphics file.
5.4.6 Save Results Button
The results tab and the save results button are only accessible following the use of the Advanced Analysis Tool. The execution of the Advanced Analysis will generate the Advanced Tool Results tab. The Save Results button on the Advanced Tool Results tab saves the data from the individual queries and the cross-referencing results into one spreadsheet. Query findings are saved in MS Excel® format as before. By clicking the Save button, an Output Option dialog, seen in Figure 5.4 appears, noting that all data will be output.
Figure 5.4: Output Option Dialog
An example output results table is shown in Figure 5.5. The output data saved into the results workbook include:
(a) iceberg sighting data;
(b) the iceberg query string used to extract the data; (c) flight leg data;
(d) flight query string used to extract the flight data; and (e) the final results table.
Figure 5.5: Cross Reference Analysis Workbook Output
After conducting a simple query search of icebergs from the Iceberg Sighting Database tab, a user may wish to output this query result and not conduct a cross-reference analysis. Items (a) and (b) (listed previously) would be saved by clicking the save button on the Iceberg Sighting Database tab. The dialog in Figure 5.4 will appear with Output All Data unchecked.
Similarly, a user may wish to only run a query of Flight Information Data by interacting with the Flight Information Database tab. After a query is completed, click the Save button to save only the Flight Information listed (items (c) and (d) listed previously) to an Excel worksheet.
6.
FLIGHT LEG AREA CALCULATION
The flight leg area calculation is an initial interim step in achieving the total area calculation required for iceberg density flux calculations. The calculation methods used for the leg area values are outlined below. There are many ways that a flight leg area can intersect a geo-referenced boundary. Figure 6.1 illustrates several possible examples of leg area intersections.
Figure 6.1: Example Leg and Boundary Intersection Schematic
Leg area case 1 from Figure 6.1 shows a leg segment completely outside the area of interest. In this case, a zero leg area is calculated. Alternatively, an individual leg area can also lie
completely inside the area of interest, as illustrated by leg area case 7. As well, there are many other intersection possibilities where only part of the leg is bounded by the area of interest. Area
2 shows a perpendicular intersection where a rectangular shape results with 2 leg area corners
inside the boundary; area 5 has no leg corners inside the boundary, but encompasses a boundary corner resulting in a triangular area.
6.1 Bounded Leg Area Calculation
If an entire flight leg is contained within the user defined boundary of interest, the area of the leg for radar (AlegR) or visual ranges (AlegV) is the product of the leg length (L1-2), designated for
waypoints one (1) and two (2), and the total average radar or visual range from the left and right sides of the aircraft (Figure 3.1). The area calculation is defined by equation 6.1 for radar range values and similarly by equation 6.2 for visual range values:
] [ * 2 1 Lavg Ravg legR L R R A = − + (6.1) ] [ * 2 1 Lavg Ravg legV L V V A = − + (6.2)
6.2 Partially Bounded Leg Area Calculation
When only part of a flight intersects with the user defined area, the boundary line versus leg area line intersection points are determined and then used for the area calculation. The line equation
]
[y=mx+b for each flight leg area boundary line and each geographical boundary line are
found to determine if an intersection of these lines occurs. The intersections are used to define the final area surveyed. A special case exists if an intersection point is not found. This would be the case for 3 sides of area number 5. The points outside the boundary are replaced by the appropriate boundary corner coordinates.
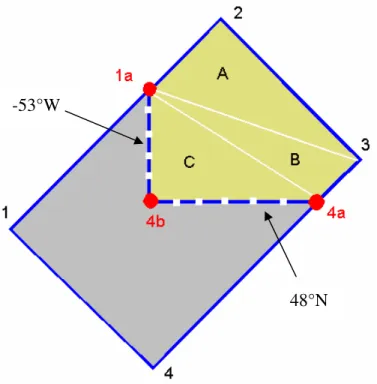
A final set of equations are used to calculate the reduced leg area. The shapes obtained by intersection can vary from 3 to 8-sided polygons due to the rectangular shape of both the leg area and the user input boundary area of interest. The algorithm is based on the sum of triangular shaped areas. Example case 8 seen in Figure 6.2 illustrates how this method is implemented.
Figure 6.2: Case 8 Triangle Area Schematic
Figure 6.2 first shows how the point intersection reassignment occurs. Segment 1-2 intersects with the -53°W boundary. The point outside the boundary (1) is replaced by the intersection point (1a). Segment 2-3 is inside the boundary therefore replacements are not made. Segment 3-4 intersects with the 3-48°N boundary. The point outside the boundary (3-4) is replaced by the intersection point (4a). Segment 4-1 shows both points outside the boundary. The first point of this segment (4) is reassigned to the nearest corner (4b).
The reduced area is now calculated. The triangular areas labelled A, B, and C are created using an anchor point. The anchor point is the “first” valid point, here named 1a. This point is
combined with the next two sequential points (2-3) to form triangle A. Point 2 is dropped, point 3 becomes the second point of the triangle, and point 4a is the third for triangular area B. Point 3 is excluded and point 4a becomes the second point, and 4b the third point of triangular area C. The sum of all triangles is the leg area reported on the results tab in the “Detailed Flight Leg Areas” section.
-53°W
7.
TOTAL FLIGHT AREA CALCULATION
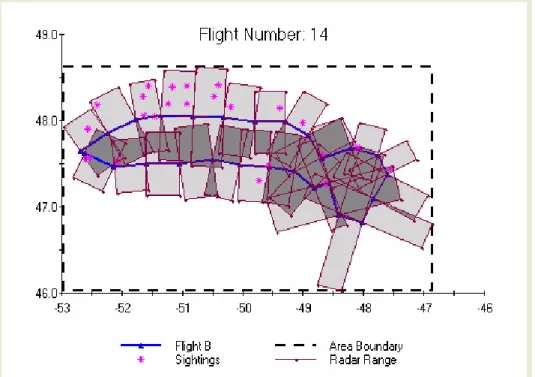
Prior to developing the interim visual basic program and determining the sampled leg area boundary way coordinates (Tables 3.2 to 3.4), the total areas were calculated as the sum of the individual parts. This simplistic method proved to be unacceptable due to irregularly shaped flight paths causing overlap of the varying radar and visual ranges. Flight number 14 initially shown in Figure 5.3 is an example of this trend. Figure 7.1 shows flight 14 with the radar range overlap highlighted.
Figure 7.1: Flight Number 14 with Radar Range Overlap Highlighted
A review of several flight paths from the year 2000 yielded a general observation that attempts are being made in the field to get full coverage (100%) over the areas surveyed during each flight. Considerable overlapping was detected for most flights. In some extreme cases, the total area calculated by simple summation of the leg areas shows a value greater that the boundary area due to the severe overlap.
Two alternatives were investigated to improve the accuracy of the calculation and a third was option was devised following the previous investigations:
(a) the development of a custom grid area tool;
(b) the use of an existing GIS software tool within or external to the database; and
7.1 Custom Grid Area Tool Method
The grid area method requires a program that would split the user defined area of interest into small grid squares, and would count the number of squares sampled by a given flight. The concept is shown schematically in Figure 7.2.
Figure 7.2: Grid Area Conceptual Schematic
This method will count each square only once regardless of overlap. Due to the intersection angles of the various flight paths, the drawback to this method in its current form is that it will always count the area of a complete square. The relative grid size selected would determine the accuracy of the resulting sampling area. The steps envisioned as the basis of the program are as follows.
(a) Create a coordinate grid array of reasonable size in order to balance the resulting accuracy with computation time. There are currently two options for the grid.
i. Define a universal grid stored in memory. The advantages of a universal grid of
reasonable size are that it would save some initial computation time as the grid array could be stored in an Access table, and there is a possibility of eliminating errors associated with coastal sampling where part of the area is on land. Grid cells found inland may be locked so that they could not be counted.
ii. Create a new geo-referenced grid for each user selected boundary area of interest. The advantage to this method is that the grid size could be made either very coarse for a quick idea of results at first glance, or very fine if the user desires greater accuracy.
A combination of the above two ideas would likely be the ideal implementation method. (b) Define intersection detection algorithm. Equations similar to those created for the area
calculation using line intersections would be feasible for this application. A grid square would have associated latitude and longitude coordinate values.
(c) Create the required looping algorithms. The algorithm would need to loop through the
grid squares and loop through the flight leg by leg to assign the binary value to each square. A condition would be implemented to reduce computation time so that if a grid square has already been sampled (binary = 1) then it can be skipped for the subsequent legs.
(d) Create the area calculation algorithm. Due to the curvature of the earth, 1° does not represent the same distance at different latitudes. A given row of squares will have equal surface areas. For each row, the number of sample squares is multiplied with the surface area of one square in that row. The row totals are summed to determine the grand total. The total area would then be reported in the “Flight and Sighting Global Results” section and used for the iceberg density calculation also reported in that section. Those fields are currently populated with “N/A” at all times.
7.2 Existing GIS software method
Various commercially-available GIS software programs were investigated as an alternative to creating a custom program, and coding using the “grid squares” method. Ideally, the goal was to find a program with an embeddable utility, compatible with MS Access® so that it could be internally linked to the database.
A second option considered was to use a stand alone software package that could be purchased independently by database end users. This option is slightly less desirable. The final analysis would become a function of a post-processing analysis step performed by the database user. To use this method, a data exporting feature would likely be required to convert the database information into a universal file format readable by most GIS software packages so that a user who already owns a GIS package would not need to purchase a second utility to use the database cross referencing tool.
In either case, the desired software functions include:
(a) accepting some formatted version of our flight leg coordinate data;
(b) allowing the conversion of these points into surface areas;
(c) allowing the union of the defined leg areas to form a single total flight sampling area;
(d) providing access to continental data information and enable land area subtraction if
needed; and
For users who do not already own GIS software, BMT conducted a search which identified over a dozen programs as being potentially suitable for this application. Eight of these were further investigated (Appendix A). These investigations reduced the list to 2 or 3 programs that were considered to be relatively suitable if a user did not already possess a GIS package:
(a) MapInfo Pro : An expensive tool with internet/server viewing capabilities; $2,300 to
$5,000 USD per license. Users could access this online, possibly via the NRC website.
(b) Didger 3: A stand alone package available for approximately $300 USD per license. A
demonstration version is available for download.
(c) MapViewer: A stand alone package which can be automatically run from within MS
Access. An individual license is approximately $250 USD. A demonstration version of this package is also available for download.
The MapInfo software was described as an extremely powerful tool that allows the owner (NRC) to share interactive results of the software over the internet. Users would only need a MapInfo viewer to access the NRC hosted information. In this case, all flight plots would need to be preassembled and stored on the website. The viewer would allow users to access existing information, but not edit. (Aside: The sales group indicated it would consider looking into the possibility of the development of an embeddable object. This option would be a separately funded endeavor with MapInfo.)
Didger 3 software appears to generally satisfy the function requirements for the database. It is also relatively inexpensive, at about $300 US. However, as a stand alone package, a user would need to learn how to use the software if they do not already own another GIS software tool, and complete the area calculations on their own.
MapViewer also appears to satisfy most requirements. In addition, it can be called directly from within the Access database so users would not need to complete an external area calculation. In this case however, the end user would need to purchase external software to automatically complete the density flux analyses.
There are several points to consider if the approach using an external software is implemented: (a) users are forced to use this software or equivalent. For some users (e.g., large oil
companies, government), significant efforts may be required for them to obtain permission, etc., to purchase the software, and install it on their computer;
(b) users would be unable to perform the analyses if the software became unavailable (e.g.,
company goes out of business or no longer supports it); (c) there may be resistance from users to purchase the software.
7.3 Integrate Total Flight Polygons and Area Intersections
To proceed with the flight information total search area based analyses, the flight track data need to be processed from its waypoint form into a valid search area. Two issues are of concern:
(a) preventing “double-counting” areas that have been searched – this is problematic for
cases where there is overlap between the flight legs (Figure 7.1); and
(b) only including the areas that were actually sampled – this is an issue where the flight legs were far apart.
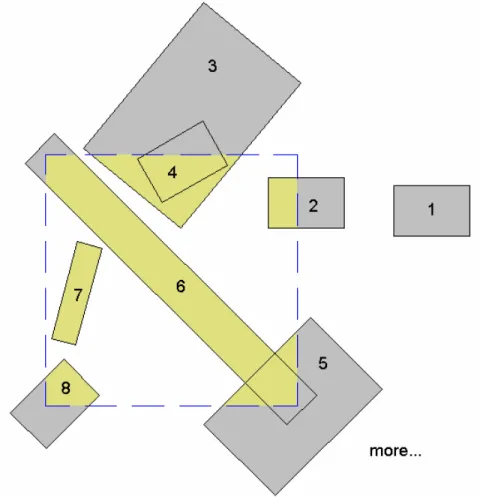
GIS software would be used one time to define the outer coordinates of a total flight area polygon (Figure 7.3b) and calculate the total flight area for all flights (for both radar and visual) from 1986 to the present. The coordinate and area data would be included as part of the Flight Information Database. This would be a large undertaking, but it is a one-time effort. BMT would complete the task using a GIS program.
a) Overlapping Flight Leg Areas b) Total Flight Area Polygon Figure 7.3: Example Flight Search Area
Similarly to the flight leg area calculation (Section 6), database routines would need to be developed to compute the area sampled of a given flight within a user selected query area. For the case where the flight is contained within the area of interest, the pre-calculated flight area is reported. The new routines would apply where the selected boundaries intersect the flight area.