ANALYSIS OF SIGNAL TRANSDUCTION NETWORKS USING
ACTIVATION RATIOS
by
Francisco Javier Femenia
S. M. Chemical Engineering Practice, Massachusetts Institute of Technology, June 2000 B. S. Chemical Engineering, University of California, Berkeley, May 1997
Submitted to the Department of Chemical Engineering in Partial Fulfillment of the Requirements for the Degree of DOCTOR OF PHILOSOPHY IN CHEMICAL ENGINEERING
at the
MASSACHUSETTS INSTITUTE OF TECHNOLOGY
February 2004
© Massachusetts Institute of Technology 2004. All rights reserved.
Author ... Department of Chemical Engineering December 5, 2003
Certified by ... Gregory Stephanopoulos Professor of Chemical Engineering Thesis Supervisor
Accepted by ... Daniel Blankschtein Professor of Chemical Engineering Chairman, Committee for Graduate Students
ANALYSIS OF SIGNAL TRANSDUCTION NETWORKS USING
ACTIVATION RATIOS
by
Francisco Javier Femenia
Submitted to the Department of Chemical Engineering on December 5, 2003 in Partial Fulfillment of the Requirements for the Degree of Doctor of Philosophy in Chemical Engineering
Abstract
The molecular processes by which information is incorporated and distributed within a cell are termed signal transduction. These pathways allow cells to interact with each other and with their environments and are critical to the proper cellular function in a variety of contexts. Previously developed methods for analyzing signaling networks have been largely ignored, most likely due to their mathematical complexity and difficulty in application. A novel analysis framework was developed to assist in the examination of signaling networks, both to facilitate the reconstruction of previously undetermined pathways as well as to quantitatively characterize interactions between components.
This approach, termed activation ratio analysis, involves the ratio between active and inactive forms of signaling intermediates at steady state. The activation ratio of an intermediate is shown to depend linearly upon the concentration of the activating enzyme. The slope of the line is defined as the activation factor, and is determined by the kinetic parameters of activation and inactivation. The mathematical functionality of the activation ratio changes for other signaling network arrangements. It is therefore possible to extract the original network structure from a set of measured activation ratios, with activation factors yielding a measure of activation potential between intermediates.
This framework was tested using computational simulations of a small-scale interconnected network, cascades with feedback, and in the presence of experimental noise. In the process, additional tools were developed to automate and evaluate the analysis. The theoretical concepts were also applied to examine the modification cycles of the protein Erk2 by the kinase Mek1 and phosphatases PTP1B and PP2A in vitro. Limitations in the accuracy of measurements and experimental setup resulted in high uncertainty in the calculated distribution of Erk states, preventing a quantitative analysis of this system. Nevertheless, qualitative predictions from activation ratio analysis were verified, in particular, the influence of component concentrations on the Erk distribution at steady state. While these issues indicate considerations for future experimental studies, they do not override the ability of activation ratio analysis to investigate signaling networks, where description of interactions in the whole system is more important than detailed examination of the individual steps.
Thesis Supervisor: Gregory Stephanopoulos Title: Professor of Chemical Engineering
For Dan and Lia In loving memory
Acknowledgements
The process of the Ph. D. is a long one, but fortunately, not a lonely one. Although the work described here was performed independently, I never would have been able to complete it if not for the support of many wonderful people. I owe a great many my sincere gratitude:
My advisor, Gregory Stephanopoulos, without which this work could never have been done. Thanks for providing a fantastic work environment, and for support, pressure, and patience when I needed them. My thesis committee members, Doug Lauffenburger, Peter Sorger, and (for a time) Martin Yarmush, for open ears, lively discussions, and advice to help me along my way.
My dear friend, colleague, former group- and office-mate, “academic sister” and perennial mentor, Maria Klapa, who has been teaching me since my first day at MIT and continues even now. I have strived to live up to her standard and example, as an exemplary scientist and a wonderful individual. I simply can’t imagine graduate school without her presence or guidance.
My current and former colleagues of the Stephanopoulos group, for providing advice, intellectual debate, a sympathetic ear, or a few laughs over years of coffee, lunch and bad pizza. Special thanks to Saliya Silva, Matt Wong, Bill Schmitt, Jatin Misra, Jose Aleman, Stelios Kouvroukoglou, Gary Jung, and Stefan Wildt.
Brett Roth, Ilda Moura, Janet Fisher, Elaine Aufiero, Suzanne Easterly, Anne Fowler, Jenn Shedd, Mary Keith, and Susan Lanza, for helping with so many little administrative things along the way (I’m sure, many I don’t even know about) that made life at MIT move much more smoothly. Joanne Sorrento and Frances Meale, for helping me juggle the schedules and keep track of three very busy professors.
The National Science Foundation (Graduate Research Fellowship) and Singapore-MIT Alliance for financial support, helping to give me the academic freedom to pursue a project a bit outside the normal realm of my advisor.
Tom Wang, Brian Bucher, Arvind Mallik, Wendy Prud’homme, Gwang-Soo Kim, and Sarah Spurgeon, for being roommates, friends, and family, all rolled up together. You helped make homes exactly that—homes, not mere apartments where I kept my things and slept. We didn’t just share a place to stay, but shared lives.
Friends from both coasts, so many that I dare not forget any, for standing by me and supporting me when I needed it, for giving me refuge when I needed that, and accepting my help when I could give it. Folks I knew before coming here: Vineet Gossain, Stacy Mar, Mike Lu, Khanh Ngo, Colleen Yeh, Khang Dao, George Tsao, Betty Chan, Brett Kurtin, Nizar Abdalla, Binita Bhattacharjee, Jimmy Lin, and Gopal Sridhar. And those I met and befriended along the way: Lily Koo, Connie Sun, Carmen Patrick, Hang Lu, Yonathan Thio, Casim Sarkar, Betty Yu, Inn Yuk, Klaudyne Hong, Lacey Southerland, and Lisa Wang. Others I may have missed in name, but you’re always in my heart. Without you, I never would have had the strength to get through the dark days or felt the joy celebrating the bright ones.
Poh Lim, Stan Hunter, Helena Chia, AJ Liuba, and other members past and present of the MIT Korean Karate Club, for great exercise and better friendship. Tae Kwon Do was not just a way to exercise in the cold winters, or to work out some frustrations, or clear my head from a long day—it was all of that, and so much more.
Last, but never least, my dear family, for bringing me up, nurturing me along the way, and supporting me through the years even without understanding just what I was up to. My father, whose love of science and engineering led me to where I am. My mother, whose compassion and determination helped me become who I am. My sister, whose consideration, intelligence, and courage have always showed me who I wanted to be. My “Uncle” Dan Larson, whose friendship with my father over decades gave me a perfect example of how friends should be. My Uncle Carlos and Aunt Lia, for showing me what family should be, too. And my Grandma Tota, for stories, for laughs, for that optimism that gave me a glimmer of hope when all was dark.
Thank you all, because without you, I never would have made it to and through MIT, never learned so much along the journey, and never gotten to my own “Ithaca”.
Table of Contents
Abstract... 3 Acknowledgements... 7 Table of Contents ... 9 Table of Figures... 11 Table of Tables... 14 1. INTRODUCTION... 15 1.1 Motivation... 17 1.2. Background... 191.2.1. Construction and application of models ... 19
1.2.2. Mathematical analysis techniques... 22
1.2.3. Measurement techniques and experimental considerations... 25
1.3. Objectives... 27
1.4. Thesis overview... 29
1.5. References ... 30
2. ACTIVATION RATIO ANALYSIS ... 35
2.1. Methods... 35
2.2. Isolated interconverting cycle... 36
2.3. Extension to simple network arrangements ... 43
2.3.1. Linear Cascade... 44
2.3.2. Converging Pathways ... 48
2.3.3. Diverging Pathways ... 51
2.3.4. Dual activation steps ... 52
2.3.5. Cascades with feedback ... 53
2.4. Saturating conditions and influence of enzyme-substrate complexes... 57
2.5. Conclusions... 63
2.6. References ... 65
3. NETWORK RECONSTRUCTION USING ACTIVATION RATIOS... 67
3.1. Concepts and Algorithm ... 67
3.1.1. Structural and numerical observability ... 67
3.1.2. Stepwise analysis of networks ... 69
3.1.3. Consistency... 71
3.2. Analysis of a Model Network ... 73
3.2.1. Network structure and features ... 73
3.2.2. Network analysis using free concentrations ... 74
3.2.3. Network analysis using total activation ratios ... 79
3.3 Automated regression of data and pattern assignment... 84
3.3.1. Methodology... 84
3.3.2. Model selection and evaluation ... 87
3.3.3. Example: cascade analysis in the presence of experimental noise ... 89
3.4. Conclusions... 97
4. ACTIVATION RATIO ANALYSIS OF ERK PHOSPHORYLATION... 99
4.1. Experimental system selection and design... 100
4.2. Development and Operation... 103
4.2.1. Materials and Methods... 103
4.2.2. Reaction operating conditions... 105
4.2.3. Enzyme immobilization... 109
4.3. Model for Interpreting ELISA Data... 114
4.3.1. Motivation and concepts ... 114
4.3.2. Selection of data... 121
4.3.2. Error analysis and model validation ... 123
4.4. Activation Ratios in Erk Phosphorylation Cycles... 129
4.4.1. Comparison of liquid-phase and immobilized reactions ... 129
4.4.2. Variation of total Erk concentration ... 135
4.4.3. Modulation of phosphatases ... 137
4.5. Conclusions... 140
4.6. References ... 141
5. CONCLUSIONS – FUTURE WORK... 145
5.1. References ... 147
6. APPENDICES ... 149
Appendix 1. Single cycle model ... 149
A1.1. Simulation details... 149
A1.2. MATLAB files... 150
Appendix 2. Parameter values for simple signaling models... 154
A2.1. Linear Cascade... 154
A2.2. Converging Cycles... 154
A2.3. Diverging Pathways ... 154
A2.4. Cascades with Feedback ... 154
Appendix 3. Model signaling network ... 155
Appendix 4. Extended cascade with noise ... 156
Table of Figures
Figure 2.1. Single cycle diagrams and reaction scheme. ... 36 Figure 2.2. Simulation results for simple binding under saturating conditions. A)
Fraction of A complexed ([A·B]/AT) or B) activation ratio ([A·B]/A) plotted against free B (circles) or BT (squares). ... 39
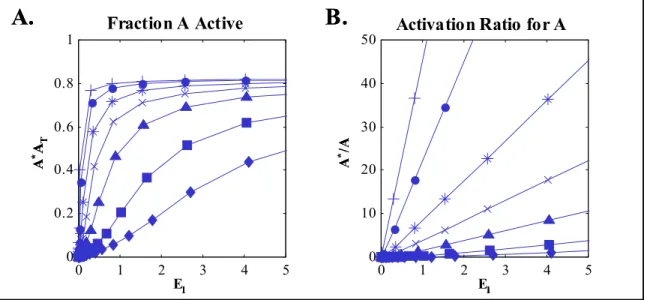
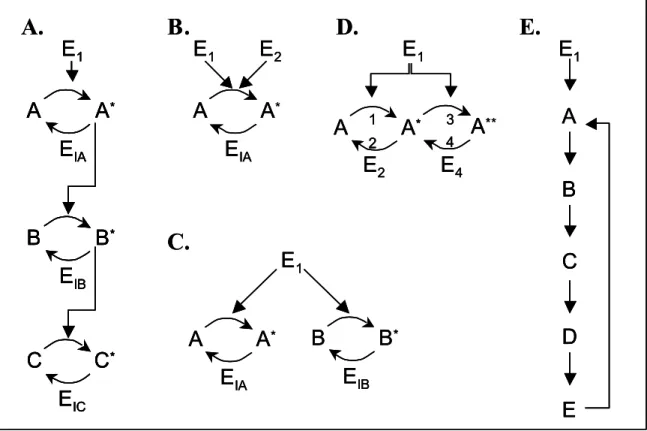
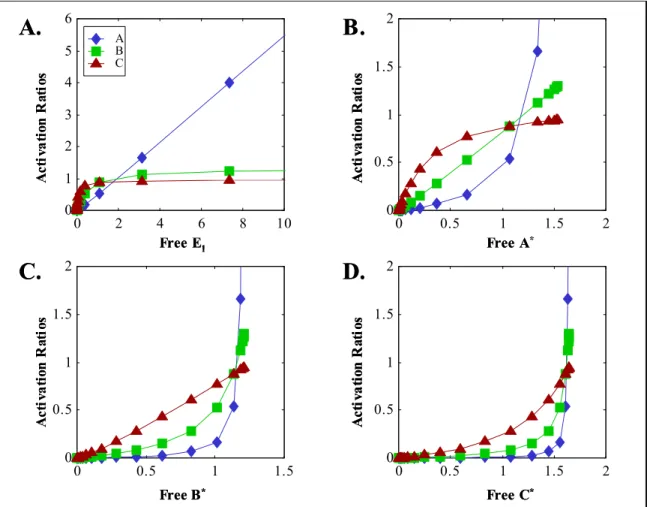
Figure 2.3. Simulation results for an individual covalent-modification cycle as shown in Figure 2.1. A) Fraction of A activated (A*/AT) and B) Activation ratios ARA (A*/A) for the simple cycle, plotted against free activating enzyme E1. Parameter values: k1 = 10, k2 = 10, Km2 = 1, E2T = 1, AT = 10, Km1 = 20 (diamonds), 10 (squares), 4 (triangles), 2 (x’s), 1 (stars), 0.4 (circles), 0.2 (+’s). ... 43 Figure 2.4. Diagrams of extended signaling structures. A) linear cascade, B) converging pathways, C) diverging pathways, D) dual activation steps, E) cascade with feedback (single-step activation as in A). ... 44 Figure 2.5. Activation ratios for the linear cascade of Figure 2.4A, plotted against free concentrations of E1 (A), A* (B), B* (C), or C* (D). Ratios for A: diamonds, B: squares, C: triangles... 47 Figure 2.6. Fractional activation and activation ratios for the converging cycle as shown in Figure 1C. A) and B), fractional activation (A*/AT), C) and D), activation ratio (A*/A) plotted against free activating enzyme E1 (A) and (C) or E2 (B) and (D). ... 50
Figure 2.7. Results for diverging branches in Figure 2.4C. A) Activation ratios for A (diamonds) and B (squares) plotted against free activating enzyme E1, B) Activation ratios for A and B plotted against each other, i.e. ARA against B* and ARB against A*. . 52
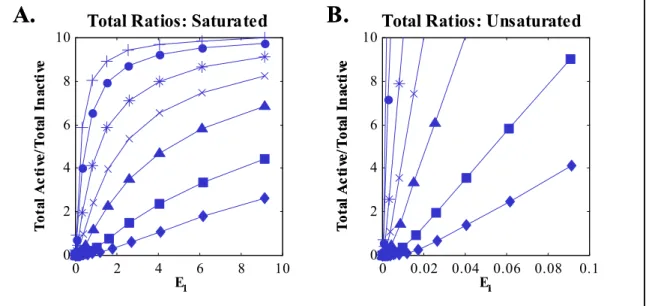
Figure 2.8. Activation ratios for cascade with positive feedback, unsaturated in feedback step (KFB >> AT), plotted against free E1 (A), A* (B), B* (C), C* (D). D* (E), or E* (F). For clarity, markers were omitted for activation ratios of A in pt. A. ... 55 Figure 2.9. Activation ratios for cascade with negative feedback, unsaturated in feedback step (KFB >> AT), plotted against free E1 (A), A* (B), B* (C), C* (D). D* (E), or E* (F). For clarity, markers were omitted for activation ratios of A in pt. A. ... 56 Figure 2.10. Total activation ratios for the isolated covalent modification cycle (using total active A*T and total inactive AT) plotted against free E1, with enzyme conditions A) Saturated: parameters as shown in Figure 2.3. B) Unsaturated: with EiT/Kmi < 0.1. ... 59
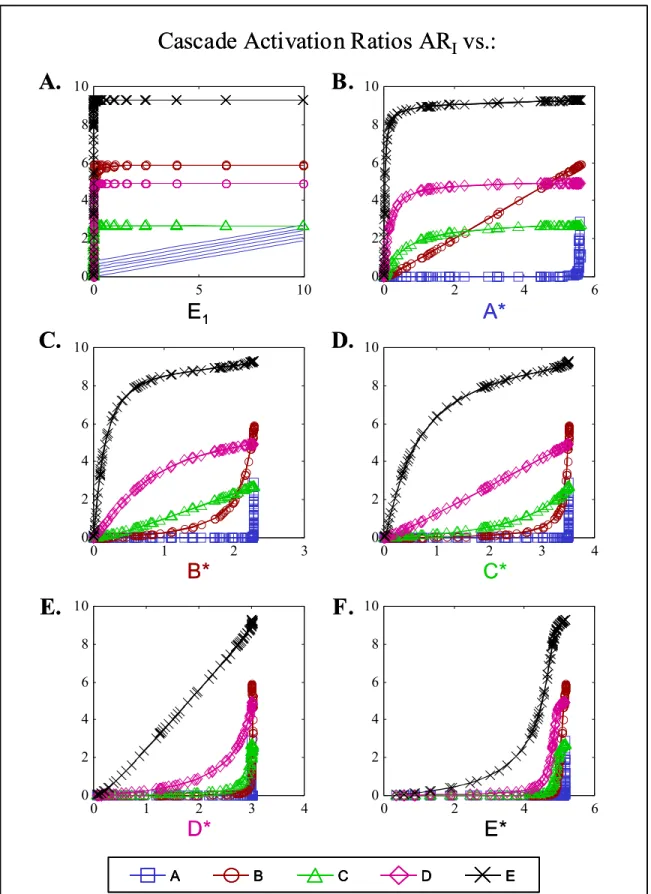
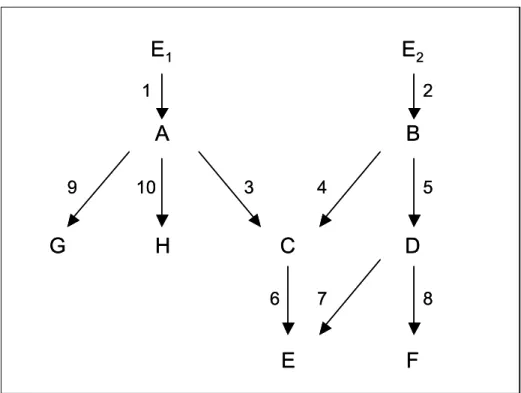
Figure 3.1. Network with parallel pathways. ... 68 Figure 3.2. Diagram of sample model network, showing activation reaction numbering. Model details and parameter values are included in Appendix 3. ... 73 Figure 3.3. Activation ratios for intermediates in model network of Figure 3.2, calculated using free species only, plotted against A) E1, B) A*, C) C*, D) E*, E) G*, and F) H*. In each case E2 = 0. ... 75
Figure 3.4. Activation ratios for intermediates in model network of Figure 3.2, calculated using free species only, plotted against A) E2, B) B*, C) C*, D) D*, E) E*, and F) F*. In each case E1 = 0. ... 76
Figure 3.5. Activation ratios for E (A and B) or F (C and D), plotted as contours against C* (constant D*, A and C) or D* (constant C*, B and D). ... 77 Figure 3.6. Total activation ratios for intermediates in model network of Figure 3.2, plotted against A) E1, B) A*, C) C*, D) E*, E) G*, and F) H*. In each case E2 = 0... 81
Figure 3.7. Total activation ratios for intermediates in model network of Figure 3.2, plotted against A) E2, B) B*, C) C*, D) D*, E) E*, and F) F*. In each case E1 = 0... 82
Figure 3.8. Total activation ratios for E (A and B) or F (C and D), plotted as contours against C* (constant D*, A and C) or D* (constant C*, B and D)... 83
Figure 3.9. Models used automated regression of activation ratio data, with graphical significance of parameters and half-saturation points shown. ... 85 Figure 3.10. A) Cascade structure and color scheme and B) Expected (and observed) output matrix Rji following automated regression analysis. ... 89
Figure 3.11. Activation ratios (symbols) and best-fit model curves (solid lines) for cascade of Figure 3.10A following automated regression. Activation ratios for A:
squares, B: circles, C: triangles, D: diamonds, E: x’s... 90 Figure 3.12. Activation ratios (symbols) and best-fit model curves (solid lines) for
cascade with noise added to activation ratios. The noise has a standard deviation of 40% of the true value. Symbols as in Figure 3.11... 93 Figure 3.13. Activation ratios (symbols) and best-fit model curves (lines) for cascade with noise added in active and inactive species. The noise has a standard deviation of 20% of the true value. Symbols as in Figure 3.11. ... 94 Figure 4.1. Immobilization of enzymes enables separation of free species from enzyme-substrate complexes. ... 101 Figure 4.2. Erk covalent modification cycles under action of Mek, PTP1B and PP2A. 103 Figure 4.3. Sample results for in vitro reactions using Erk as a substrate. A)
Phosphorylation by N4-Mek (5-10µL) or US-Mek (2µL) in different buffers (see text for composition). For Mek in EB, numbers signify µL Mek added (5+5 is 5µL N4-Mek+5µL EB). B) ErkPP dephosphorylation by 1µL phosphatases in RB with or without addition of inhibitors. OA: 100 nM Okadaic Acid, NaVO4: 1 mM sodium vanadate... 107 Figure 4.4. Phosphorylation of Erk in presence of N4-Mek, PTP1B, and PP2A. A) Dynamic time course of Erk phosphorylation using 0.1 µL of each enzyme. B)
Distribution of Erk forms after reaction for 2 hr... 108 Figure 4.5. Enzymatic activities following direct adsorption to polystyrene. A)
Phosphorylation of Erk using N4-Mek. B) Dephosphorylation of ErkPP using PTP1B (closed symbols) or PP2A (open symbols). Diamonds represent immobilized reaction conditions, while squares represent data taken for liquid-phase reactions. ... 110 Figure 4.6. Enzymatic activities following immobilization on Protein G-coated plates using capture antibodies without (A, C, E) or with (B, D, F) an extra blocking step. A and B) Phosphorylation of Erk by N4-Mek. C and D) Dephosphorylation of
phosphotyrosine- (PTP1B) or phosphoserine-containing (PP2A) peptides. E and F) Dephosphorylation of ErkPP by phosphatases. ... 111 Figure 4.7. Enzymatic activities following immobilization using capture antibodies directly adsorbed to plates. A) Phosphorylation of Erk by N4-Mek. B)
Dephosphorylation of ErkPP by phosphatases. C) Saturation of immobilization of PP2A. D) Phosphate release from phosphopeptides. Diamonds: immobilized enzymes, Squares: liquid-phase reactions, Triangles: enzymes remaining in supernatant liquid following immobilization. ... 113 Figure 4.8. Expectations for ELISA results with potential issues. A) Cross-reactivity of anti-Erk antibodies (taken from Yao et al [12]), B) Sigmoidal overall response containing an intermediate linear region. ... 114 Figure 4.9. ELISA data modeling and regression as two steps: first, rescaling of data using composition parameters, second, linear fit of resulting rescaled data. Circles: “D” (original ErkPP), squares: “T” (ErkPP + PTP1B), diamonds: “Y” (ErkPP + PP2A), triangles: “N” (ErkPP + both phosphatases)... 118 Figure 4.10. Sample results from ELISA standards regression. Symbols as in Figure 4.9. Solid lines represent model predictions using best-fit parameters... 119 Figure 4.11. Collection of data points from different samples and best-fit regression results. Data is the same as used in generation of Figure 4.10, with xT rescaled using model parameters. ... 120 Figure 4.12. Sample ELISA data, showing dependence of experimental variance on absolute signal. Diamonds: average signal (triplicate measurements). Squares: ratio of standard deviation to average value at each point. ... 122 Figure 4.13. A) Activation profiles and B) Activation Ratios for Erk cycles vs.
normalized volume of N4-Mek added, in liquid phase (closed symbols) or immobilized using capture antibodies (open symbols). “Low” (circles) signifies a maximum of 0.1 µL N4-Mek added, “Norm” (squares): 1 µL, “High” (triangles): 10 µL Mek... 131 Figure 4.14. A) Activation profiles (fraction Erk in each form) and B) Activation Ratios vs. volume Mek added, for Erk cycles in liquid phase, varying total concentration of Erk. ... 136 Figure 4.15. A) Activation profiles and B) Activation Ratios vs. volume Mek added, for Erk cycles in liquid phase, varying total amounts of both phosphatases... 138 Figure 4.16. A) Activation profiles and B) Activation Ratios vs. volume Mek added, for Erk cycles in liquid phase, varying total amounts of each phosphatase independently. 139
Table of Tables
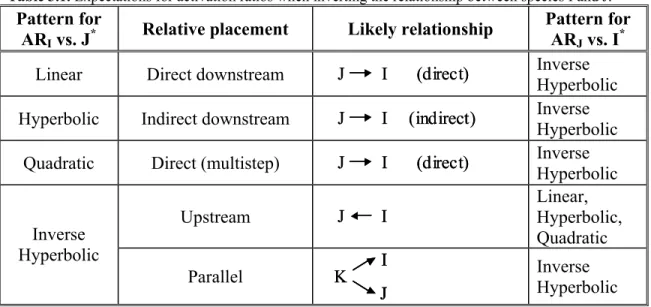
Table 2.1. Regression results for converging pathway, using parameter values from Figure 2.6. ... 49 Table 2.2. Summary of results for simple signaling systems: expressions for activation ratios... 63 Table 3.1. Expectations for activation ratios when inverting the relationship between species I and J. ... 72 Table 3.2. Activation ratio combinations for three-species structures... 72 Table 3.3. Regression results for simple network, using free activation ratios... 78 Table 3.4. Models and parameter bounds for automated regression of activation ratio data. Here ∆y = ymax–ymin, ∆x = xmax–xmin, yavg=(ymax+ymin)/2, and xavg=(xmax+ xmax)/2. x(y=yavg) signifies the value of x nearest to where y equals yavg, and vice versa for
y(x=xavg)... 86
Table 3.5. Results of automated regression/decision analysis for extended cascade in Figure 3.9A. Results shown are mean value from 10 replicate calculations in selecting an optimal model. 0 represents linear fit, 1 is hyperbolic fit, and –1 is inverse hyperbolic fit. See Figures 3.12-13 for example data... 91 Table 3.6. Worst-case results of automated regression/decision analysis for extended cascade in Figure 3.10A, where activation ratios have an added noise term of 40% of true value. Data is shown in Figure 3.12. Tables represent model with lowest AIC and
weights for each model. ... 95 Table 3.7. Worst-case results of automated regression/decision analysis for extended cascade in Figure 3.10A, where active and inactive concentrations have an added noise term of 20% of true value. Data is shown in Figure 3.13. Tables represent model with lowest AIC and weights for each model... 95 Table 4.1. Buffers used in experimental studies (final values). ... 105 Table 4.2. Conditions tested during optimization of enzyme immobilization, and details of final procedure... 113 Table 4.3. Parameter values from ELISA standards regression (data shown in Figures 4.9-4.11)... 126 Table 4.4. Comparison of predicted (from standards composition) and observed
(estimated from measurements) Erk amounts using mixtures of standards (D, T, Y, N) samples. 10 ng of each standard (20 ng total) was added to wells, and ELISA
measurements used with Equation 4.20 to calculate x. Predictions were calculated
1
1
INTRODUCTION
The normal operation of any cell can be imagined to consist of three interacting systems. The metabolism is comprised of the enzymes and intermediates involved in production of energy and synthesis, processing, and recycling of essential building blocks like amino acids, lipids and nucleotides from any materials available to the cell. The genetic system contains the DNA and RNA as well as the polymerases, splicing apparatus, ribosomes, and posttranslational machinery that together act to produce structural proteins and enzymes for all cellular reactions. The signaling system acts to recognize extracellular cues, relay them across the membrane, and transmit the information accordingly to help direct both the metabolic network, through changes in enzymatic or transporter activities, and the genetic network, though regulation of transcription factors. Of course, this simplified perspective neglects to explicitly consider physical components of the cell like the cytoskeleton or some of the systems involved in cell division such as DNA replication and chromosomal separation. But these aspects of cellular behavior also depend upon and interact with the systems described above, and contain components that in some cases can also be considered members of the metabolic, signaling or genetic networks.
Traditional efforts to discover and characterize individual components of each system have recently begun to give way to more encompassing “systems biology” initiatives. This is in part due to the level of detail to which many of the relevant pathways have already been described. Perhaps more importantly, it is a reflection of the desire to study molecules not in isolation but rather within the contexts of the cellular networks in which they interact. Detailed investigations of specific components provide much important information about the physical and chemical interactions of these molecules, but they cannot address the question of what the actual in vivo activity is in a particular cell type or set of environmental conditions. Instead, a set of measurements about the system must be combined with an analytical framework capable of processing the data.
There are already a variety of methods in place to reconstruct and characterize metabolic and genetic networks. In the case of metabolism, analysis of the flux, or throughput, between metabolic intermediates is used to provide a measure for the relative engagement of particular reactions as matter is transferred through pathways in the network, based on a set of steady-state mass balances around each intermediate [1]. This methodology has been extended to provide additional insight, such as identification of reversible reactions and cycles, by utilizing substrates labeled with radioactive or uncommon stable isotopes (e.g. 13C), measurement by nuclear magnetic resonance (NMR) or mass spectrometry (MS), and adding the appropriate isotopomer balances to the analysis [2]. The correlation between expression patterns for different genes, measured using DNA microarrays, across many sample types or over time has been used to identify connectivity between the genes and assign parameters reflecting the strength of interaction [3, 4]. More recently, analysis of time-lagged correlations has been used to order genes in sequence and therefore add directional information, which may be used to suggest causality [5].
At this time, no analogous method exists to translate measurements of the activation of particular signaling intermediates directly into putative network structures. The connectivity of signaling networks has been predicted by examination of databases describing protein-protein interactions based on two-hybrid experiments or by searching protein sequences for potentially interacting domains [6-8]. However, such approaches are not designed to incorporate information regarding activation of intermediates, and therefore cannot be applied to evaluate the activation of different signaling pathways under a particular set of experimental conditions. Structural identification of the signaling network is separated from a quantitative description, whereas ideally both can be accomplished with the same technique simultaneously.
The methods described above for study of metabolic or genetic systems unfortunately cannot be applied to examine signaling. Metabolic analysis methods depend upon mass flow between intermediates, which does not occur in signal transduction pathways. Genetic analysis depends in general upon the separation in time between activation of each intermediate: production of the corresponding protein is required to activate the next gene in sequence. In signaling, however, activation of one
step can begin before completion of the previous step. While some groups have previously attempted to modify existing tools for the study of signaling networks, in general their results have been mathematically intractable or experimentally infeasible and thus applied only sparingly. Therefore, it was apparent that a novel analysis framework was necessary for the study of signaling systems.
1.1 Motivation
Signal transduction processes allow cells to interact with each other and with their environments and are critical to the proper function of both unicellular eukaryotes and cells in a multicellular organism. Bacteria and yeasts utilize signaling pathways to sense and respond to environmental cues including food, osmotic pressure, or mating factors [9, 10]. In higher-order species including worms, fruit flies, mice and humans, signaling is used to direct proliferation and differentiation of embryonic stem cells into neural, muscle, bone and other tissues, to activate the immune response in macrophages and B and T lymphocytes, and to coordinate organs together, such as the action of insulin to simultaneously regulate liver, pancreatic, fat and muscle tissue following a meal [11-13]. These pathways are therefore centrally involved in the regulation of cellular behavior, from induction of growth and division, death (by apoptosis), movement and shape to even changes in phenotype, either in the metabolic state or patterns of gene expression [14]. Defects in signaling processes have been linked to a variety of diseases, most notably diabetes and cancer [15, 16].
Developing a more thorough understanding of signal transduction phenomena depends on the ability to analyze the simultaneous action of the elements involved. Thus, the same reasons that prompt research in signal transduction in the first place are also pertinent to developing analytical methods. A framework for analysis of signal transduction would give researchers a tool for experimental design, interpretation of results, and a way to visualize the breadth of effects that a signal can have. Together with improved methods in making measurements, this framework would enable the creation and evaluation of models of signal transduction. These could be used in understanding the processes of cellular development, stem cell differentiation, and progression of
disease. Furthermore, methods for analysis of signaling systems could be used for selection of drug targets, evaluation of efficacy, and observation of side effects.
Signal transduction pathways are, by nature, involved in the transfer of information; in many cases this takes the form of intermediates cycling between two or more states; the “information” is contained within the relative amounts of these states and how they influence the states of other intermediates. Individual steps typically involve a translocation of proteins to specific regions of the cell, activation of enzymes, covalent modification of proteins (particularly by phosphorylation), or production and translocation of small “second messenger” molecules, such as Ca2+, IP3, and cAMP [17, 18]. In each case, the state of one species will regulate the activity of an enzyme, either directly or indirectly. This enzyme then acts to modify a new target, and thus the state of one species can be used to direct a change in the state of one (or more) other species. A set of cascades and branching networks is created that ultimately ends at the level of transcription factors or metabolic enzymes. Depending on the specifics of each step, the cascades offer a method for both signal amplification and attenuation [19-23].
The past few decades have witnessed an explosion of research in biology, with a large amount of energy devoted towards the discovery and description of signal transduction phenomena. Completion of sequencing projects for genomes for a variety of organisms, from bacteria to humans, has yielded databases full of putative genes with unknown function, many of which may be involved in signal transduction. Technological advances in sequencing and identification of proteins, characterization and detection of posttranslational modifications, observation of protein-protein complexes, and subcellular microscopy have offered new tools for studying these processes. Powerful new computational techniques for protein and gene sequence alignment and homology identification have been used to classify newly discovered genes, suggest potential interaction partners, and predict catalytic activities. This has combined to give researchers a great number of possible signaling components, but not the ability to quickly identify where these molecules actually reside in the overall signaling network.
Frequently, signal transduction research attempts to investigate in detail particular molecules or short pathways. This approach has proven valuable in learning about
mechanisms of signaling, identification of characteristic domains, and provided information critical for prediction of putative signaling components from genomic and proteomic databases. However, the variety of cellular and effector systems used to study one molecule have yielded results that are sometimes contradictory, and often confusing, when combined with data for other molecules. Exogenous expression, use of knockout or constitutively active forms of intermediates, and investigation in a variety of cell types are all examples of cases where the study of one component, and how it affects other species, may not be reflective of its behavior in the unperturbed system. It is partly for this reason that signaling research is beginning to focus more on the response of networks, not individual components. Without methods in place to analyze data for entire signaling networks, however, it is difficult to integrate data from multiple sources, or more importantly, direct and interpret these systemic studies.
One of the most confusing areas in signaling research so far has been that of signaling specificity. An astounding number of different ligands, receptors, and intracellular signaling intermediates have been discovered and described. However, any particular cell type may respond very differently to the same ligand than another cell type, and the same cell type may respond differently to different ligands [24, 25]. Nevertheless many of the same pathways appear to be activated under a variety of different situations, although perhaps by different upstream mechanisms [26]. Understanding signaling specificity depends upon the ability to accurately describe how different cellular and environmental conditions influence the activation of the entire network.
1.2. Background
1.2.1. Construction and application of models
Models for signaling networks have been used as a tool to help investigate properties of these systems for nearly as long as research in signal transduction has been performed. In the lack of experiments that are easy to develop or without appropriate measurements, models can provide researchers a way to test theories on potential mechanisms. The level of detail can vary from quite abstract to highly detailed, depending upon the amount of information that is available and the particular focus of the
investigation. And while models have an inherent capacity to predict system behavior, it should be noted that they are always constructed so as to fit some sort of training data set. Therefore, models are typically limited in their ability to check their own consistency— i.e., they may not be able to identify inaccuracies in the presumed structure of the network, which would be hidden by the flexibility in values for adjustable parameters.
One way to avoid this problem is to utilize a relatively abstract model, which focuses on representing the network structure rather than mechanistic details. In that case the interaction between system nodes (signaling molecules or modules) is described as probabilities of signal transfer. The resulting models may be constructed in the form of Boolean, logical, neural, or stochastic Petri networks [27]. Structure identification is possible by first enumerating all possible connections between nodes, and nonzero probabilities after fitting to data indicate a structural connection, although an extremely large amount of data is required for this process [28]. On the other hand, models with predefined structure can be used to explore qualitative features of the system, including requirements for different modes of operation (as in T-cell activation vs. relaxation, or metabolic vs. mitogenic signaling by insulin) [29-31].
However, it is difficult to place a physical interpretation on the probabilities or connect them to a particular mechanism. Furthermore, it has been questioned whether signaling can even be thought of as a digital process [32]. To more accurately represent the signal-response characteristics of individual steps, Omholt used “switchlike” sigmoid functions to describe signal transfer during iron homeostasis, although at the expense of requiring additional parameters to describe each reaction [33]. As further modifications to the model are added, to incorporate additional detail regarding the mechanism of each step, the distinction from kinetic models is lost. It is likely that for this reason, such abstract approaches have only been sparingly used in examining signaling systems.
Detailed kinetic models have been used extensively to describe a variety of signaling systems [34-37]. Several groups focused on analyzing the behavior of a single intermediate cycling between two forms [38-40]. It was thus shown that such a signaling intermediate could show a sharp, “ultrasensitive” response to the amount of activating enzyme, reminiscent of the cooperativity seen in the binding of oxygen by hemoglobin
[38]. This behavior was dependent upon saturation of one or both enzymes operating to drive the cycle (zero-order ultrasensitivity), and was observed experimentally for activation of isocitrate dehyrogenase and glycogen phosphorylase [41-44]. Examination of models for short cascades showed that sequences of signaling steps could also yield sharp overall responses (multistep ultrasensitivity) [21, 23, 45-47]. Additional system features, including oscillations or bistability resulting from different feedback modes, interplay with scaffolding proteins, and the effects of multiple activation steps or limitation of diffusion of components across spatial gradients have also been considered [48-51]. Combination with models for receptor-ligand interactions and trafficking has yielded expansive descriptions of signaling induced by growth factors such as EGF [52-55].
Such approaches allow researchers to test theories about details of different mechanisms. However the analysis of model results is essentially qualitative; kinetic parameters could be varied over several orders of magnitude without significantly altering the overall behavior [49, 52, 55]. As the model complexity increases, so does the number of parameters and concentrations of intermediates that need to be included. Some are taken from independent experiments using enzymes purified in vitro, which calls into question the validity of the values for in vivo, as well as limiting model definition to only a few experimental systems. Others are fit to coincide with data but are rarely validated by additional experiments later, and again can be varied significantly without influencing the fit to experimental data, suggesting that the models may not be completely describing the experimental system.
While increasingly complex systems can be successfully simulated, detailed models nevertheless possess some serious limitations. The model complexity means that results become almost as difficult to interpret as the experimental results that they are trying to emulate. In general, errors in the structure (missing or incorrectly placed reactions or components) cannot be recognized. So models provide little insight on how newly discovered components or entire pathways could be incorporated into the analysis. Furthermore, they provide no easy method by which to gain a general perspective on what components play key roles in the signaling process. With the uncertainty present in the kinetic parameters, little can be said about the relative importance of different
pathways to yield the overall observed behavior. Such characterization generally requires the application of mathematical manipulations to define and extract descriptive parameters.
1.2.2. Mathematical analysis techniques
The basic concept behind an analysis framework is that structural and quantitative information about a system can be somehow inferred directly from the data, without having to construct a model (of any level of detail) ahead of time. A model may be used as a starting point to help develop insight into the behavior of the system, but the technique is developed by determining what the proper transformation of data should be, based on some sort of mathematical analysis. The final form of the analysis is independent of the original model, and thus truly describes an alternate method of examining the system.
Perhaps unsurprisingly, the majority of attempts to develop such a technique for the examination of signaling pathways have been based in extending methods originally developed for the analysis of regulation in linear metabolic pathways. Metabolic control analysis (MCA) was created to quantify the effects of changes in the enzyme activities (E) upon the steady-state flux (J) of mass through metabolic networks or the concentrations (X) of intermediates [56, 57]. These effects can be described in terms of the flux control coefficient (FCC) CEJ and concentration control coefficient (CCC) CEX:
E ln d J ln d E / dE J / dJ CJE = = (1.1) E ln d X ln d E / dE X / dX CXE = = (1.2)
MCA therefore amounts essentially to a sensitivity analysis, using control coefficients to describe the distribution of regulation that particular enzymes (and therefore particular steps in a pathway) have upon the overall flux. Similar expressions can be written in terms of changes to other system parameters, such as allosteric regulators or concentrations of other metabolites; these are usually called response coefficients (RPJ and RPX) to accentuate that these molecules act indirectly on the system. It should be noted that these coefficients are determined as total differentials, therefore arise from both the direct effects (upon a particular reaction) as well as indirect effects
(by altering concentrations of intermediates that regulate other reactions in the network). This can be seen by application of the so-called summation and connectivity theorems:
FCC summation: C 1 i J Ei =
∑
(1.3) FCC connectivity: j i E X J E 0 X C i j iε = ∀∑
(1.4) CCC summation: C 0 i X E j i =∑
(1.5) CCC connectivity: j k (1.6) i E X Xj E 1 (k j) X ,X ) j k ( 0 C i k i ∀ = − ≠ = ε∑
The local effects are described by the elasticities EX , defined as: i ε j j i X i X i E X lnX v ln X ln E ln ∂ ∂ = ∂ ∂ = ε (1.7)
The second equality in Equation 1.7 is based on the fact that the rate of a particular reaction is in general directly proportional to the enzymatic activity. If the kinetics of a particular reaction is known, then the elasticities can be obtained by differentiation of the rate expression. The elasticities and control coefficients can also be determined experimentally, using perturbations to each reaction step, by what is known as the double-modulation method and its extensions [58].
This approach was originally developed for the study of linear metabolic pathways, but through a series of steps has been extended to include cycles and pathways without mass transfer between intermediates [59-63]. Nevertheless, the basis of analysis was focused on measurement of changes in fluxes following changes to enzymatic activities. In signal transduction, the fluxes in question would correspond to the rate of interconversion between forms of each intermediate at steady state—to date, impossible to measure. Furthermore, each reaction step for each interconverting cycle must be included, leading to a prohibitively large number of different permutations required to fully examine the system. Thus these extensions of MCA have only rarely been applied directly to examine signaling systems [64-66].
A novel approach has been recently proposed that is instead based on examining changes to the steady-state concentrations of the intermediates themselves, and also reduces the complexity by separating the system into interacting modules, and focusing attention only on representative molecules each module [67, 68]. This method, called modular response analysis (MRA), utilizes connectivity theorems to translate how the intermodular response coefficients (describing the effect of a molecule from one module onto another module) will result in overall response coefficients for the system. This process can be inverted to determine the intermodular coefficients, which indicate structural connectivity as well as give a quantitative value for module interactions. However, the method suffers from the major limitation that to determine the coefficients, a perturbation must be applied that is specific to each module. For known signaling components, perturbations of the form of enzymatic inhibitors may be available, but that may not be the case for newfound species. And indirect connections arising from missing components (not measured or perturbed directly) will not be recognized with this methodology. Within the species that are being measured, the approach is able to reconstruct the network, but unable to determine exactly where missing steps might be.
Another analytical technique for studying reaction pathways was developed by using time-lagged correlations to infer connectivity between components [69]. The premise here is that the time-dependent behavior of two species will be most similar if they are connected in a reaction network. The correlations can be translated into a matrix of Euclidian distances, and through a series of steps designed to reduce the dimension of the data, a projection into 2D space that ultimately reflects the original structure of the system. Unfortunately, the algorithm does not always obtain the correct structure at the end of analysis; as the method is based on correlations in time then two subsystems with different timescales of operation may not be recognized as being connected. Also, this procedure requires a large number of dynamic data points, where input signals are modulated at a frequency on the same timescale as the remainder of reactions in the network, which for signal transduction would be seconds to minutes. It may be for this reason that this method has not been applied to examine signaling systems, although it has been tested on a segment of glycolysis constructed in vitro with purified enzymes [70].
1.2.3. Measurement techniques and experimental considerations
Any analysis of signaling pathways depends upon the ability to make quantitative measurements of how an external signal is influencing intracellular components. The complexity inherent in the analytical techniques described above may partially explain the relative lack of experimental applications thus far. But other complications either in design of experiments or methods of sampling may be playing a role. It is therefore worthwhile to consider the various techniques available for measuring signaling intermediates, and the limitations currently placed on conducting experiments.
Signal transduction proceeds through a wide range of different mechanisms, and therefore the ability to measure the amount of “active” intermediate depends on the characteristics of the signaling step. Molecules that are transported to different regions of the cell might be observed through microscopy or by sampling specifically from that region (membrane, cytosol, nucleus, vesicle, etc.). Some intermediates undergo covalent modification, typically by phosphorylation, and thus the modified form must be separated or detected specifically from its original unmodified form. Formation or dissolution of stable noncovalent complexes could be determined by coimmunoprecipitation. As these changes may coincide with induction of enzymatic activity, functional assays are often utilized if a substrate is readily available. Obviously, handling issues related to maintaining the active state become important, whether through appropriate composition of buffers (for example to include inactivating enzyme inhibitors) or sampling conditions (time, temperature, physical separations, etc.)
Furthermore, the type of molecule should be considered. Most signaling intermediates are proteins, therefore are relatively large (10-200 kDa), potentially membrane-bound, and containing complicated surface charges and chemistries. The physical properties of proteins are generally changed only slightly by covalent modification of a few residues. Therefore many protein detection methods involve the use of specific binding reagents such as antibodies, which can preferentially recognize the modified form of the protein. The Western blot is by far the most common method used to detect and quantify signaling proteins, but requires several tedious handling steps and can handle few samples at a time. The multiwell plate version of the assay (ELISA) is gaining popularity, because of the ability to handle more samples, be automated, and is
more readily quantified. Antibodies tagged with fluorophores can be used to track protein localization via microscopy, or protein presence by flow cytometry. In either case, the primary limitation in measurements is the availability of antibodies specific for each protein.
Mass spectrometry (MS) has increasingly been applied for the quantitation and characterization of signaling proteins [71]. One or more separation steps using electrophoresis (gel or capillary) or chromatography are combined with a digestion reaction with specific proteases such as trypsin before the peptides are then applied to the MS. Covalent modifications can be observed as a shift in the mass for a particular peptide in the protein. Quantitation is possible by mixing the test material with a control sample, where one of the two is labeled with a stable isotope to shift the mass slightly [72-74]. While MS-based techniques thus far have primarily been used to identify targets of input stimuli (profiling), it may soon become a dominant technique for protein quantification [74-77].
Unlike proteins, small molecule second messengers often may be measured directly. Phospholipids and their breakdown products can be separated by thin-layer chromatography (TLC) or HPLC and visualized if previously labeled with a fluorophore or radioactivity (32P, 3H or 14C) [78, 79]. Cyclic nucleotides (cAMP or cGMP) can also be separated from their native forms by TLC or alumina-based chromatography [80, 81]. On the other hand, Ca2+ concentrations in various regions of the cell are typically measured using secondary reagents, such as fluorescent dyes or enzymes like aeqorin and adenyl cyclase, that show altered activity in the presence of the ion [82-84].
Regardless of the type of molecule or analytical method used, the time and effort involved in preparing samples generally limits the reproducible sampling frequency to the order of minutes, similar in magnitude to the dynamics of most signaling reactions. Cost and time constraints may also reduce the number of measurements. Since most techniques are limited in capacity of measurements at one time, usually less than ten observations are made for any one molecule in an experiment. This is in stark contrast to the capacity of DNA microarrays to measure the expression thousands of genes at one time, and where the timescale of gene expression changes is in the tens of minutes. Thus
analysis of signaling systems must be performed with relatively small numbers of samples and under significant experimental uncertainty. Significant efforts are underway to develop various high-throughput techniques to measure proteins, which will help address the limitation of capacity, but not of sample handling [85-88]. Thus more signaling intermediates may be measured at one time, but for each protein there may still be only a few observations. Analysis techniques such as time-lagged correlations described in Section 1.2.2 would still be infeasible, and thus a new approach appears to be necessary.
1.3. Objectives
In general, when examining signaling networks two questions will arise: 1. What are the pathways involved in response to a particular stimulus? 2. How much are these pathways utilized?
It is by answering these questions that signaling under different conditions can be compared. The first question is essentially qualitative, and is solved by determining the structure of the signaling network downstream of a particular input. This requires not only knowledge of which components are activated, but also how their activation leads to that of other species—in other words, the connectivity of the signaling network. Quantitative descriptions of signaling, which specifically answer the second question, may also be necessary in structural identification. This is because multiple factors may activate some of the same pathways to saturation, and thus the response due to one factor may be concealed by another. With these questions in mind, it is possible to describe the important properties of signaling analysis methods.
First, a method capable of systemic, network analysis is needed, rather than an examination of individual pathways or components. No one pathway operates in isolation. It is likely that several unseen factors are simultaneously contributing to activate several pathways to produce the observed effect. Signaling networks are complex, with many possible interactions, and many different sets of external conditions must be compared [25, 26, 36]. Only by examining the full signaling network can interactions between different pathways be seen, and only then can the considerable
complexity of signaling interactions be deconvoluted. Therefore the method must be capable of examining the entire network, and not be dependent upon detailed descriptions of any one step.
Second, a quantitative approach is necessary. Although qualitative descriptions of signaling are important to know which pathways are involved in the response, it is only by measuring quantitatively the differences in signaling under different conditions that comparisons can truly be made [89]. Through a quantitative approach, values can be defined to represent signaling under different conditions and relative contributions of different pathways to the response. These values can then be compared between experiments to suggest which factors influence signaling. This necessarily requires that large-scale quantitative measurements of signaling must be available to decipher signal specificity. Furthermore, the measurement methods must be able to provide as much detail as possible about individual states of each component.
Finally, a practical method is required that allows visualization of in vivo activity under specific sets of conditions. It is of little use to develop analytical methods for study of signaling networks that are mathematically sound but cannot be applied to experimental data for signaling reactions within cells. Previous efforts to analyze signaling networks have been largely ignored, in some cases because of a dependence on unmeasurable values (such as the interconversion rate for a particular intermediate). On the other hand, it may be impossible to characterize signaling networks with measurements that are currently available. In that case, an analytical framework may be useful in directing what types of measurements are necessary for systems analysis.
The objective of this work therefore was to develop a novel analytical approach for the examination of signal transduction networks, with the specific understanding of limitations of experimental methods and lack of in vivo kinetic data. Of primary concern was that the framework could be readily applied for the structural analysis of a signaling network yet would still contain quantitative descriptions for the interactions between intermediates. This approach is also useful in experimental design, since it can be used to indicate the types, quantity, and quality of data that will be necessary. The framework should yield simple relationships for simple forms of interactions, and change
appropriately when more complicated interactions are considered, thus enabling the detection of these complicated interactions.
1.4. Thesis overview
Equations representing the time-dependent behavior of species in signaling systems were combined with simulations written in MATLAB 5.2 (Mathworks, Inc) to investigate how the activation of one component may be described in terms of the other species. The behavior of a single component cycling between two states was studied in detail as a model of the most fundamental unit in signal transduction. This led to the definition of activation ratios as an informative measure of the interaction between target and activator, where all kinetic constants for the reaction system are collapsed into one single factor. Extension to simplified network substructures, such as linear cascades, convergence and divergence points resulted in a set of observations for how the activation ratio for an individual intermediate reflects its position in a larger network. Details for the derivation of activation ratios and sample simulation results for these systems are discussed in Chapter 2.
These observations, however, represent how activation ratios are predicted to behave given a presupposed network structure. In order to invert this process, and thereby reconstruct a network from measurements, the addition of constraints based on self-consistency was required. The resulting algorithm is discussed in Chapter 3, along with an example of application to a small model network, where simulation results from a more detailed model were utilized as theoretical measurements. This process was partially automated using a MATLAB script to regress data against linear and nonlinear models and evaluate fit based on the Akaike Information Criteria. This enabled an examination of how issues with data quality could influence the analysis results.
Activation ratio analysis was applied to a real experimental system by studying the phosphorylation of protein kinase Erk2 in vitro, as described in Chapter 4. The experimental setup and tools for processing raw data were developed so as to provide the correct types of measurements needed to calculate activation ratios. Details for development of the system, optimization of reaction conditions, and tools for filtering data are also discussed. Variation of system parameters enabled verification of some
predictions for activation ratios, while highlighting the importance of improvements in measurement capabilities.
1.5. References
1. Stephanopoulos, G., A.A. Aristidou, and J. Nielsen, Metabolic engineering : principles and methodologies. 1998: Academic Press, San Diego.
2. Klapa, M.I., High resolution metabolic flux determination using stable isotopes and mass spectrometry, Ph D Thesis, Dept. of Chemical Engineering,
Massachusetts Institute of Technology, Cambridge, MA, 2001.
3. D'Haeseleer, P., S. Liang, and R. Somogyi, Genetic network inference: from co-expression clustering to reverse engineering. Bioinformatics, 2000. 16(8): p. 707-26.
4. Ronen, M., et al., Assigning numbers to the arrows: parameterizing a gene regulation network by using accurate expression kinetics. Proc Natl Acad Sci U S A, 2002. 99(16): p. 10555-60.
5. Schmitt, W.A., Extracting Transcriptional Regulatory Information From DNA Microarray Expression Data, Ph D Thesis, Dept. of Chemical Engineering, Massachusetts Institute of Technology, Cambridge, MA, 2003.
6. Pawson, T. and P. Nash, Assembly of cell regulatory systems through protein interaction domains. Science, 2003. 300(5618): p. 445-52.
7. Steffen, M., et al., Automated modelling of signal transduction networks. BMC Bioinformatics, 2002. 3(1): p. 34.
8. Yaffe, M.B., et al., A motif-based profile scanning approach for genome-wide prediction of signaling pathways. Nat Biotechnol, 2001. 19(4): p. 348-53.
9. Gustin, M.C., et al., MAP kinase pathways in the yeast Saccharomyces cerevisiae. Microbiol Mol Biol Rev, 1998. 62(4): p. 1264-300.
10. Hellingwerf, K.J., et al., Current topics in signal transduction in bacteria. Antonie Van Leeuwenhoek International Journal of General and Molecular Microbiology, 1998. 74(4): p. 211-227.
11. Whitehead, J.P., et al., Signalling through the insulin receptor. Curr Opin Cell Biol, 2000. 12(2): p. 222-8.
12. Tanaka, S., et al., Signal transduction pathways regulating osteoclast differentiation and function. J Bone Miner Metab, 2003. 21(3): p. 123-33. 13. Nordin, A.A. and J.J. Proust, Signal transduction mechanisms in the immune
system. Potential implication in immunosenescence. Endocrinol Metab Clin North Am, 1987. 16(4): p. 919-45.
14. Ferrell, J.E., Jr., MAP kinases in mitogenesis and development. Curr Top Dev Biol, 1996. 33: p. 1-60.
15. Marx, J., Unraveling the causes of diabetes. Science, 2002. 296(5568): p. 686-9. 16. Spencer, V.A. and J.R. Davie, Signal transduction pathways and chromatin
structure in cancer cells. J Cell Biochem Suppl, 2000. Suppl 35: p. 27-35. 17. Berridge, M.J., The molecular basis of communication within the cell. Sci Am,
1985. 253(4): p. 142-52.
19. Brown, G.C., J.B. Hoek, and B.N. Kholodenko, Why do protein kinase cascades have more than one level? Trends Biochem Sci, 1997. 22(8): p. 288.
20. Ferrell, J.E., Jr., How responses get more switch-like as you move down a protein kinase cascade [letter; comment]. Trends Biochem Sci, 1997. 22(8): p. 288-9. 21. Ferrell, J.E., Jr., Tripping the switch fantastic: how a protein kinase cascade can
convert graded inputs into switch-like outputs [see comments]. Trends Biochem Sci, 1996. 21(12): p. 460-6.
22. Ferrell, J.E., Jr., Building a cellular switch: more lessons from a good egg. Bioessays, 1999. 21(10): p. 866-70.
23. Goldbeter, A. and D.E. Koshland, Jr., Ultrasensitivity in biochemical systems controlled by covalent modification. Interplay between zero-order and multistep effects. J Biol Chem, 1984. 259(23): p. 14441-7.
24. Marshall, C.J., Specificity of receptor tyrosine kinase signaling: transient versus sustained extracellular signal-regulated kinase activation. Cell, 1995. 80(2): p. 179-85.
25. Weng, G., U.S. Bhalla, and R. Iyengar, Complexity in biological signaling systems. Science, 1999. 284(5411): p. 92-6.
26. Schwartz, M.A. and V. Baron, Interactions between mitogenic stimuli, or, a thousand and one connections. Curr Opin Cell Biol, 1999. 11(2): p. 197-202. 27. Bray, D., Protein molecules as computational elements in living cells. Nature,
1995. 376(6538): p. 307-12.
28. Bray, D., Intracellular signalling as a parallel distributed process. J Theor Biol, 1990. 143(2): p. 215-31.
29. Kaufman, M., F. Andris, and O. Leo, A logical analysis of T cell activation and anergy. Proc Natl Acad Sci U S A, 1999. 96(7): p. 3894-9.
30. Shymko, R.M., P. De Meyts, and R. Thomas, Logical analysis of timing-dependent receptor signalling specificity: application to the insulin receptor metabolic and mitogenic signalling pathways. Biochem J, 1997. 326(Pt 2): p. 463-9.
31. Shymko, R.M., et al., Timing-dependence of insulin-receptor mitogenic versus metabolic signalling: a plausible model based on coincidence of hormone and effector binding. Biochem J, 1999. 339(Pt 3): p. 675-83.
32. Agutter, P.S. and D.N. Wheatley, Information processing and intracellular 'neural' (protein) networks: considerations regarding the diffusion-based hypothesis of Bray. Biol Cell, 1997. 89(1): p. 13-18.
33. Omholt, S.W., et al., Description and analysis of switchlike regulatory networks exemplified by a model of cellular iron homeostasis. J Theor Biol, 1998. 195(3): p. 339-50.
34. Asthagiri, A.R. and D.A. Lauffenburger, Bioengineering models of cell signaling. Annual Review of Biomedical Engineering, 2000. 2: p. 31-53.
35. Neves, S.R. and R. Iyengar, Modeling of signaling networks. Bioessays, 2002. 24(12): p. 1110-7.
36. Bhalla, U.S. and R. Iyengar, Emergent properties of networks of biological signaling pathways. Science, 1999. 283(5400): p. 381-7.
37. Tyson, J.J., Models of cell cycle control in eukaryotes. J Biotechnol, 1999. 71(1-3): p. 239-44.
38. Goldbeter, A. and D.E. Koshland, Jr., An amplified sensitivity arising from covalent modification in biological systems. Proc Natl Acad Sci U S A, 1981. 78(11): p. 6840-4.
39. Varon, R. and B.H. Havsteen, Kinetics of the transient-phase and steady-state of the monocyclic enzyme cascades. J Theor Biol, 1990. 144(3): p. 397-413.
40. Stadtman, E.R. and P.B. Chock, Superiority of interconvertible enzyme cascades in metabolic regulation: analysis of monocyclic systems. Proc Natl Acad Sci U S A, 1977. 74(7): p. 2761-5.
41. LaPorte, D.C. and D.E. Koshland, Jr., Phosphorylation of isocitrate
dehydrogenase as a demonstration of enhanced sensitivity in covalent regulation. Nature, 1983. 305(5932): p. 286-90.
42. Meinke, M.H., J.S. Bishop, and R.D. Edstrom, Zero-order ultrasensitivity in the regulation of glycogen phosphorylase. Proc Natl Acad Sci U S A, 1986. 83(9): p. 2865-8.
43. Meinke, M.H. and R.D. Edstrom, Muscle glycogenolysis. Regulation of the cyclic interconversion of phosphorylase a and phosphorylase b. J Biol Chem, 1991. 266(4): p. 2259-66.
44. Shacter, E., P.B. Chock, and E.R. Stadtman, Regulation through
phosphorylation/dephosphorylation cascade systems. J Biol Chem, 1984. 259(19): p. 12252-9.
45. Chock, P.B. and E.R. Stadtman, Superiority of interconvertible enzyme cascades in metabolite regulation: analysis of multicyclic systems. Proc Natl Acad Sci U S A, 1977. 74(7): p. 2766-70.
46. Varon, R., et al., Kinetic analysis of reversible closed bicyclic enzyme cascades covering the whole course of the reaction. Int J Biochem, 1994. 26(6): p. 787-97. 47. Varon, R., et al., Kinetic analysis of the opened bicyclic enzyme cascades. Biol
Chem Hoppe Seyler, 1994. 375(6): p. 365-71.
48. Kholodenko, B.N., Negative feedback and ultrasensitivity can bring about oscillations in the mitogen-activated protein kinase cascades. Eur J Biochem, 2000. 267(6): p. 1583-8.
49. Huang, C.Y. and J.E. Ferrell, Jr., Ultrasensitivity in the mitogen-activated protein kinase cascade. Proc Natl Acad Sci U S A, 1996. 93(19): p. 10078-83.
50. Ferrell, J.E., Jr., How regulated protein translocation can produce switch-like responses. Trends Biochem Sci, 1998. 23(12): p. 461-5.
51. Levchenko, A., J. Bruck, and P.W. Sternberg, Scaffold proteins may biphasically affect the levels of mitogen-activated protein kinase signaling and reduce its threshold properties. Proc Natl Acad Sci U S A, 2000. 97(11): p. 5818-23. 52. Brightman, F.A. and D.A. Fell, Differential feedback regulation of the MAPK
cascade underlies the quantitative differences in EGF and NGF signalling in PC12 cells. FEBS Lett, 2000. 482(3): p. 169-74.
53. Haugh, J.M., A. Wells, and D.A. Lauffenburger, Mathematical modeling of epidermal growth factor receptor signaling through the phospholipase C pathway: mechanistic insights and predictions for molecular interventions. Biotechnol Bioeng, 2000. 70(2): p. 225-38.
54. Schoeberl, B., et al., Computational modeling of the dynamics of the MAP kinase cascade activated by surface and internalized EGF receptors. Nat Biotechnol, 2002. 20(4): p. 370-5.
55. Kholodenko, B.N., et al., Quantification of short term signaling by the epidermal growth factor receptor. J Biol Chem, 1999. 274(42): p. 30169-81.
56. Kacser, H. and J.A. Burns, The control of flux. Symp Soc Exp Biol, 1973. 27: p. 65-104.
57. Heinrich, R. and T.A. Rapoport, A linear steady-state treatment of enzymatic chains. General properties, control and effector strength. Eur J Biochem, 1974. 42(1): p. 89-95.
58. Acerenza, L. and A. Cornish-Bowden, Generalization of the double-modulation method for in situ determination of elasticities. Biochem J, 1997. 327(Pt 1): p. 217-24.
59. Fell, D.A. and H.M. Sauro, Metabolic control and its analysis. Additional relationships between elasticities and control coefficients. Eur J Biochem, 1985. 148(3): p. 555-61.
60. Small, J.R. and D.A. Fell, Covalent modification and metabolic control analysis. Modification to the theorems and their application to metabolic systems
containing covalently modifiable enzymes. Eur J Biochem, 1990. 191(2): p. 405-11.
61. Small, J.R. and H. Kacser, Responses of metabolic systems to large changes in enzyme activities and effectors. 1. The linear treatment of unbranched chains. Eur J Biochem, 1993. 213(1): p. 613-24.
62. Hofmeyr, J.H., H. Kacser, and K.J. van der Merwe, Metabolic control analysis of moiety-conserved cycles. Eur J Biochem, 1986. 155(3): p. 631-41.
63. Kacser, H., Recent developments beyond metabolic control analysis. Biochem Soc Trans, 1995. 23(2): p. 387-91.
64. Korzeniewski, B. and G.C. Brown, Quantification of the relative contribution of parallel pathways to signal transfer: application to cellular energy transduction. Biophys Chem, 1998. 75(1): p. 73-80.
65. Fell, D.A., Signal transduction and the control of expression of enzyme activity. Adv Enzyme Regul, 2000. 40: p. 35-46.
66. Krauss, S. and M.D. Brand, Quantitation of signal transduction. Faseb J, 2000. 14(15): p. 2581-8.
67. Bruggeman, F.J., et al., Modular response analysis of cellular regulatory networks. J Theor Biol, 2002. 218(4): p. 507-20.
68. Kholodenko, B.N., et al., Untangling the wires: a strategy to trace functional interactions in signaling and gene networks. Proc Natl Acad Sci U S A, 2002. 99(20): p. 12841-6.
69. Arkin, A. and J. Ross, Statistical Construction of Chemical-Reaction Mechanisms From Measured Time-Series. Journal of Physical Chemistry, 1995. 99(3): p. 970-979.
70. Arkin, A., P.D. Shen, and J. Ross, A test case of correlation metric construction of a reaction pathway from measurements. Science, 1997. 277(5330): p. 1275-1279. 71. Resing, K.A. and N.G. Ahn, Applications of mass spectrometry to signal
![Figure 2.2. Simulation results for simple binding under saturating conditions. A) Fraction of A complexed ([A·B]/A T ) or B) activation ratio ([A·B]/A) plotted against free B (circles) or B T (squares)](https://thumb-eu.123doks.com/thumbv2/123doknet/14174748.475106/39.918.137.782.111.407/figure-simulation-results-saturating-conditions-fraction-complexed-activation.webp)