Publisher’s version / Version de l'éditeur:
Proceedings. The 5th International Conference on Processing & Manufacturing of Advanced Materials (THERMEC 2006),, 2006-07-04
READ THESE TERMS AND CONDITIONS CAREFULLY BEFORE USING THIS WEBSITE.
https://nrc-publications.canada.ca/eng/copyright
Vous avez des questions? Nous pouvons vous aider. Pour communiquer directement avec un auteur, consultez la première page de la revue dans laquelle son article a été publié afin de trouver ses coordonnées. Si vous n’arrivez pas à les repérer, communiquez avec nous à [email protected].
Questions? Contact the NRC Publications Archive team at
[email protected]. If you wish to email the authors directly, please see the first page of the publication for their contact information.
NRC Publications Archive
Archives des publications du CNRC
This publication could be one of several versions: author’s original, accepted manuscript or the publisher’s version. / La version de cette publication peut être l’une des suivantes : la version prépublication de l’auteur, la version acceptée du manuscrit ou la version de l’éditeur.
Access and use of this website and the material on it are subject to the Terms and Conditions set forth at
Processing and Properties of Iron-Based Metallic Foams
Lefebvre, Louis Philippe; Gauthier, Maxime; Patry, Mario
https://publications-cnrc.canada.ca/fra/droits
L’accès à ce site Web et l’utilisation de son contenu sont assujettis aux conditions présentées dans le site LISEZ CES CONDITIONS ATTENTIVEMENT AVANT D’UTILISER CE SITE WEB.
NRC Publications Record / Notice d'Archives des publications de CNRC: https://nrc-publications.canada.ca/eng/view/object/?id=e8af8c65-c9ae-467c-b055-208447a3b384 https://publications-cnrc.canada.ca/fra/voir/objet/?id=e8af8c65-c9ae-467c-b055-208447a3b384
PROCESSING AND PROPERTIES OF IRON-BASED METALLIC FOAMS Louis Philippe Lefebvre, Maxime Gauthier and Mario Patry
Industrial Materials Institute/National Research Council Canada, 75 de Mortagne, Boucherville, Québec, Canada J4B 6Y4
ABSTRACT
A process based on a powder metallurgy approach was developed to produce open-cell metallic foams. A metallic powder, a solid polymeric binder and a chemical foaming agent are dry-mixed together. The molded mixture is then heat-treated in a three-step thermal treatment including foaming, debinding and sintering. This paper describes the microstructure and properties of iron-based foams (pure Fe and Fe-1.05%C) obtained with this process.
The final material is highly porous (90% porosity) and has an interconnected porosity network. The structure of the resulting material is relatively complex and has 3 levels of porosity (i.e. main cells, windows and microporosity). The compressive mechanical properties are affected by the density and composition of the material. Compressive properties (i.e. compressive yield strength, modulus, energy absorbed at densification) increase with density. In addition, the compressive yield strength and energy absorbed at densification increase significantly while the modulus is little affected by the carbon content. The material structure and properties are interesting for light weight structures and energy absorption. The process is relatively simple and the materials produced provide a low cost alternative to aluminum foams. INTRODUCTION
Metallic foams have a combination of interesting properties (low density, good specific mechanical properties, fluid permeability, high surface area, good thermal resistance, high electric conductivity and magnetic permeability). Production of these new materials is possible through many different processes. Good reviews of these manufacturing processes as well as the properties of the resulting porous metals are provided in various publications [1,2,3,4,5,6].
The automotive community has recently expressed an interest for metallic foams, mostly for energy absorption to improve crash worthiness of vehicles. While the specific performances of aluminum foams are very interesting, these materials haven’t found large volume applications yet, mainly due to the material’s cost. The performance of aluminum foams presently available commercially is usually
proportional to their cost and the appropriate performance/cost ratio has not yet been obtained for large scale automotive applications.
There is an interest in developing materials and processes allowing the production of foams at low cost. While steel is a relatively inexpensive material and has good mechanical properties, little work has been done on steel foams [7,8,9,10]. This comes mainly from difficulties in producing large components of highly porous steel foams having good properties at reasonable cost.
A process has been recently developed to produce open-cell metallic foams [11]. A schematic of the process is given in Figure 1. A metallic powder, a solid polymeric binder and a foaming agent are dry-mixed and molded into the desired shape. The molded powder is then heat-treated to foam, debind and sinter the material. During the foaming step, the binder melts and flows around the metallic particles. Once the binder is liquefied, the foaming agent starts to decompose and generates a gas that expands the material. After the foaming step, the material is a polymer foam charged with metallic particles. The material is then treated at higher temperature to decompose the polymer and finally to consolidate the material by sintering the metallic particles.
PROCESS STRUCTURE EVOLUTION
Figure 1: Schematic representation of the metallic foam production process.
This process has been used to produce different types of materials (copper, nickel, titanium and Ti alloys, iron and steel). The pore size and density can be controlled by varying the powder formulation and the foaming conditions. The powder does not have to be compacted at high density, making the processing of the material relatively easy. Foaming takes place at low temperature (lower than 200°C) and can be done in a simple oven. Consolidation occurs below the melting temperature of the material, making the integration of the foams with other structures (such as sandwich panels) relatively easy. All these characteristics make the process attractive for the production of iron/steel foams at reasonable cost. This paper presents the structure and properties of iron-based, open-cell foams produced with the process. The powder formulation and foaming conditions were fixed for the purpose of this study. The
Metal Powder Foaming Agent Binder Mixing Foaming Molding Pyrolysis Sintering Debinding Powder blend Foaming Pyrolysis/Sintering 500ºC/700-1200ºC
Iron particles Binder particles Foaming agent
Iron/polymer suspension Foaming agent decomposition Iron Pores
microstructure and properties of the materials along with the different processing steps are presented and discussed.
EXPERIMENTAL PROCEDURE
Pure iron foams were produced using water atomized iron powder (Figure 2). The material was foamed into 22.5 cm diameter and 3 cm thick discs. After foaming, cylinders (D = 3.4 cm ; thickness = 2.4 cm) were machined from the discs. These cylinders were then submitted to a debinding treatment in a tube furnace at 500°C for 4 h in a dry air stream and sintered in Ar-50%H2 for 2 h at 1200°C. Some of the pure
iron foams obtained were then submitted to a carburization treatment to obtain Fe-1.05%C foams. The carburization treatment was done at 900°C in an endothermic atmosphere (methanol/natural gas). The treatment was followed by slow furnace cooling to room temperature.
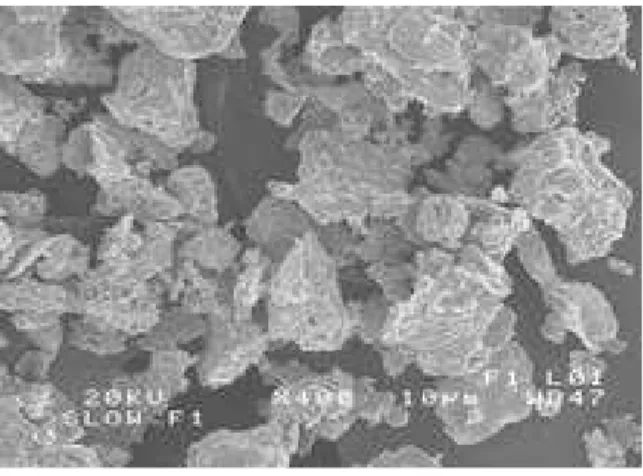
Figure 2: Iron powder used to produce the foams (ATOMET 95 from QMP).
Specimen structure was evaluated after foaming, debinding and sintering. The density of the foams was evaluated using the dimensions and weight of the cylinders. Open porosity was measured using a gas pycnometer (Micromeritics 1305). Pore size was measured on digitalized SEM and optical micrographs (SEM; JEOL JSM-6100). The pore size was determined by encircling the pores on the digitalized micrographs and calculating the diameter of circular pores of equivalent area.
Surface area was determined on the sintered specimens by gas adsorption (BET) using a Micrometrics ASAP 2010 system with krypton as adsorbate. Compression tests were done on a MTS 100 kN testing machine using a crosshead speed of 1.25 mm/min. The compression strength was determined on the compression curves as the intersection of the loading and plastic deformation plateau, as shown in Figure 3. The modulus was measured as the slope of the first unloading during the compression tests (i.e. vertical lines on the compression curves in Figure 3). Unloading was used to isolate elastic deformation from the plastic deformation and obtain the true elastic response of the material. The deformation at densification (εd) was taken as the intersection of the plastic deformation plateau and the densification loading, as
presented in Figure 3. The strength at densification (σd) was evaluated as the strength corresponding to
the deformation at densification on the compression curves while the energy at densification (Wd) was
a) b)
Figure 3: Typical compression curves obtained on metallic foams a) complete three-stage curve showing
the “elastic/plastic loading” (1), the progressive plastic deformation (2) and the densification (3) and b) enlarged portion of the beginning of the curve illustrating the methods used for evaluating the yield strength and the elastic modulus using the specimen unloading.
RESULTS AND DISCUSSION
Structure and microstructure
Figures 4 and 5 present examples of specimens and foam structures at low magnification (SEM) after foaming, debinding and sintering. Large shrinkage occurs during the process. Even if an important contraction is observed and a large volume of binder is eliminated during debinding, the structure of the material is maintained. Figure 5 shows the pore contraction for each process step (micrographs taken at the exact same location). New windows appear after debinding, due to the decomposition of particle-free cell walls (i.e. polymer film filling the windows before debinding). The decomposition of the binder is the major source of contraction observed during debinding. After debinding, the iron particles are oxidized and the material is composed of iron oxide with some islands of pure iron (see Figure 6a). The resulting material remains relatively brittle but can be handled without difficulty.
Figure 4: Cylinders after the different processing steps.
εd
σd Energy : Area
under the curve
As foamed Debinded Sintered Elastic/plastic loading σy,c Plastic deformation First unloading E = slope
Figure 5: Microstructure (SEM) taken at the exact same location a) after foaming, b) debinding and c) sintering (the arrow indicates a single pore after the different processing steps).
Table 1: Volumetric change between the different processing steps.
Debinding 20.2%
Sintering 25.5%
Complete cycle 40.5%
Despite the fact that substantial modifications occur during debinding, the variation of the porosity was minimal (Table 2). In fact, important volume contraction, weight variation due to polymer decomposition and oxygen pick-up as well as modification of the theoretical density of the material (Fe charged polymer and iron oxide respectively) all occur during debinding. The effects of these different phenomena more or less counterbalance each other and the resulting relative porosity remains similar.
During sintering, the oxide is reduced to pure iron and the particles are sintered together. The volume contraction caused by the complete transformation of the oxide into Fe and the densification caused by the solid state diffusion are the principal causes of the densification observed (25.5%). The porosity increase is due to the weight variation caused by reduction of the oxide. Despite the fact that the densities after debinding and sintering are similar (i.e. 0.73 g/cm3), the amount of porosity is slightly different due to the variation of the theoretical density of the foams (7.86 vs 5.25 g/cm3 for iron and Fe2O3
respectively). During the complete thermal treatment, a 40.5% contraction is observed.
Table 2: Density and porosity of the specimens after different processing steps.
Density Porosity Closed porosity
(g/cm3) (%) (%) As foamed 0.60±0.04 89.7±1.5 2.41±0.02 Debinded 0.73±0.04 85.9±0.781 0.130±0.001 Sintered 0.73±0.11 90.8±1.4 0.5±0.4
1
Porosity calculations of the debinded foams were based on the theoretical density of hematite Fe2O3, shown by XRD to be the
major constituent after debinding.
a) b) c)
Figure 6: Optical micrographs of a) the foam after debinding showing the oxide (gray phase) and the
remaining iron islands (white) and b) after sintering showing the fully reduced iron ferrite phase. The final density of the sintered foams (0.73±0.03 g/cm3, representing 90.8% porosity) is very low. The
foams have an open-pore structure featuring three levels of porosity (Figure 7). The structure is characterized by large pores or cells (1st level) with some openings or windows (2nd level) on the cell
walls. The third level of porosity, visible at higher magnifications, results from the voids between the sintered metallic particles (Figure 6 & 7).
a) b)
c) d)
Figure 7: SEM micrographs of sintered iron foams a) at X15 and b) at X27 showing the cells and
windows and c) at X330 and d) at X2,200 showing the quality of particle sintering and microporosity.
Cell
Windows
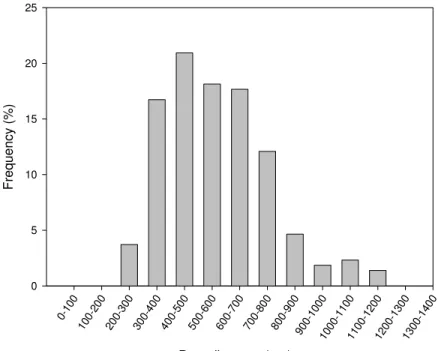
200 µm Fe oxide 100 µmThe pore size distribution evaluated by image analysis shows that most of the pores fit into the 300-800 µm diameter range and the average pore size is around 500 µm (Figure 8). Open porosity measured by gas picnometer confirmed that the porosity is open and the material is permeable. Some closed porosity can nevertheless be observed in the cell walls (Table 2, Figure 6) but its impact on the final porosity of the material is very low.
The fine scale microroughness coming from the particulate nature of the starting material was not completely eliminated during sintering. Even if the fine pores in the cell walls have little impact on the density of the material, they may have an important impact on the properties of the foams. Indeed, this level of porosity may have negative effects on some mechanical properties but on the other hand positive impact on the surface area, the acoustic absorption or the mechanical damping characteristics of the material. Indeed, the material has high surface area (i.e. 0.0611 ± 0.0002 m2/g). The surface area is
significantly greater than those obtained with other foam production processes involving liquid processing and vapor or electro-deposition.
Pore diameter (µm) 0-10 0 10 0-200 20 0-300 30 0-400 40 0-500 50 0-600 60 0-700 70 0-800 80 0-900 90 0-1000 1000 -110 0 1100 -120 0 1200 -130 0 1300 -140 0 Fre quency (%) 0 5 10 15 20 25
Figure 8: Pore size distribution evaluated by image analysis on SEM micrographs.
The structure and properties of the material can be controlled by tailoring the starting powder formulation and the processing conditions. For example, the powder formulation and the foaming conditions can be modified to adjust the density, the pore size, the microporosity, the permeability and the surface area of the materials. Sintering conditions on the other hand have an effect on the microporosity, surface area and mechanical properties. These effects were not investigated in the present study but are presented in other publications [12,13].
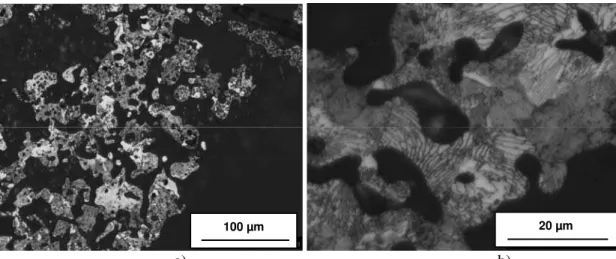
The carbon content of the steel foams produced by carburization (see in the experimental procedure section) measured by LECO was 1.05%C (±0.19wt%C, 4 measurements). The microstructure, representative of slowly cooled Fe-1.05%C steel, is composed of pearlite with some proeutectoid
cementite (Figure 9). Carburization was effective throughout out the cross-section of the foams. However, the structure was not completely uniform and the outer regions were richer in cementite.
a) b)
Figure 9: Microstructure of Fe-1.05%C foams produced by gas carburization of a pure Fe foam at a) low
and b) high magnification.
Mechanical properties
Figure 10 presents examples of compression curves of pure Fe and Fe-1.05%C foams. The curves show the typical compression deformation behavior of ductile metallic foams. As expected, the Fe-1.05%C foams have higher compressive strength and absorb more energy during densification (area under the curve up to densification). However, the Fe-1.05%C foam shows some disintegration at the end of the compression tests, indicating its lower ductility. In both cases, the materials show a long and flat stress-strain plateau, as required for energy absorption applications.
ε (%) 0 20 40 60 80 σ (MPa) 0 5 10 15 20 25 Fe (0.783 g/cc) Fe 1.05%C (0.775 g/cc)
Figure 10: Compression curves of pure Fe and Fe-1.05%C foams.
The compressive yield strength of the pure Fe foams varies from 0.67 to 1.4 MPa when the density increases from 0.64 to 0.95 g/cm3 while that of the Fe-1.05wt%C foams varies from 0.78 to 3.1 MPa
when the density increases from 0.64 to 0.93 g/cm3 (Figure 11a). The difference between the yield
strength of pure Fe and Fe-1.05wt%C foams increases with foam density.
Alloying with carbon has much less impact on the modulus, since carbon content has little effect on the elastic properties of steels. Moreover, the effect of density on the modulus is significant and the modulus varies from approximately 150 to 420 MPa when the density increases from 0.64 to 0.95 g/cm3.
The effect of density on the modulus and compression yield strength of metallic foams has been widely reported and models have been proposed to describe the yield strength and modulus as a function of density such as the Gibson and Ashby scaling laws [14]:
n o o c c E E ⎟⎟ ⎠ ⎞ ⎜⎜ ⎝ ⎛ ⋅ = ρ ρ α (1) m o o c y c y ⎟⎟ ⎠ ⎞ ⎜⎜ ⎝ ⎛ ⋅ = ρ ρ σ β σ , , (2)
where α and β are the scaling law coefficients for the compression modulus and compressive yield stress,
Ec0and σ0y,c are respectively the compression modulus and compressive yield stress of the dense metal
and ρ and ρ0 are the density of the foam and dense metal respectively. Unfortunately, the number of
specimens and the range of densities obtained in this study were not sufficient to obtain good correlations. Nevertheless, the values obtained fit the scaling laws, as indicated in Figure 11. The coefficients
estimated with these scaling laws are listed in Table 3.
The n coefficient obtained (2.56) is a little larger than those obtained with other commercial metallic foams (1.8-2.2) while the α coefficient (0.47) fits in the range (0.1-4) obtained with other foams [2]. Interestingly, the m coefficient is different for the two types of foams. According to the literature, this coefficient should be structure dependant while the structure of the Fe and Fe-1.05%C foams investigated in this study were similar (the steel foams were produced by treating the pure Fe foams and the treatment didn’t have any visible impact on the structure of the foams). This finding suggests that the m coefficient could be affected by both the structure and composition of the foams. This contribution was probably not observed in previous work due to difficulties in getting foams of the exact same structure but with different compositions. The β coefficient calculated using eq. (2) and reported values of yield strength of pure iron (i.e. 110-150 MPa) and extrapolated yield strength of Fe-1.05%C hot rolled carbon steel bars (475-525 MPa [18]) falls outside of the range reported in the literature (i.e. 1.5-2.0 [2]) for pure iron (0.71-0.96) but fits in the range for the Fe-1.05%C foams (i.e. 1.52-1.69). The results obtained suggest that the β coefficient is also affected by the material composition. Additional work with more specimens and foams with different compositions should, however, be done to get better statistical results and correlations to confirm these hypotheses.
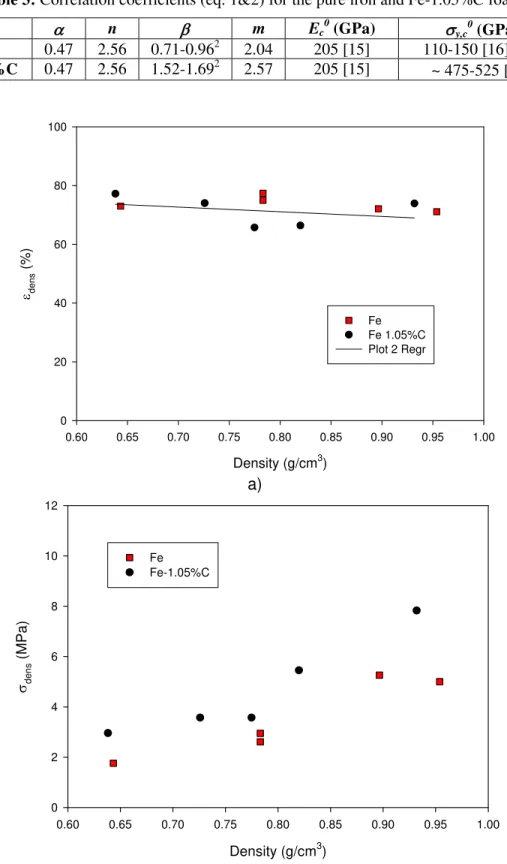
The deformation at densification is not highly affected either by the composition or the density of the foams characterized in this study despite the fact that the ductility of the materials (pure Fe vs pearlitic steel with proeutectoid cementite) is highly different (Figure 12a). The structure and porosity of the foams do have a positive effect on the deformation mechanisms in compression, similar to springs that can accommodate larger deformations than the material they are made of. The deformation at densification is 74% (stdev = 2.5%) for the pure Fe foams while it is 71% (stdev = 5.1%) for the Fe-1.05%C foams. Moreover, the effect of density on the deformation at densification is not very significant even if in principle, smaller deformations should be observed, when density increases. This trend is observed here, but the effect of density is not very strong in the density interval studied (Figure 12b).
The effect of density on the compressive strength at densification is clearer. It increases from 1.76 to 5.26 MPa for the pure Fe foams and 2.96 to 7.83 MPa for the Fe-1.05%C foams, when density increases
from 0.64 to 0.95 g/cm3. As expected, the compressive strength at densification is higher for the
Fe-1.05%C foams.
The energy absorbed by the foams, represented by the area under the curve up to densification, varies from 1.1 to 6.1 MJ/m3 when density increases from 0.64 to 0.95 g/cm3 (Figure 13). The difference of
energy absorbed by the Fe and Fe-1.05%C foams becomes greater when density increases. The amount of energy absorbed is important and compares well with those of aluminum foams [2] despite the fact that the microstructure and compositions of these iron-based foams have not yet been optimized for energy absorption. Significant improvements are expected with the optimization of the structure (i.e. reduced microporosity), composition and microstructure (i.e. thermal treatment) of the foams.
Density (g/cm3) 0.5 0.6 0.7 0.8 0.9 1.0 1.1 σx,y (M Pa) 0 1 2 3 4 5 Fe σx,y=106*(ρ/ρ0) 2.04 Fe-1.05wt%C σx,y=803*(ρ/ρ0) 2.57 a) Density (g/cm3) 0.5 0.6 0.7 0.8 0.9 1.0 1.1 M odu lus ( MPa ) 0 100 200 300 400 500 Fe Fe-1.05wt%C E=9.68E4*(ρ/ρ0) 2.56 b)
Figure 11 : a) Compression yield strength and b) compression modulus for Fe and Fe-1.05%C foams as a function of density.
Table 3: Correlation coefficients (eq. 1&2) for the pure iron and Fe-1.05%C foams.
α n β m Ec
0
(GPa) σy,c0 (GPa)
Fe 0.47 2.56 0.71-0.962 2.04 205 [15] 110-150 [16],[17] Fe-1.05%C 0.47 2.56 1.52-1.692 2.57 205 [15] ~ 475-525 [
18
] Density (g/cm3) 0.60 0.65 0.70 0.75 0.80 0.85 0.90 0.95 1.00 εdens (%) 0 20 40 60 80 100 Fe Fe 1.05%C Plot 2 Regr a) Density (g/cm3) 0.60 0.65 0.70 0.75 0.80 0.85 0.90 0.95 1.00 σde ns (MPa) 0 2 4 6 8 10 12 Fe Fe-1.05%C b)Figure 12 : a) Deformation and b) strength at densification for pure Fe and Fe-1.05%C foams (i.e. deformation and strength at densification are defined in section 2).
2
Density (g/cm3) 0.60 0.65 0.70 0.75 0.80 0.85 0.90 0.95 1.00 Ener gy absor bed ( M J/m 3 ) 0 1 2 3 4 5 6 7 Fe Plot 1 Regr Fe-1.05%C Plot 2 Regr
Figure 13 : Energy at densification vs density for pure Fe and Fe-1.05%C foams.
CONCLUSION
This study validated a new process for the production of ferrous foams. The structure and properties of different iron and steel foams were presented. The materials are highly porous (around 90% porosity) and have unique microstructures. The process used to produce the foams is relatively simple and does not require the densification of the powder prior to foaming. Steel foams were produced by carburization of pure Fe foams. Fe-1.05%C having a pearlitic structure with some proeutectoid cementite was obtained after those treatments.
The following observations were made:
• The deformation up to densification and the energy absorbed by the foams is important even if the ductility of the Fe-1.05%C material is low (i.e. pearlitic with proeutectoid cementite); • The compression yield strength, the compression modulus and the energy at densification are all
affected by the density;
• The yield strength and modulus fits the Gibson and Ashby scaling laws with densities;
• Coefficients of the Gibson and Ashby scaling laws seem to be dependent on the composition of the foams;
• The compressive strength and energy absorbed at densification are significantly affected by the carburization treatment, while the modulus of the pure iron and Fe-1.05%C foams are similar. Future work includes:
• Production of steel foams with powder formulations containing different alloying elements and the reduction of microporosity to improve the mechanical properties;
• Evaluation of the effect of different thermal treatments on the microstructure and properties of the foams;
• Performance evaluation of foams having different structures, densities and compositions as well as composite structures (sandwich panels, filled tubes, I beams, etc.);
• Optimization of the thermal treatment to simplify the process (shorter debinding treatment, sintering at lower temperature).
ACKNOWLEDGMENTS
The authors would like to acknowledge M.Plourde from IMI for her help in the mechanical
characterization, F.Chagnon from QMP and L.Azzi from IMI for fruitful discussions on iron and steel metallurgy, R. Lawckock from Stackpole for the carburization treatment and S.Lang from SIMS (NRC) for the BET measurements.
REFERENCES
1 J. Banhart, M. Ashby, N. Fleck, Cellular Metals and Metal Foaming Technology, Verlag MIT
Publishing, Bremen, 2001.
2 M.F. Ashby, A.G. Evans, N.A. Fleck, L.J. Gibson, J.W. Hutchinson, H.N.G. Wadley, Metal Foams, a
Design Guide, Butterworth-Heinemann, 2000.
3 A.G. Evans, J.W. Hutchinson, M.F. Ashby, Progress in Materials Science, Vol. 43, 1999, pp. 171-221. 4 D.S. Schwartz, Proc. Materials Research Society Symposium, Mater. Res. Soc, Vol. 521, Warrendale,
1998.
5 J.Banhart, H. Eifert, Proc. Fraunhofer USA Metal Foam Symposium, Eds. J. Banhart, H. Eifert, Verlag
MIT Publishing, Bremen, 1998.
6 R. Soria, Catalysis Today, Vol. 25, 1995, pp. 285-290. 7 C.Park, S.R.Nutt,
“PM Synthesis and Properties of Steel Foams”, Materials Science and Engineering, A288, 2000, pp. 111-118.
8 C.S.Y.Jee, N.Özgüven, Z.X.Guo and J.R.G.Evans, Preparation of High Porosity Metal Foams,
Vol.31B, Dec. 2000, pp. 1345-1352.
9 U.Mohr and W.Bleck, Processing and First Characterization of Ferrous Foams, Euromat’99, 1999, 5,
pp. 28-33.
10 S.K.Hyun, T.Ikeda, H.Nakajima,
“Fabrication of Lotus-Type Porous Iron and its Mechanical Properties”, Science and Technology of Advanced Materials, 5, 2004, pp. 201-205.
11 L. P.Lefebvre, Y. Thomas,
“
Method of Making Open Cell Material”
, US Patent 6,660,224 B2, Dec. 9,2003.
12 L.P.Lefebvre, M.Gauthier, M.N.Bureau, M.Leroux, M. Panneton, D.Pilon, “Properties of Nickel
Foams Having Different Pore Size Distributions and Densities”, MetFoam 2003 - 3rd international
Conference on Cellular Metals and Metal Foaming Technology, Berlin, Germany, 23-25 June
2003, pp.475-480.
13 M. Gauthier, L.P.Lefebvre, Y.Thomas, M.N.Bureau, “Production of Metallic Foams Having Open
Porosity Using a Powder Metallurgy Approach”, Materials and Manufacturing Processes, Vol.19, No.5, 2004, pp.793-811.
14 Gibson L. J.; Ashby, M. F. 1997. Cellular Solids – Structure and Properties, 2nd edition; Cambridge
University Press, 1997, pp. 175-234.
15 CRC Hanbook of Chemistry and Physics, 85th ed., 2004-2005, pp. 12-204.
16http://www.phillipsplastics.com/capabilities/metals/MIM_Charts.pdf (accessed march 2005).