C E N T R E D'E T U D E S E T D E R E C H E R C H E S S U R L E D E V E L O P P E M E N T I N T E R N A T I O N A L
SÉRIE ÉTUDES ET DOCUMENTS
Is there a strategy in China’s health official development assistance
to African countries?
Marlène Guillon
Jacky Mathonnat
Études et Documents n° 10
May 2017
To cite this document:
Guillon M., Mathonnat J. (2017) “Is there a strategy in China’s health official development
assistance to African countries?”, Études et Documents, n° 10, CERDI.
http://cerdi.org/production/show/id/1876/type_production_id/1
CERDI
65 BD. F. MITTERRAND
63000 CLERMONT FERRAND – FRANCE
TEL.+33473177400 FAX +33473177428
2
The authors
Marlène Guillon
PhD in Economics
School of Economics and CERDI, University Clermont Auvergne - CNRS, Clermont-Ferrand,
France.
E-mail:
marlene.guillon@uca.fr
Jacky Mathonnat
Professor
School of Economics and CERDI, University Clermont Auvergne - CNRS, Clermont-Ferrand,
France.
E-mail:
jacky.mathonnat@uca.fr
Corresponding author: Marlène Guillon.
This work was supported by the LABEX IDGM+ (ANR-10-LABX-14-01) within the program “Investissements d’Avenir” operated by the French National Research Agency (ANR).
Études et Documents are available online at: http://www.cerdi.org/ed
Director of Publication: Grégoire Rota-Graziosi
Editor: Catherine Araujo Bonjean
Publisher: Mariannick Cornec
ISSN: 2114 - 7957
Disclaimer:
Études et Documents is a working papers series. Working Papers are not refereed, they constitute
research in progress. Responsibility for the contents and opinions expressed in the working papers rests solely with the authors. Comments and suggestions are welcome and should be addressed to the authors.
3
Abstract
Chinese health official development assistance (ODA) to Africa has largely increased since
the beginning of the 2000’s. Even if China now ranks among the top ten bilateral donors for
health aid in Africa very little is known about the determinants of Chinese health ODA to
African countries. Our objective is to study the factors associated with Chinese health ODA
to sub-Saharan Africa in the 2000-2013 period. We investigate the role of three types of
factors that might influence the allocation of Chinese health aid: the needs of recipient
countries, their merits and the self-interest of China.
Chinese health ODA is measured using the 1.2 version of the AidData database constructed
by the William & Mary University, the Brigham Young University and the non-governmental
organization Development Gateway. In total, 389 health aid projects were financed by China
in Africa between 2000 and 2013, accounting for a total amount of 2011 US$789 million. On
these 389 projects, 194 (59%) correspond to the dispatch of medical teams, 109 (24%) to the
sending of medical equipment or drugs and 77 (16%) to health infrastructure construction or
rehabilitation. The annual number of health projects financed by China in Africa has
increased sharply after the 3
rdForum on China-Africa Cooperation (FOCAC) in 2006.
We study the factors associated with the number of health projects and the amount of ODA
received each year by African countries between 2000 and 2013. We stratify the analysis by
types of projects (medical team dispatches/infrastructure and medical equipment or drugs
projects) and by sub-periods (2000-2006/2007-2013). We use Poisson regressions to
estimate both the number of projects and the amount of ODA received as Poisson
regressions were shown to outperform OLS and Tobit models in the presence of
heteroskedasticity and many zero observations. Pooled regressions, rather than fixed effect
regressions, are used in order to exploit both inter and intra-country heterogeneity for the
identification of factors associated with the allocation of Chinese health aid. We replicate
the analysis using the shares of health projects and health ODA amount received by African
countries each year using the fractional probit method relevant for the case of proportions
as dependent variables
Our results show that the motives of Chinese health aid have changed over the 2000-2013
period. In particular, Chinese political and economic interests, as measured by recipient
countries’ UNGA voting alignment with China and openness rate to China, were less
important in Chinese health aid allocation decisions over the 2007-2013 period that followed
the 3
rdFOCAC compared to the 2000-2006 period. On the contrary, taking into consideration
health needs of recipient countries became more visible in Chinese health aid allocation
decisions after 2006. Then, Chinese health diplomacy seems to have evolved from a rather
“selfish” aid focused on political and economic self-interests to a more altruistic aid focused
on health needs of recipient countries. The empirical analysis also highlights the
complementarity of Chinese health ODA with its ODA in other sectors and that the allocation
of Chinese health aid in African countries does not appear to be heavily related to health aid
provided by traditional bilateral donors, suggesting that health aid cannot be seen as a way
for China to promote its international visibility.
Keywords: Health aid, Aid allocation, China, Africa.
JEL Code: F35, I15, I18.
4
1. Introduction
The influence of China outside its borders in the field of health is not new. More than fifteen centuries ago, the Silk Road spread Chinese medicine in India, Central Asia and the Middle East. In 1963, Mao-Tse-Tung and Chou-En-Lai sent the first Chinese medical team on the African continent, in Algeria. Since then, Chinese health official development assistance (ODA) to Africa has largely increased, in particular since the beginning of the 2000’s. Nowadays, China ranks among the top ten bilateral donors for health aid in Africa (Grépin et al., 2014). China's interest in Africa has deepened since the creation of the triennial Forum on China-Africa Cooperation (FOCAC) in 2000. Medical and health care cooperation is one of the objectives defined for the new China-Africa Partnership in the Second White Paper on China’s Foreign Aid (2014).
A large literature is available regarding the determinants of ODA from Organisation for Economic Co-operation and Development (OECD) countries, regional development banks, United Nations agencies and non-governmental organizations (Berthélémy and Tichit 2004; Dollar and Levin, 2006; Younas, 2008; Lee and Lim, 2014; Acht et al., 2015). Several articles have specifically looked at the determinants of health ODA from traditional private institutions and public donors. These studies have found that health needs of recipient countries poorly explain the amount of health aid they receive and that countries with more political rights receive significantly more aid (Esser and Bench, 2011; Fielding, 2011). On the contrary, fewer analyzes of the determinants of ODA from new donor countries, including health ODA, are available. Neumayer (2003) study the factors associated with the allocation of aid by Arab countries. He finds that poorer countries are more likely to receive some positive amount of Arab aid as well as countries that adopt voting patterns in the United Nations General Assembly (UNGA) similar to Saudi Arabia. Fuchs and Vadlamannati (2013) focus on aid motives of India and show that commercial and political self-interests (as measured by UNGA voting alignment) dominate India’s aid allocation. Dreher et al. (2011) compare the factors associated with aid allocation between Development Assistance Committee (DAC) donors and new donors, namely Arab, Asian, Latin American and Eastern/Central European donors. They find that new donors weight less recipient countries’ needs than DAC countries in their aid allocation. Moreover, their results show that merit of recipient countries, as measured by the level of corruption, does not influence the aid allocation of new donors. Finally they conclude that evidence of aid allocation based on commercial self-interest is lacking for new donors.
China is often seen as allocating its ODA in its own interests in order to secure its access to natural resources, favor its exports to emerging markets or extend its political influence (Naim, 2007, Lin et al. , 2016). On the contrary, China declares allocating its ODA in response to the needs expressed by the recipient countries, according to a "win-win" strategy and following a non-interference principle
(Lin et al., 2016, Second White Paper on China's Foreign Aid, 2014). In 2006, at the 3rd FOCAC,
Chinese leaders highlighted the principle of "mutual benefits" as an objective of the China-Africa cooperation (Kjøllesdal et al., 2010; Declaration of the Beijing Summit of the Forum on China-Africa Cooperation, 2006/11/05).
Two recent studies have investigated the determinants of Chinese aid allocation in Africa. Grépin et al. (2014) provide a descriptive analysis of Chinese health aid in Africa between 2000 and 2012. They graphically show that Chinese health aid is not correlated with the natural resource endowment of beneficiary countries. Dreher and Fuchs (2015) study the factors associated with Chinese ODA to all recipient countries between 1956 and 2006. The authors test whether Chinese economic and political interests influence (1) the total amount of ODA; 2) the total number of projects; 3) the amount of food aid and 4) the number of medical teams received by each country. They show that Chinese ODA is independent of beneficiary countries’ natural resource endowment. They also highlight the importance
5
of political considerations in Chinese aid allocation even if they state that China does not pay more attention to politics than Western donors.
Our objective is to study the factors associated with Chinese health ODA to Africa between 2000 and
20131. We investigate the role of three types of factors that might influence the allocation of Chinese
health aid: the needs of recipient countries, their merits and the self-interest of China. In a first step we study the number of health projects and the amount of health ODA received by each African country. For the number of health projects, the analysis is stratified by types of projects (medical teams/infrastructure and medical equipment or drugs) and by sub-periods (2000-2006/2007-2013). The number of each type of health projects received is analyzed using Poisson regressions which are appropriate for count data. We then analyze the amount of ODA received each year by African countries. Again we stratify the analysis by sub-periods and use Poisson regressions that were shown to outperform OLS and Tobit models in the presence of heteroskedasticity and many zero observations (Silva et al., 2006; Silva et al., 2011). Given the low time variability of some explanatory variables pooled regressions, rather than fixed effect regressions, are used in order to exploit both inter and intra-country heterogeneity for the identification of factors associated with the allocation of Chinese health aid. In a second step, we study the shares, rather than the absolute values, of Chinese health ODA projects and amount received by each country. These regression analyses are run using the fractional probit method developed by Papke and Wooldridge (1996) for the case of proportions as dependent variables.
Our results show that the motives of Chinese health aid have changed over the 2000-2013 period. In particular, Chinese political and economic interests, as measured by recipient countries’ UNGA voting alignment with China and openness rate to China, were more important in Chinese health aid
allocation decisions over the 2000-2006 period compared to the 2007-2013 period that followed the 3rd
FOCAC. On the contrary, health needs of recipient countries became more central in Chinese health aid allocation decisions after 2006. Then, Chinese health diplomacy China seems to have evolved from a rather selfish aid focused on political and economic self-interests to a more altruistic aid focused on health needs of recipient countries.
2. Data
2.1 Chinese health aid between 2000 and 2013
Chinese health aid to Africa started in the early 1960’s with the sending of the first Chinese medical team on the African continent, in Algeria. Since then, Chinese health aid to Africa has largely increased, especially in the 2000’s, and China now ranks among the top ten bilateral donors for health aid in Africa (Grépin et al., 2014). In parallel of the increase in Chinese health aid, Chinese aid diplomacy has also evolved over time. Since 1956, Dreher and Fuchs (2015) mention five phases for China’s aid policy. Two of these phases are of interest for our analysis as they cover the 2000-2013 period. According to Bräutigam (2009) the aid reform adopted in 1995 was market-oriented and
highlighted the links between aid, trade and investment. Moreover, the 3rd FOCAC in 2006 induced a
shift in the Chinese aid policy as it aimed to create a new type of partnership between China and African countries. Beyond the doubling of Chinese aid, Beijing also declared a new objective of
“mutual benefit and win-win situations” between China and Africa at the 3rd
FOCAC (Kjøllesdal et al., 2010; Lin et al., 2016; Declaration of the Beijing Summit of the Forum on China-Africa Cooperation,
1
The preliminary results of an exploratory analysis of these issues over the period 2000-2012 were presented by J. Mathonnat and L. Wagner at the Shanghai Forum, 2015.
6
2006/11/05)2. Therefore, the 2000-2013 period can be decomposed in two sub-periods regarding the
motives of Chinese aid: the 2000-2006 period when economic interests were at the center of Chinese aid policy and the 2007-2013 period when these economic interests may be less stringent in Chinese aid allocation decisions.
Chinese health ODA is measured using the 1.2 version of the AidData database constructed by the William & Mary University, the Brigham Young University and the non-governmental organization Development Gateway (Tierney et al., 2011). This database was created using the TUFF (Tracking Under-Reported Financial Flows) methodology that uses two stages: 1) the research, in Factivia and on government websites, of articles, reports or other documents that mention development aid from China to an African country and 2) the analysis of documents found in stage 1 in order to establish a detailed description of the project that includes the type of project (ODA, other official financial flows or commercial flows), the date of the project, the area covered by the project (Creditor Reporting System code as recorded by OECD), the status of the project (pledged, committed, in implementation or completed) and the value of the associated funding.
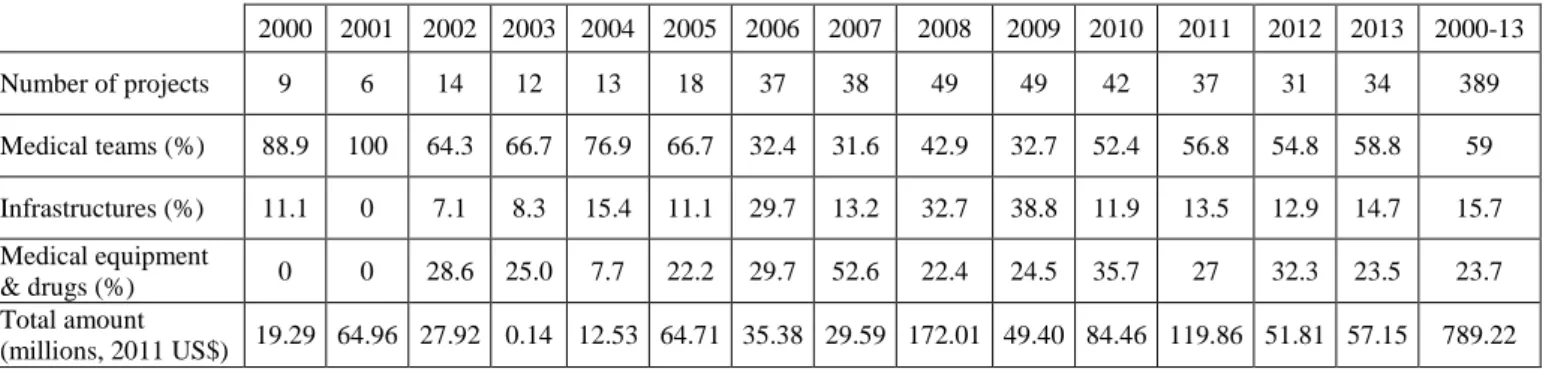
From this database, we selected Chinese ODA projects in the domain of health. We chose to exclude projects that were only pledged or committed and for which no proof of money disbursement is available. Indeed, some projects might have been pledged but not implemented because of a change in the economic or political relations between China and the recipient country. For infrastructure projects, several years may run between the project pledge, its start and the end of the project. In that case, we chose to use the year of construction start as the date of the project in the main analysis. Table 1 describes the evolution in the number, the type and the amount of health ODA projects financed by China in Africa over the period 2000-2013.
In total, 389 health aid projects were financed by China in Africa between 2000 and 2013. On these 389 projects, 194 (59%) correspond to the dispatch of medical teams, 109 (24%) to the sending of medical equipment or drugs and 77 (16%) to health infrastructure construction or rehabilitation. The share of infrastructure projects rose sharply in the 2000’s, until reaching 39% in 2009, before falling again after 2010. In parallel, the share of medical team dispatches in the total of projects fell during the study period. The total amount of health projects funded by China between 2000 and 2013 is 2011 US$789,218,470. 2000 2001 2002 2003 2004 2005 2006 2007 2008 2009 2010 2011 2012 2013 2000-13 Number of projects 9 6 14 12 13 18 37 38 49 49 42 37 31 34 389 Medical teams (%) 88.9 100 64.3 66.7 76.9 66.7 32.4 31.6 42.9 32.7 52.4 56.8 54.8 58.8 59 Infrastructures (%) 11.1 0 7.1 8.3 15.4 11.1 29.7 13.2 32.7 38.8 11.9 13.5 12.9 14.7 15.7 Medical equipment & drugs (%) 0 0 28.6 25.0 7.7 22.2 29.7 52.6 22.4 24.5 35.7 27 32.3 23.5 23.7 Total amount (millions, 2011 US$) 19.29 64.96 27.92 0.14 12.53 64.71 35.38 29.59 172.01 49.40 84.46 119.86 51.81 57.15 789.22
Table 1: Evolution of number, type and amount of health projects
Figure 1 shows the evolution, on the left of the number and type of health projects funded by China and, on the right of the amount allocated. The total number of projects increased steadily between
2
The Second White Paper on China's Foreign Aid (July 2014) devotes a special section on cooperation on health issues, and another section to “New China-Africa Strategic Partnership”, strengthening the goal of “Promoting medical and health care cooperation”.
7
2000 and 2005. As announced by the Chinese authorities, the annual number of health projects
financed by China has increased sharply after the 3rd FOCAC in 2006. Indeed, the annual number of
project went from 18 in 2005 to a maximum of 49 in 2008 and 2009. After a stabilization phase, the number of projects then declined steadily between 2009 and 2012 before a new increase in 2013. The result of the equality test for the number of health ODA projects by sub-period show that the annual number of health projects financed by China significantly increased after 2006 (t = -7.8758, p < .01). The amounts of projects allocated by China, measured in millions of constant 2011 US$, appear very unstable, with successive increases and decreases. A very large increase in the total amount of health aid is observed in 2008. This increase can be linked to the promise, made by the Chinese authorities in 2006, to double ODA to African countries. However, this increase has been moderated by the global financial crisis which began in autumn 2008 and which slowed down Chinese growth. Nevertheless, the annual health ODA amount disbursed by China in African countries significantly increase in the 2007-2013 period compared to the 2000-2006 period (t = -1.7196, p < .05). Conversely, health aid commitments by DAC countries (measured in tens of 2014 US$ million) have increased steadily
between 2000 and 20133. Chinese health ODA represents between 2 and 8% of DAC countries’ health
ODA commitments over the period of analysis.
Figure 1: Number and amount of health ODA projects from China between 2000 and 2013
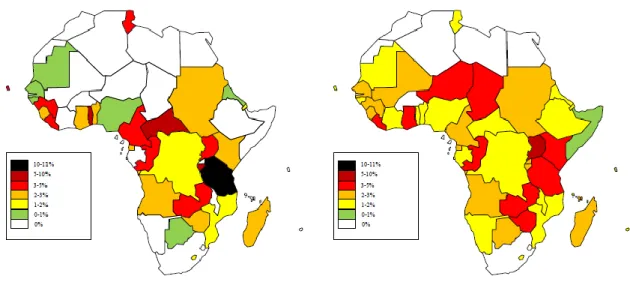
Figure 2 shows for the 2000-2006 and 2007-2013 sub-periods the share of projects received by each African country. Chinese health aid, in terms of number of health projects financed, appears more concentrated over the 2000-2006 period compared to the 2007-2013 period. Over the 2000-2006 period 31 countries benefited from at least one health aid project from China while it was the case for 45 countries in the 2007-2013 period. Moreover, in the first sub-period Tanzania concentrates more than 10% of health aid projects while no country received more than 6% of health aid over the 2007-2013 period.
3
DAC countries health aid commitments, rather than disbursements, are used given the high number of missing values for disbursements over the study period.
8
Figure 2: Repartition of Chinese health ODA projects
Table 2 presents the ranking of African countries by number of health projects and amount of health ODA received for each sub-period. In terms of total number of health projects, the top 10 recipient countries received between 4 and 11 health projects over the 2000-2006 period and between 9 and 14 health projects over the 2007-2013 period. Tanzania is the country that received the highest number of health projects in the 2000-2006 period with 11 projects, which represents 10% of the total number of health aid projects financed by China over the period. For the 2007-2013 period, Uganda received the highest number of projects with 14 projects (5% of the total number of projects) while Tanzania is still the second highest beneficiary country with 12 health aid projects received (4.3% of total number of projects). Compared to the first sub-period, six countries entered the top ten for the number of health projects received: Ghana, Kenya, Niger, Zambia, Chad and Zimbabwe.
For the dispatch of medical teams and the sending of medical equipment or drugs, the top 10 recipient countries received between 3 and 6 medical teams and 1 and 3 projects respectively for the 2000-2006 period and between 4 and 10 medical teams and 3 and 7 projects respectively for the 2007-2013 period. For both sub-periods, Tanzania is the country that benefited from the highest number of Chinese medical teams with 6 teams in the 2000-2006 period and 10 teams in the 2007-2013 period. Except for Tanzania, Zimbabwe and Burundi, none of the top ten recipients of Chinese medical teams in the 2000-2006 period was still in the top ten after 2006. The top ten recipients for medical equipment and drug projects also changed drastically between the two sub-periods as 7 new countries enter this top ten in the 2007-2013 period: Uganda, Ghana, Mali Niger, Botswana, Madagascar and Zimbabwe.
Regarding infrastructure projects, the top ten recipient countries received between 1 or 3 projects in the 2000-2006 period and between 2 or 4 projects in the 2007-2013 period. Again, we see a large change in the top ten beneficiary countries for infrastructure projects between the two periods. Kenya, which was not in the top ten countries in the 2000-2006 period, is the country that benefited from the highest number of health infrastructure projects over the 2007-2013 period with 4 projects. On the contrary, Tanzania which ranked first with 3 infrastructure projects in the 2000-2006 period, received no Chinese infrastructure projects over the 2007-2013 period. For infrastructure projects, only Central African Republic is among the top ten recipient countries over the two sub-periods.
Health ODA amount received is calculated based on medical equipment/drug and infrastructure projects as financial amount are not available for medical teams or training projects. For the 2000-2006 period, Uganda is the country that received the highest funding of health ODA, closely followed
9
by Angola. These two countries concentrated more than half of Chinese health ODA funding in this period. Ivory Coast is the country that received the highest amount of health ODA over the 2007-2013 period with US$158 million (2011 US$). This high amount is explained by the funding of two large infrastructure projects in 2007 and 2008. Kenya, who received the highest number of infrastructure projects over the 2007-2013 period (4) ranks as the second highest recipient country in terms of ODA amount with US$129 million. On the contrary, Central African Republic, which received 3 infrastructure projects over the 2007-2013 period, only received around US$9 million of Chinese health ODA (rank 16) between 2007 and 2013. This is explained by the fact that financial amounts are missing for 2 out of 3 of the infrastructure projects the country received.
2000-2006
Projects Medical team Medical equip. and drug Infrastructures Health ODA amount
Country* Number % Country Number % Country Number % Country Number % Country Amount %
TZ 11 10.1 TZ 6 9.2 KE 3 13.0 TZ 3 16.7 UG 65,796,096 29.2 TG 7 6.4 BI 5 7.7 LR 3 13.0 AO 2 11.1 AO 64,632,692 28.7 UG 7 6.4 CF 5 7.7 TG 3 13.0 GH 2 11.1 ER 19,292,142 8.6 BI 6 5.5 CV 4 6.2 LS 2 8.7 BI 1 5.6 TZ 15,519,462 6.9 CF 6 5.5 CN 4 6.2 TZ 2 8.7 CV 1 5.6 GH 15,032,606 6.7 CV 5 4.6 GN 4 6.2 AO 1 4.3 CF 1 5.6 ZW 13,564,206 6.0 CG 5 4.6 TN 4 6.2 UG 1 4.3 GQ 1 5.6 GQ 12,416,395 5.5 GN 5 4.6 ZM 4 6.2 CG 1 4.3 CG 1 5.6 NG 10,334,916 4.6 CN 4 3.7 BJ 3 4.6 DJ 1 4.3 DJ 1 5.6 CV 3,840,180 1.7 LR 4 3.7 UG 3 4.6 GQ 1 4.3 ER 1 5.6 KE 2,015,649 0.9 2007-2013
Projects Medical team Medical equip. and drug Infrastructures Health ODA amount
Country Number % Country Number % Country Number % Country Number % Country Number %
UG 14 5.0 TZ 10 7.8 UG 7 8.1 KE 4 6.8 CI 158,476,848 28.1 TZ 12 4.3 ZM 7 5.4 GH 5 5.8 CF 3 5.1 KE 127,576,503 22.6 GH 11 3.9 TD 5 3.9 LR 5 5.8 CI 3 5.1 ZM 56,346,732 10.0 LR 11 3.9 LR 5 3.9 ML 5 5.8 SD 3 5.1 AO 34,314,744 6.1 CG 10 3.6 UG 5 3.9 NE 5 5.8 ZM 3 5.1 NE 25,037,880 4.4 KE 10 3.6 BI 4 3.1 BW 4 4.7 CN 2 3.4 NG 24,892,852 4.4 NE 10 3.6 ER 4 3.1 KE 4 4.7 TD 2 3.4 MU 20,214,438 3.6 ZM 10 3.6 GH 4 3.1 MG 4 4.7 KM 2 3.4 NA 11,834,455 2.1 TD 9 3.2 NE 4 3.1 ZW 4 4.7 CG 2 3.4 GN 11,493,206 2.0 ZW 9 3.2 RW 4 3.1 CG 3 3.5 ET 2 3.4 SN 10,564,385 1.9
*Country names are expressed as 2 letters ISO codes
Table 2: Top 10 recipient countries by project type and amount
2.2 Explanatory variables
We consider the role of three kinds of variables that might influence the allocation of Chinese health ODA: variables related to the needs and merits of beneficiary countries and variables measuring China's own interest.
For the “need” variables we differentiate between economic and health needs. To measure economic need we use the GDP per capita measured in thousands of constant 2011 US$ (World Bank data) in the main analysis. We also test for the impact of the economic vulnerability index (EVI) in robustness checks (Feindouno and Goujon, 2016). On a scale from 0 to 100 the EVI measures the likelihood that a country’s economic development could be hindered by unforeseen exogenous shocks. If China
10
allocates its health ODA based on the economic needs of beneficiary countries, we should find a negative correlation between GDP per capita and health aid and a positive correlation between the EVI and health aid. We integrate two measures of health needs in the main analysis: public health expenditures as a percentage of GDP (introduced in percentage given the high correlation of public health expenditures in level with GDP per capita, World Bank data) and life expectancy at birth (World Bank data). We expect to find a negative correlation between public health expenditures of recipient countries and Chinese health aid if China favors countries where the ability to finance health projects on national funds is limited. If China allocates its health ODA based on health needs of recipient countries we should also find a negative correlation between Chinese health aid and life expectancy in recipient countries. In robustness checks, we also test for the impacts of child mortality
and the number of people affected by a natural disaster4 (EM-DAT 2015, Guha-Sapir et al., 2015),
instead of life expectancy, on Chinese heath aid allocation. Finally, we also include population size as a measure of recipient countries’ needs (World Bank data).
To measure recipient countries’ merits we introduce a variable usually used in the literature to reflect the quality of political governance in the beneficiary countries: the control of corruption index (Kaufmann et al., 2010) (World Bank data). Previous studies of new donors’ motives have found that these countries disregard merit of recipient countries as measured by their level of corruption control (Dreher et al., 2011). If Beijing truly applies a non-interference principle for the allocation of its ODA, there should be no significant correlation between the control of corruption measure and Chinese health ODA.
Variables related to China's own interest can be classified into two categories, economic and political
variables. The two economic variables used are the openness rate of recipient countries to China5 (in
% of GDP, WITS and World Bank data) and the oil rent as percentage of GDP6 (World Bank data). If
China uses its health aid to "reward" or support the opening of domestic markets in African countries, or in order to promote its access to natural resources, a positive correlation should be found between the openness rate to China/the oil rent and health ODA from China. Given the two phases of Chinese aid policy described above we expect economic variables to exert more influence on Chinese allocation decisions in the 2000-2006 period compared to the 2007-2013 period.
Previous studies have found that UNGA voting alignment is determinant in the aid allocation decisions of new donor countries such as Arab countries or India (Neumayer, 2003; Fuchs and Vadlamannati, 2013). Therefore, to measure Chinese political interests we first calculate UNGA voting alignment of recipient countries with China (in percentage) based on data of Voeten and Merdzanovic (2009). We also include a binary variable for the recognition of Taiwan. A positive correlation between voting alignment with China and health aid and a negative correlation between Taiwan recognition and health aid are expected if China uses its health ODA as part of its diplomatic policy.
Two other explanatory variables are used in the empirical analysis: the number of non-health ODA projects received from China (AidData database) and the amount of health ODA commitments from DAC countries (millions of constant 2014 US$, OECD). These variables are introduced in order to study the complementarity or substitutability between Chinese health aid and Chinese ODA in other sectors on the one hand, and Chinese health aid and health aid of DAC countries on the other hand.
4 This variable is used in robustness checks rather than in the main analysis given the high number of missing
values over the study period which significantly reduces the number of observations.
5 Exportations of China to recipient countries and imports of recipient countries to China as a percentage of
recipent countries’ GDP.
6
Oil rents are the difference between the value of crude oil production at world prices and total costs of production.
11
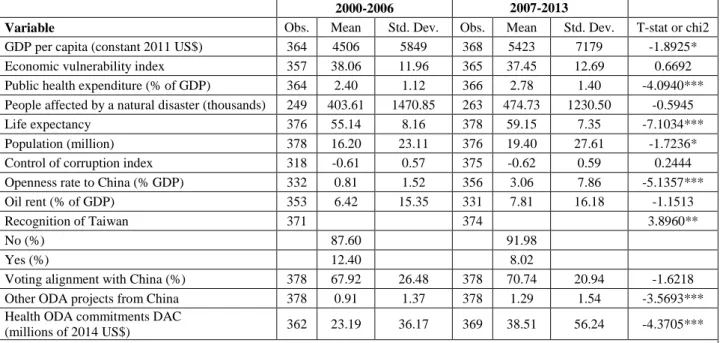
Table 3 displays the descriptive statistics of the explanatory variables for two sub-periods, 2000-2006 and 2007-2013, and test for difference in means of explanatory variables between these two sub-periods. GDP per capita increased significantly between the two periods, from 4500 in the 2000-2006 period to 5400 2011 US$ in the 2007-2013 period. On the contrary, the mean value of EVI remained stable over the 2000-2013 period. The share of GDP devoted to public health expenditures significantly increased from 2.4% in the first sub-period to 2.78% in the second sub-period while life expectancy increased from 55 to 59. In average, between 400 and 500 thousands of people were annually affected by a natural disaster in each African country. Mean population in African countries was 16.2 million in the 2000-2006 period and significantly increased to 19.4 million in the 2007-2013 period.
The mean value of the control of corruption index is around -0.6 in the two sub-periods and its value did not change significantly. On the contrary, openness to China increased significantly over time. The openness rate increased from 0.81% in 2000-2006 to 3.06% in the 2007-2013 period. The oil rent of African country was high over the study period (6.4 to 7.8%) and did not change significantly between the two sub-periods. Fewer countries recognized Taiwan in the 2007-2013 period (8%) compared to the 2000-2006 period (12%). Voting alignment of African countries with China slightly increased from 68% in 2000-2006 to 71% in 2007-2013. However, this increase in UNGA voting alignment is not statistically significant. Both the number of other ODA projects from China and the amount of health ODA commitments from DAC countries increased between the two periods. African countries received 0.9 non-health ODA project from China each year in the 2000-2006 period against 1.3 projects each year in the 2007-2013 period. Annual health ODA commitments from DAC countries increased from 23 million of 2014 US$ in the 2000-2006 period to more than 38 million of 2014 US$ in the 2007-2013 period.
2000-2006 2007-2013
Variable Obs. Mean Std. Dev. Obs. Mean Std. Dev. T-stat or chi2
GDP per capita (constant 2011 US$) 364 4506 5849 368 5423 7179 -1.8925*
Economic vulnerability index 357 38.06 11.96 365 37.45 12.69 0.6692
Public health expenditure (% of GDP) 364 2.40 1.12 366 2.78 1.40 -4.0940*** People affected by a natural disaster (thousands) 249 403.61 1470.85 263 474.73 1230.50 -0.5945
Life expectancy 376 55.14 8.16 378 59.15 7.35 -7.1034***
Population (million) 378 16.20 23.11 376 19.40 27.61 -1.7236*
Control of corruption index 318 -0.61 0.57 375 -0.62 0.59 0.2444
Openness rate to China (% GDP) 332 0.81 1.52 356 3.06 7.86 -5.1357***
Oil rent (% of GDP) 353 6.42 15.35 331 7.81 16.18 -1.1513
Recognition of Taiwan 371 374 3.8960**
No (%) 87.60 91.98
Yes (%) 12.40 8.02
Voting alignment with China (%) 378 67.92 26.48 378 70.74 20.94 -1.6218
Other ODA projects from China 378 0.91 1.37 378 1.29 1.54 -3.5693***
Health ODA commitments DAC
(millions of 2014 US$) 362 23.19 36.17 369 38.51 56.24 -4.3705***
*p<0.1; **p<0.05; ***p<0.01, t-test for mean equality and chi2 test for relationship between categorical variables and period
Table 3: Descriptive statistics of explanatory variables
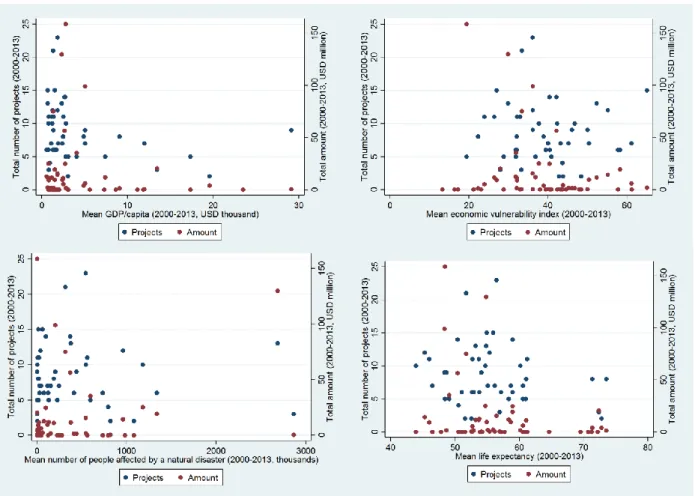
Figure 3 depicts the correlations between mean GDP per capita, mean EVI, mean people affected by a natural disaster, mean life expectancy and total Chinese health aid over the 2000-2013 period measured by the total number of health projects and the total amount of health ODA received. Graphically we find no pattern of correlation between the health need variables (number of people
12
affected by a natural disaster and life expectancy) and either the number of projects or the amount of health ODA received. No clear tendency can be drawn regarding the link between the amount of health ODA received and economic need variables as measured by the GDP per capita or the economic vulnerability index. On the contrary, there seems to be a negative correlation between the GDP per capita and the number of health projects received and a positive correlation between the economic vulnerability index and the number of projects received over the 2000-2013 period.
Figure 3: correlation between need variables and Chinese health aid
3. Method
In a first step we study the number of health ODA projects allocated by China to the different African countries. We decompose the analysis in two sub-periods, 2000-2006 and 2007-2013, given the high
increase in health ODA from China after the 3rd FOCAC in 2006 and the change in Chinese aid
diplomacy. In addition to the sub-period decomposition, we stratify the analysis by project type and distinguish between medical team dispatches and projects related to the construction of health infrastructures or the sending of medical equipment and drugs. In a second step we study the amount of health ODA received by African countries from China. Most medical team or technical assistance projects are not financially valued in the AidData database. Therefore, we decided to exclude these projects from the analysis of Chinese health ODA amounts. The analysis for ODA amounts then focuses on infrastructure and medical equipment/drug projects. However, some infrastructure or equipment and drug projects also lack data on their financial amount. Then, for each country-year, ODA amounts are coded as missing if data on financial amounts lack for all infrastructure and equipment/drug projects. If no infrastructure of equipment/drug project is recorded the ODA amount is reported as 0.
13
Given the important share of countries that benefits from no Chinese health ODA project or amount each year, simple regression techniques such as OLS cannot be used to estimate the factors associated with Chinese health ODA. Indeed, in the presence of many zero observations, OLS estimates would be biased toward 0 so that the effect of independent variables on the number of projects or the amount of health ODA received would be underestimated. To correct this bias, several types of econometric models are available. First, a Two-Part model can be used in order to estimate independently the factors associated with the reception of a positive value of Chinese health ODA and the factors associated with the aid volume among recipient countries. However, such model suffers from the risk of introducing a selection bias in the second step if the selection as a recipient by China is not independent of the volume of Chinese health aid received. The Heckman selection model allows to correct this selection bias at the cost of introducing an exclusion restriction which imposes that at least one independent variables must explain the selection process but not the volume of Chinese health aid received among recipient countries. In practice, this exclusion restriction is hard to satisfy in our analysis as variables which influence whether a country receives aid will probably also impact the volume of aid received. A third solution is then to use a Tobit model which estimates the factors associated with the volume of health aid in one step while correcting for the downward bias introduced by the many 0 observations. In this model, the independent variables are assumed to have the same impact on the fact of receiving a positive value of aid and on the volume of health aid received. Despite its appeal, the Tobit model imposes a homoscedasticity condition on residuals and produces biased estimates in the presence of heteroscedasticity. Therefore, we choose to use maximum likelihood Poisson regression models in order to study the factors associated with Chinese health ODA projects and amounts by country-year. Indeed, Silva and Tenreyro (2006 and 2011) have demonstrated that Poisson models outperform Tobit models in the presence of heteroskedasticity and many zero observations.
For both project number and project amount we use pooled regression models, rather than fixed effect models, given the low variability of some explanatory variables (for example the recognition of Taiwan or the control of corruption index). This allow us to exploit both inter and intra-country heterogeneity to analyze the factors associated with Chinese health aid. We run regression analyses where the number of health projects/the amount of health ODA received is regressed on a time dummy for sub-periods and on the interactions between the sub-period dummy and the explanatory variables presented in the previous section. We omit the main effects of the explanatory variables and only include the interactions of these variables with the sub-period dummy in order to estimate the separate coefficient of the independent variables in each sub-period. We then use Chi2 tests to check for coefficients equality between the two sub-periods. All regressions were run using robust standard errors clustered at the country level. Except for the number of other ODA projects from China, heath aid commitment from DAC countries and the number of people affected by a natural disaster (for which simultaneity with Chinese health ODA is of interest) all explanatory variables are lagged to mitigate concerns of reverse causality. To limit the multicolinearity issue, all continuous explanatory variables are centered. The results of multicolinearity diagnostic tests show that multicolinearity is not an issue (VIF < 3 and tolerance > 0.4 for all independent variables). Results are reported as incidence rate ratios (IRR) in order to quantify the impact of explanatory variables on the number of health projects and the amount of health ODA received.
All regression analyses were also run using the share of health projects and the share of health ODA amount received by African countries each year. These regression analyses were run using the fractional probit method developed by Papke and Wooldridge (1996) for the case of proportions as dependent variables. Again, all regressions were run using robust standard errors clustered at the country level, all explanatory variables are lagged to mitigate concerns of reverse causality (except for ODA projects from China, heath aid commitment from DAC countries and the number of people affected by a natural disaster) and all continuous explanatory variables are centered to limit multicolinearity.
14
4. Results
4.1 Number of health projects and ODA amounts
Table 4 presents the results of regression analyses for the number of health projects and the amount of health ODA received from China.
Number of health ODA projects
Total Medical teams Infrastructure / equipment and drugs
Amount of health ODA 2007-2013 sub-period 2.992*** 3.169*** 4.430*** 10.17 (Ref: 2000-2006) (0.895) (1.099) (2.424) (16.43) GDP/cap*(2000-2006) 0.826* 0.883 0.754* 0.937 (0.0829) (0.0898) (0.128) (0.222) GDP/cap*(2007-2013) 0.957** 0.956 0.965 1.060 (0.0184) (0.0361) (0.0218) (0.0588)
Public health expenditure*(2000-2006) 1.018 0.915 1.215 0.619
(0.135) (0.162) (0.226) (0.738)
Public health expenditure*(2007-2013) 0.879*** 0.951 0.783*** 0.443**
(0.0364) (0.0490) (0.0686) (0.151) Life expectancy*(2000-2006) 1.027 1.004 1.064 0.808 (0.0389) (0.0484) (0.0541) (0.185) Life expectancy*(2007-2013) 0.977* 0.995 0.961** 0.932 (0.0122) (0.0171) (0.0162) (0.0545) Population*(2000-2006) 0.990 0.972** 1.002 1.001 (0.00850) (0.0127) (0.00934) (0.0130) Population*(2007-2013) 0.992** 0.980*** 0.998 0.995 (0.00330) (0.00598) (0.00255) (0.00679)
Control of corruption index*(2000-2006) 0.419* 0.450 0.283** 0.640
(0.212) (0.298) (0.142) (1.485)
Control of corruption index*(2007-2013) 1.321* 0.990 1.658** 1.099
(0.201) (0.176) (0.387) (0.688)
Openness rate to China*(2000-2006) 1.233** 1.061 1.325* 1.790
(0.118) (0.130) (0.207) (0.656)
Openness rate to China*(2007-2013) 1.006** 1.007** 1.008** 1.007
(0.00278) (0.00334) (0.00370) (0.0187)
Oil rent*(2000-2006) 0.999 0.999 1.005 1.006
(0.00676) (0.0162) (0.0140) (0.0211)
Oil rent*(2007-2013) 1.006** 1.003 1.004 0.972
(0.00238) (0.00350) (0.00403) (0.0270)
Taiwan recognition*(2000-2006) 0.000000112*** 0.000000348*** 0.000000590*** 3.42e-13***
(6.13e-08) (0.000000217) (0.000000387) (3.29e-13)
Taiwan recognition*(2007-2013) 0.0899*** 0.0814** 0.109** 1.31e-13***
(0.0638) (0.0828) (0.114) (1.04e-13)
Voting alignment*(2000-2006) 5.018* 25.04*** 3.134 2.739
(4.286) (29.53) (4.057) (3.791)
Voting alignment*(2007-2013) 0.896 1.018 0.730 1.193
(0.252) (0.426) (0.303) (1.558)
Other Chinese ODA projects*(2000-2006) 1.043 0.881* 1.175 1.302**
(0.0732) (0.0663) (0.158) (0.149)
Other Chinese ODA projects*(2007-2013) 1.083** 0.994 1.156*** 0.931
(0.0337) (0.0400) (0.0521) (0.104)
Health ODA commitments DAC*(2000-2006) 1.005*** 1.009*** 1.001 1.008
(0.00173) (0.00203) (0.00326) (0.00624)
Health ODA commitments DAC*(2007-2013) 1.002 1.005* 1.001 1.006
(0.00152) (0.00246) (0.00161) (0.00578)
N 568 568 568 516
15
Regarding the economic need variable, the GDP per capita is negatively correlated with the total number of projects received over the two sub-periods which means that the poorer countries generally
tend to benefit from a higher number of projects7. A thousand dollar increase in GDP per capita is
associated with a 17.4 and 4.3% decrease in the number of health projects received from China over the 2000-2006 and 2007-2013 periods respectively. However, the result of the coefficient equality test show that there is no significant difference in the impact of GDP per capita on the number of projects received between the two periods (chi2 = 0.98, p = 0.3221). To test the robustness of this result, we also run the regression using the EVI instead of GDP per capita as the economic need variable (results not shown). We find different results as the EVI is not correlated with Chinese health aid over the 2000-2006 period but positively correlated with the total number of health projects and the number medical of medical teams received from China between 2007 and 2013.
Turning to health need variables, we find no significant association between life expectancy/public health expenditures as a share of GDP and Chinese health aid over the 2000-2006 period. On the contrary results of regression analyses show a negative correlation between public health expenditures as a share of GDP in recipient countries and the total number of health projects, the number of infrastructure and medical equipment/drug projects and the amount of health ODA received from China (but not the number of medical teams) over the 2007-2013 period. Over this period, a one percentage point increase in public health expenditures (as share of GDP) in recipient countries is associated with decreases of 12.1% and 21.7% in the total number of projects and in the number of infrastructure and medical equipment/drug projects financed by China respectively. This effect is even stronger for the amount of health ODA received since a one percentage point increase in public health expenditures is associated with a 55.7% decrease in the amount of health ODA received from China. Life expectancy is also negatively correlated with the total number of health projects and the number of infrastructure and medical equipment/drug projects received between 2007 and 2013. A one year increase in life expectancy is associated with 2.3 and 3.9 decreases in the number of health projects and the number of infrastructure and medical equipment/drug projects received over this period. As robustness check we also test whether child mortality and the number of people affected by a natural disaster are associated with Chinese health aid allocation. To do so, we consecutively replace life expectancy by one of these two variables in the regression analysis (results not shown). Results for the number of people affected by a natural disaster are the same as those obtained for life expectancy: the number of people affected by a natural disaster in never associated with Chinese health aid over the 2000-2006 period while it is positively correlated with the total number of health projects and the number of infrastructure and medical equipment/drug projects over the 2007-2013 period. Results for child mortality differ a bit from those of life expectancy: we find a positive, but really low, correlation between child mortality and the amount of health ODA received from China over the 2000-2006 period while child mortality is only associated with the number of infrastructure and medical equipment/drug projects over the 2007-2013 period. Finally, regarding population size, we find a negative correlation between this variable and the number of medical teams received from China over the whole study period (2000-2013) with no significant difference in the magnitude of this association between sub-periods (chi2 = 0.54, p = 0.4628).
Regarding “merit” variables, Chinese does not appear to disfavor more corrupt countries over the 2000-2006 period. Indeed, over this period, negative correlations are found between the control of corruption index and the number of total health ODA projects from China/the number of Chinese infrastructure and medical equipment/drug projects. This negative correlation indicates that countries in which the control of corruption is stronger have received a smaller amount of health aid from China over the period 2000-2006. The interpretation of this relationship is difficult, but it may suggest that an environment where the control of corruption is more flexible makes it easier to push specific interests,
7
We also tried to include squared GDP per capita but found no evidence of a nonlinear effect of GDP per capita.
16
whatever they may be. The association between the control of corruption index and Chinese health ODA is completely reversed in the 2007-2013 period compared to the period before 2007. Indeed, over the 2007-2013 period we find positive correlations between the control of corruption index and the total number of health ODA projects/the number of infrastructure and medical equipment or drug projects. These associations imply that less corrupt countries benefitted from more Chinese health aid, especially aid for infrastructure projects, in the 2007-2013 period. We also test the effect of other merit variables such as the regulatory quality or rule of law but found no link between these variables and Chinese health aid allocation to African countries over the whole study period.
For the economic interest variables, the rate of openness to China is positively correlated with the total number of projects received over the two sub-periods. Nevertheless, this relationship has faded in recent years as demonstrated by the test for equality of coefficient in each sub-period (chi2 = 4.57, p = 0.0325). Over the 2000-2006 period, a one percentage point increase in the openness rate to China was associated with a 23.3% increase in the number of health projects received while this increase was only of 0.6% in the 2007-2013 period. This result is coherent with our assumption that Chinese commercial interests were important in China’s aid allocation decisions after the market-oriented aid
reform in 1995 but less determinant after the 3rd FOCAC in 2006. When we decompose the analysis
by type of projects, we find that the positive association between the total number of health projects and the openness rate over the 2000-2006 period is explained by a strong correlation between this explanatory variables and the number of infrastructure and medical equipment/drug projects. On the other hand, the size of the oil rent is positively correlated with the total number of projects received over the 2007-2013 period. However, this relationship is of small magnitude: one percentage point increase in oil rent is associated with a 0.6% increase in the total number of health project received annually between 2007 and 2013. No other significant correlation between the oil rent in recipient countries and Chinese health ODA is found over the two sub-periods.
Political considerations appear to play an important role in Chinese health aid allocation decisions. Over the 2000-2006 period, the recognition of Taiwan by an African country almost systematically excludes it from Chinese health aid. The negative correlation between Taiwan recognition and Chinese health aid projects is significantly lower over the 2007-2013 period (chi2 = 214.24, p = 0.0000). However, even in this sub-period, this correlation remains of high magnitude as Taiwan recognition leads to a 91% reduction in the total number of health projects received. The allocation of Chinese health projects, in particular the dispatch of medical teams, is strongly influenced by the UNGA voting alignment of recipient counties over the 2000-2006 period. Countries who adopted UNGA voting patterns similar to China were highly favored by China over the 2000-2006 period but not the over 2007-2013 period.
The empirical analysis also highlights the complementarity of Chinese health ODA with its ODA in other sectors. Over the 2000-2006 period, the amount of Chinese health ODA is positively correlated with the number of Chinese ODA projects in non-health sectors: each additional project is associated with a 30.2% increase in health ODA amount received. For the 20007-2013 period, the number of Chinese ODA projects in other sectors is positively correlated with the number of health aid project received, in particular infrastructure and medical equipment/drug projects. Over this period, each additional non-health ODA project is associated with a 8.3% increase in the total number of health projects and a 15.6% increase in infrastructure and medical equipment/drug projects. This suggests that health cooperation between China and Africa lacks autonomy. Indeed, this cooperation seems to be part of a more global aid relationship between China and the recipient countries.
The allocation of Chinese health aid in African countries does not appear to be heavily related to health aid provided by traditional bilateral donors. Only low magnitude correlations are found between health ODA commitment of DAC donors and the number of medical teams received from China over the 2000-2006 and 2007-2013 periods. Indeed, a one million 2014 US$ increase in health ODA commitments received from DAC countries is only associated with a 0.5% to 0.9 decrease in the
17
number of Chinese medical teams over the whole study period. Therefore, health aid cannot be seen as a way for China to promote its international visibility.
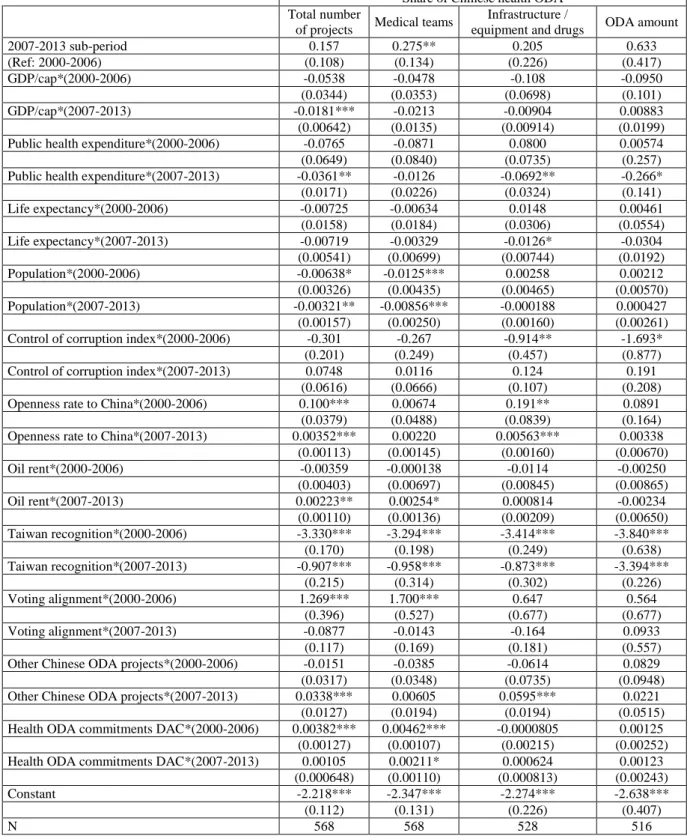
4.2 Testing robustness of the results: Share of Chinese health aid
Table 5 presents the results of the regression analyses for the share of health projects and the share of health ODA amount received by African countries from China. Results for health needs, China’s political and economic interests and the complementarity with non-health Chinese ODA or DAC health ODA commitments are very similar to those obtained when studying the number of health projects and the amount of health ODA. Results similarity for these variables tends to indicate that factors associated with Chinese aid allocation are the same than those associated with Chinese trade-off of aid allocation between the recipient countries.
Regarding health need variables, all results are similar to those obtained in the previous analysis except for the absence of correlation between life expectancy and the share of total health projects received over the 2007-2013 period. For GDP per capita, results differ from to those previously obtained for the 2000-2006 period. Over this period, the GDP per capita is never correlated with the share of Chinese health ODA received while it was negatively correlated with the total number of projects/the number of infrastructure and medical equipment or drug projects in the previous analysis. Then, between 2000 and 2006, the economic needs of recipient countries impacted the volume of Chinese health aid received but not Chinese trade-off of aid allocation between the recipient countries. Regarding the size of the population, all results are similar to those obtained in the previous analysis, except for the significant negative correlation found between the size of the population and the share of health projects received over the 2000-2006 period.
Turning to the merit variable, we find again a negative correlation between the control of corruption index and the reception of Chinese infrastructure and medical equipment/drug projects over the 2000-2006 period. On the contrary, results regarding the positive correlation between the control of corruption and the reception of Chinese health aid over the 2007-2013 period are not confirmed by the analysis of the shares of health projects and health ODA amount received. Indeed, we find no significant correlation between the control of corruption index and the share of Chinese health aid received (either for the number of projects of any type or the amount of health OAD) over this period. Regarding economic interest variables, results for the openness rate are very similar to previous regression analyses. As for the number of health projects (especially infrastructure and medical equipment/drug projects) or the amount of health ODA, the openness rate to China is positively correlated with the share of health projects but not with the share of health ODA amount over the two periods. These new specifications also confirm that the relationship between the openness rate and Chinese aid allocation has faded after 2006. Indeed, results of coefficient equality tests show that the association between the openness rate and the share of health projects/the share of infrastructure and medical equipment or drug projects is of less magnitude over the 2007-2013 period compared to the 2000-2006 period (chi2 = 6.61, p = 0.0101 for the share of health projects and chi2 = 4.83, p = 0.0279 for the share of infrastructure and medical equipment/drug projects). The analysis of the share of health projects confirms the absence of correlation between oil rent and Chinese health ODA allocation over the 2000-2006 period. For the 2007-2013 period we again find a positive, but very low magnitude, correlation between the oil rent and the allocation of Chinese health aid projects.
18
Share of Chinese health ODA
Total number
of projects Medical teams
Infrastructure /
equipment and drugs ODA amount
2007-2013 sub-period 0.157 0.275** 0.205 0.633 (Ref: 2000-2006) (0.108) (0.134) (0.226) (0.417) GDP/cap*(2000-2006) -0.0538 -0.0478 -0.108 -0.0950 (0.0344) (0.0353) (0.0698) (0.101) GDP/cap*(2007-2013) -0.0181*** -0.0213 -0.00904 0.00883 (0.00642) (0.0135) (0.00914) (0.0199)
Public health expenditure*(2000-2006) -0.0765 -0.0871 0.0800 0.00574
(0.0649) (0.0840) (0.0735) (0.257)
Public health expenditure*(2007-2013) -0.0361** -0.0126 -0.0692** -0.266*
(0.0171) (0.0226) (0.0324) (0.141) Life expectancy*(2000-2006) -0.00725 -0.00634 0.0148 0.00461 (0.0158) (0.0184) (0.0306) (0.0554) Life expectancy*(2007-2013) -0.00719 -0.00329 -0.0126* -0.0304 (0.00541) (0.00699) (0.00744) (0.0192) Population*(2000-2006) -0.00638* -0.0125*** 0.00258 0.00212 (0.00326) (0.00435) (0.00465) (0.00570) Population*(2007-2013) -0.00321** -0.00856*** -0.000188 0.000427 (0.00157) (0.00250) (0.00160) (0.00261)
Control of corruption index*(2000-2006) -0.301 -0.267 -0.914** -1.693*
(0.201) (0.249) (0.457) (0.877)
Control of corruption index*(2007-2013) 0.0748 0.0116 0.124 0.191
(0.0616) (0.0666) (0.107) (0.208)
Openness rate to China*(2000-2006) 0.100*** 0.00674 0.191** 0.0891
(0.0379) (0.0488) (0.0839) (0.164)
Openness rate to China*(2007-2013) 0.00352*** 0.00220 0.00563*** 0.00338
(0.00113) (0.00145) (0.00160) (0.00670) Oil rent*(2000-2006) -0.00359 -0.000138 -0.0114 -0.00250 (0.00403) (0.00697) (0.00845) (0.00865) Oil rent*(2007-2013) 0.00223** 0.00254* 0.000814 -0.00234 (0.00110) (0.00136) (0.00209) (0.00650) Taiwan recognition*(2000-2006) -3.330*** -3.294*** -3.414*** -3.840*** (0.170) (0.198) (0.249) (0.638) Taiwan recognition*(2007-2013) -0.907*** -0.958*** -0.873*** -3.394*** (0.215) (0.314) (0.302) (0.226) Voting alignment*(2000-2006) 1.269*** 1.700*** 0.647 0.564 (0.396) (0.527) (0.677) (0.677) Voting alignment*(2007-2013) -0.0877 -0.0143 -0.164 0.0933 (0.117) (0.169) (0.181) (0.557)
Other Chinese ODA projects*(2000-2006) -0.0151 -0.0385 -0.0614 0.0829
(0.0317) (0.0348) (0.0735) (0.0948)
Other Chinese ODA projects*(2007-2013) 0.0338*** 0.00605 0.0595*** 0.0221
(0.0127) (0.0194) (0.0194) (0.0515)
Health ODA commitments DAC*(2000-2006) 0.00382*** 0.00462*** -0.0000805 0.00125
(0.00127) (0.00107) (0.00215) (0.00252)
Health ODA commitments DAC*(2007-2013) 0.00105 0.00211* 0.000624 0.00123
(0.000648) (0.00110) (0.000813) (0.00243)
Constant -2.218*** -2.347*** -2.274*** -2.638***
(0.112) (0.131) (0.226) (0.407)
N 568 568 528 516
Table 5: Results of regressions analyses for the share of health aid received
We find no difference in the effects of political interest variables (Taiwan recognition and UNGA voting alignment with China) between our first analysis and the analysis of the share of health projects or the share of health ODA amount. Taiwan recognition highly decreases the share of health aid projects and the share of health ODA amount received by African countries over the whole study
19
period. UNGA voting alignment with China is positively correlated with the share of projects received over the 2000-2006 period but not over the 2007-2013 period.
Regarding the complementarity of Chinese health aid with its non-health aid, we find similar results for the 2007-2013 period. However, for the 2000-2006 period, we find no significant correlation between the Chinese non-health ODA projects and Chinese health aid shares received by recipient countries. Regarding the relationship between Chinese and DAC countries health aid, we find perfectly similar results for aid in absolute values and aid shares. Indeed, only small significant correlations are found between the share of projects/the share of medical teams and DAC countries’ health aid commitments over the 2000-2006 period and between the share of medical teams and DAC countries’ health aid commitments between 2007 and 2013.
5. Discussion
Our results suggest that, except for the recognition of Taiwan, there is no factor that plays a major and uniform role on Chinese aid allocation over the 2000-2013 period. Our analyses show that need, merit and self-interest variables influence Chinese health aid allocation in different ways depending on the period or the type of health projects analyzed. But several general patterns of the Chinese aid allocation can be drawn from our results.
Needs. Globally, the trend is that China allocated more health aid to poorer countries over the whole study period. Chinese health aid also tends to favor African countries with higher health needs as measured by life expectancy or the share of GDP that is devoted to public health expenditures. However, this trend varies according to the type of health projects and the sub-period considered. Indeed, we find no significant correlation between health needs of recipient countries and Chinese health aid over the 2000-2006 period. On the contrary our results show that Chinese health aid was responsive to the health needs of recipient countries after 2006. This is true for all measures of Chinese heath aid except for the dispatch of medical teams. These results are robust to the use of the number of people affected by a natural disaster, instead of life expectancy, as a measure of health need in recipient countries. They are coherent with results of Dreher and Fuchs (2015) who finds that the sending of Chinese medical teams to African countries does not react to short-term disasters over the 1979-1995 period. As highlighted for ODA allocation decisions of traditional donors (Alesina and Dollar, 2000; Berthélemy and Tichit, 2004; Dollar and Levin, 2006; Younas, 2008) and new donors such as India (Fuchs and Vadlamannati, 2013), the allocation of Chinese health aid is also less
favorable to comparatively more populated countries8, especially for the dispatch of medical teams.
Merits. Our results show that China did not disfavor countries where the corruption was stronger in the
allocation of its health aid over the 2000-2006 period. On the contrary, over this period, countries where the control of corruption was weaker received more Chinese health aid, especially for infrastructure and medical equipment/drug projects. These results might reflect the non-interference principle applied by Beijing in its diplomatic relationships. On the other hand, it might reveal a pragmatic allocation of Chinese health aid as an environment where the control of corruption is weaker makes it easier for China to push other specific interests. These results are in line with the aid allocation literature which has shown that corruption in recipient countries does not impact aid allocation decisions of traditional or new donors (Clist, 2011; Nunnenkamp and Thiele, 2013, Lee and Lim, 2014). It is also in line with previous results found for China by Dreher and Fuchs (2015) who show that governance of African countries (measured by a binary indicator for democracy) did not influence Chinese aid allocation between 1990 and 2006. Nevertheless, after 2006, the role of
8
As is the case for the literature on ODA in general which highlights a bias against highly-populated countries that receive less ODA (bilateral and multilateral) per capita than others.
20
governance quality in recipient countries on Chinese health aid allocation decision seems to have changed. Indeed, over the 2007-2013 period we find a positive correlation between the control of corruption index and the number of health aid projects, especially infrastructure and medical equipment/drug projects, received from China. This might reflect the change in Chinese interior policy with the emergence of the anti-corruption policy at the national level. However, this association must be interpreted with caution as the regression analyses made on the shares of Chinese health aid received do not confirm that China allocated more health aid to less corrupt countries between 2007 and 2013.
Chinese interests. For economic interest variables, the openness rate to China appears to be positively
associated with a favorable allocation of Chinese health aid over the 2000-2006 period. The relationship between commercial interests of China and its health aid allocation tends to fade over the 2007-2013 period. Dreher et al. (2015) find that total the aid share for African recipient countries increases with their imports from China over the 1995-2006 period which corresponds to period following the aid reform of 1995 that emphasized the linkages between aid and trade. Our results confirm the importance of Chinese commercial interest in the allocation of its aid, especially health aid, in the early 2000’s. However, it seems that the link between trade and aid was reduced after the 2006 FOCAC, at least for health aid. We find no strong evidence that Chinese health aid allocation decisions are associated with recipient countries’ oil endowment. This confirms the finding of Dreher and Fuchs (2015) who only find a low magnitude correlation between oil production of African countries and the dispatch of medical teams over the 1979-1995 period.
The allocation of Chinese health aid appears to be strongly linked to some aspects of its foreign policy. Over the all period of study (2000-2013), and for all types of projects, African countries which chose to recognize Taiwan were almost entirely excluded from Chinese health aid. These results confirm those found by Dreher et al. (2015) for Chinese aid allocation to African countries. However, if UNGA voting alignment with China appears determinant for the allocation of Chinese total health aid projects and medical teams’ allocation over the 2000-2006 period, voting alignment no longer seems to influence Chinese health aid in the 2007-2013 period.
The empirical analysis also highlights the complementarity of Chinese health ODA with its ODA in other sectors, (which might suggest a weak autonomy of health aid regarding the aid policy at country level?) and that the allocation of Chinese health aid in African countries does not appear to be heavily related to health aid provided by traditional bilateral donors, suggesting that health aid cannot be seen as a way for China to promote its international visibility.
6. Conclusion
Over our study period that runs from 2000 to 2013, two phases of the Chinese aid policy have been distinguished: the 2000-2006 period that followed the 1995 aid reform which highlighted the links
between aid, trade and investment and the 2007-2013 period that followed the 3rd FOCAC where
Chinese authorities announced a doubling of their aid to Africa and the emergence of new strategic partnership with an objective of “mutual benefit and win-win situations”, which was reasserted by the Second White Paper on China’s Foreign Aid (2014). As we hypothesized, Chinese economic interests are less stringent in China’s aid allocation decisions over the 2007-2013 period compared to the 2000-2006 period. Chinese political interests, as measured by recipient countries’ UNGA voting alignment
with China, were also less important in Chinese health aid allocation decisions after the 3rd FOCAC in
2006. On the other hand, health needs of recipient countries became more visible in Chinese health aid allocation decisions after 2006. Thus, the health diplomacy of China seems to have evolved after the third FOCAC in 2006 from a rather “selfish” aid focused on political and economic self-interests to a