https://doi.org/10.1021/ma0617320
READ THESE TERMS AND CONDITIONS CAREFULLY BEFORE USING THIS WEBSITE. https://nrc-publications.canada.ca/eng/copyright
Vous avez des questions? Nous pouvons vous aider. Pour communiquer directement avec un auteur, consultez la première page de la revue dans laquelle son article a été publié afin de trouver ses coordonnées. Si vous n’arrivez pas à les repérer, communiquez avec nous à PublicationsArchive-ArchivesPublications@nrc-cnrc.gc.ca.
Questions? Contact the NRC Publications Archive team at
PublicationsArchive-ArchivesPublications@nrc-cnrc.gc.ca. If you wish to email the authors directly, please see the first page of the publication for their contact information.
NRC Publications Archive
Archives des publications du CNRC
This publication could be one of several versions: author’s original, accepted manuscript or the publisher’s version. / La version de cette publication peut être l’une des suivantes : la version prépublication de l’auteur, la version acceptée du manuscrit ou la version de l’éditeur.
For the publisher’s version, please access the DOI link below./ Pour consulter la version de l’éditeur, utilisez le lien DOI ci-dessous.
Access and use of this website and the material on it are subject to the Terms and Conditions set forth at
Photomechanical effects in azo-polymers studied by neutron
reflectometry
Yager, Kevin G.; Tanchak, Oleh M.; Godbout, Chris; Fritzsche, Helmut;
Barrett, Christopher J.
https://publications-cnrc.canada.ca/fra/droits
L’accès à ce site Web et l’utilisation de son contenu sont assujettis aux conditions présentées dans le site LISEZ CES CONDITIONS ATTENTIVEMENT AVANT D’UTILISER CE SITE WEB.
NRC Publications Record / Notice d'Archives des publications de CNRC:
https://nrc-publications.canada.ca/eng/view/object/?id=eecae0d0-f627-4c85-a847-dfacdf4964b5 https://publications-cnrc.canada.ca/fra/voir/objet/?id=eecae0d0-f627-4c85-a847-dfacdf4964b5Photomechanical Effects in Azo-Polymers Studied by Neutron
Reflectometry
Kevin G. Yager,† Oleh M. Tanchak,†Chris Godbout,† Helmut Fritzsche,‡and Christopher J. Barrett*,†
Department of Chemistry, McGill UniVersity, Montreal, QC, Canada, H3A 2K6, and Canadian Neutron Beam Centre, National Research Council, Chalk RiVer, ON, Canada K0J 1J0
ReceiVed July 31, 2006; ReVised Manuscript ReceiVed October 5, 2006
ABSTRACT: Neutron reflectometry is used to study photomechanical effects in thin films of azobenzene polymer cast onto silicon substrates. A significant photoexpansion effect, up to 17%, is observed at 25°C, due to the free volume requirement of the azobenzene chromophore photoisomerization. Above a distinct crossover temperature of ∼50°C, the material response is inverted and instead photocontraction effects, of more than -15%, are observed. In this case the combined photomotion and thermal mobility enables aggregation and crystallization of the azobenzene dipoles. The photomechanical effects, which can be reversed, occur readily using a variety of irradiation powers, incident polarizations, and film thickness values. This photomechanical behavior, which appears to be general to all azo materials, is likely the origin for a wide variety of curious photomotions observed in these systems, including macroscopic bending of samples and micron-scale surface mass transport.
Introduction
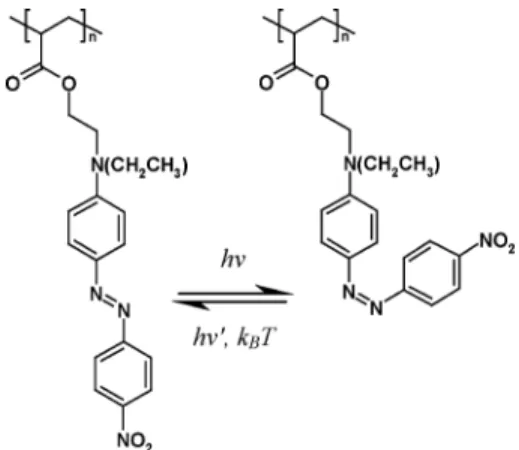
Azobenzene polymers exhibit a wide range of photo-responses,1,2 due to a clean and efficient molecular
photo-isomerization (see Figure 1). When the azobenzene (azo) chromophore is irradiated within its broad absorption spectrum, the molecule will isomerize into the metastable cis isomer state. The azo will then thermally relax back into the more stable trans state, or this back-isomerization can be induced photo-chemically. For the pseudo-stilbene class of azo molecules (which are the subject of study in this work), the trans and cis spectra overlap. For these molecules, irradiation with a single wavelength of light (in the range of 450-490 nm) causes continual cycling of the molecules between the two isomeric states. This molecular isomerization generates unique types of material motion at larger length-scales. The azo chromophore can be photoaligned with polarized light due to a statistical reorientation process (whereby chromophores accumulate per-pendicular to the irradiation polarization, since they become inert to the light), which has also been used to photoalign liquid crystalline mesophases.3,4In fact, even circularly polarized light
will eventually induce some measure of alignment, as chro-mophores line along the light propagation direction. The azo chromophore can also be used to switch material properties,5
and thus these systems have been considered in applications ranging from optical devices to sensors. Another unique effect observed in the azo systems is a clean and facile surface topography patterning that occurs when these materials are irradiated with a light intensity gradient. This single-step patterning occurs at room temperature, well below the material’s bulk glass transition temperature (Tg). Although extensively
studied, this surface mass transport phenomenon is not yet fully understood.6 The azos have also been shown to generate
macroscopic photomechanical effects, such as the expansion of thin films floating on a water surface,7 the bending of
free-standing polymer films irradiated with polarized light,8,9 and
even macroscopic motion of floating films.10
Recently we investigated the photomechanical effect in azobenzene thin films by measuring the light-induced expansion of these materials using ellipsometry,11an optical technique that
determines thickness and refractive index by analyzing the polarization change induced in a probe laser beam upon reflection. It was found that the thin azo films photoexpand during irradiation at an absorbing wavelength, with both a reversible and irreversible contribution (see Supporting Informa-tion, Figure S1). The irreversible expansion persists after illumination ceases, whereas the reversible expansion can be cycled on and off using the pump laser. The extent of expansion can be tuned with irradiation power and time. These experiments demonstrated a decrease in refractive index concomitant with the increase in thickness, corroborating the conclusion of photoexpansion. In these experiments, care was taken to avoid photoorientation in the material, by using circularly polarized light and modest irradiation times. This was required because ellipsometry, being an optical technique that measures the average refractive index, cannot be easily applied to anisotropic media. Due to the azo’s strong optical response, all-optical techniques are limited in their ability to probe these materials.
* Corresponding author. E-mail: chris.barrett@mcgill.ca.
†McGill University. ‡National Research Council.
Figure 1. Chemical structure of poly(disperse red 1 acrylate) (pdr1a) and its associated photoisomerization. Azobenzene chromophores will isomerize from the stable trans state into the metastable cis state with light irradiation. The molecule will then thermally relax back to the trans state or may be photoisomerized into that state.
10.1021/ma0617320 CCC: $33.50 © 2006 American Chemical Society Published on Web 12/01/2006
Not only does photoorientation generate birefringence, which makes optical analysis ambiguous, but optical probes, even those at wavelengths far away from the absorption maximum, can lead to measurable changes in the material.
To resolve these ambiguities, we have probed the photo-mechanical effect in azobenzene thin films using neutron reflectometry. Because neutron scattering is sensitive to nuclear density (and not electronic properties), it can be used to unambiguously determine thin film thickness and density, regardless of any anisotropy in the electronic refractive index. It also enables extraction of the entire film profile, rather than simply estimating average thickness and density. In this paper, we describe a neutron reflectometry study of the photomechani-cal phenomenon in azo materials. We employed a custom-built sample cell12that allows measurement of neutron reflectivity
simultaneous with optical irradiation and furthermore enables control of the sample temperature. Thus, we quantify the photomechanical response of the material as a function of temperature. In addition to confirming the photoexpansion effect measured optically, we have also found evidence for a unique photocontraction behavior that occurs at elevated temperature. Using neutron reflectometry, we are able to unambiguously identify the photoexpanded state and the higher-density photo-contracted state.
Experimental Methods
Sample Preparation.Unless otherwise stated, the azo-polymer
material used in this work was poly (disperse red 1 acrylate) (pdr1a), whose chemical structure is shown in Figure 1. The 2 chlorine-substituted analogue of this material poly (disperse red 13 acrylate) (pdr13a) was also used for a small number of experiments (refer to Supporting Information, Figure S2, for chemical structure). Polymers were synthesized as previously reported.13The substrates employed were polished single-crystal silicon (111) wafers with a thin (∼20 Å) silicon dioxide layer. The wafers were cut into small pucks, 6 mm thick and 24 mm in diameter. This small sample size is necessary in order to ensure that the entire sample is homoge-neously irradiated with laser light. The substrates were cleaned using a warm piranha solution (mixture of 30% H2O2and concentrated H2SO4 in 1:3 ratio) for 30 min. Caution: piranha solution is a powerful oxidizer and reacts violently with organics. This surface treatment also enhances polymer adhesion, greatly improving film homogeneity and decreasing surface roughness.
Samples were prepared by spin-coating azo-polymer solutions (using anhydrous THF as solvent) onto the cleaned silicon substrates. The solution was placed on the substrate, which was then ramped (acceleration 1260 rpm/s) to 1300 rpm, and maintained for 35 s. Film thickness was adjusted by varying the solution concentration (in the range of 10-1to 10-3mol/L, based on repeat unit molecular mass). Film thickness in the range of 200-600 Å was chosen so as to produce high-quality reflectivity curves with a substantial number of Kiessig fringes within the available qz
-range. The cast thin films were annealed in a vacuum oven at 110
°C for 8 h to remove any residual solvent or flow-induced orientation.
Neutron Reflectometry.The neutron reflectivity experiments
were performed at Chalk River Laboratories Canada (National Research Council), using the C5 triple-axis spectrometer. Measure-ments were performed using neutrons of wavelength λ ) 2.37 Å, in specular reflection mode. The momentum transfer, qz )(4π/
λ)sin θ, was varied between 0.006 Å-1and 0.07 Å-1by varying the specular reflection angle, θ. The collimation slits were opened sufficiently so as to overilluminate the sample with the neutron beam, such that the sample itself defines the reflected beam profile. Scans were performed in two segments with different slit settings: from qz)0.006 Å-1to 0.04 Å-1and from 0.04 Å-1to 0.07 Å-1.
The relative resolution, ∆qz/qz, varies from 0.15 to 0.03 in the first
segment and from 0.05 to 0.03 in the second segment. The two
scan regions were found to overlap exactly. A pyrolitic graphite filter was used to suppress the signal from the λ/2 and λ/3 components of the monochromator reflection. Furthermore, an analyzer was used to diffract the reflected beam into the detector. This analyzer and detector geometry was found to reduce the background signal considerably. Background scans were performed by offsetting the sample by a fixed angular displacement of +0.5°
and have been subtracted from all the results presented. The detector count time was varied as a function of qz in order to maintain
uniform and reasonable statistics for the entire scan region. The data were normalized using the critical reflectivity edge.
Experimental Setup. The samples were placed in a
custom-built cell that enables neutron scans simultaneous with optical irradiation (refer to Supporting Information, Figure S3). The details of this cell design have been previously reported.12The cell features an aluminum enclosure that is transparent to neutrons, and a PMMA optical window that allows for optical irradiation. The sample was fixed, with thermal contact grease, on a heating block with a thermocouple, allowing for accurate control of temperature. Unless otherwise stated, scans were performed at a constant temperature of 25°C (i.e. ‘room temperature’). The sample cell was held under vacuum during all temperature ramping to prevent sample oxidation. When required, a flow of inert gas (helium or nitrogen) was used to cool the cell and sample. Optical irradiation was performed using two air-cooled argon-ion lasers, tuned to the 488 nm line. Two lasers were used so as to increase the overall irradiation power and also to average out any coherence effects. One of the laser beams was reflected off of an adjacent mirror such that both beams become nearly collinear. The output of one laser was adjusted with a lens to account for slight differences in laser divergence. The polarized laser output was converted into circularly polarized light using a λ/4 wave plate. Circular polarization is used to prevent in-plane orientation of the azo chromophores, known to occur readily when irradiating with polarized light. For those experiments requiring polarized irradiation, the wave plate was removed. A series of lenses was used to expand and collimate the beam such that the sample experienced homogeneous irradiation of the surface. Since neutron reflectivity could be measured during thermal ramping and laser irradiation, we were able to ensure that the sample had stabilized at a new temperature, or after laser irradiation, before beginning the full reflectometry scan.
Data Analysis.The normalized neutron reflectometry curves
were fit to scattering length density (SLD) profiles using Parratt’s dynamic approach.14Initial one-box fits were performed using the Parratt32 software (provided by HMI);15however, more sophisti-cated fits were required. These were performed using software code made publicly available by Thad Harroun (Brock University),16 custom-modified to accommodate our fitting procedure. The instrument resolution was included in the fitting procedure. Data were first fit using a simple one-box model. This fit was then refined by allowing for a Gaussian distribution of thickness across the sample surface. This improved fit was then further refined by allowing the film profile to vary in the film-normal (z) direction. The final fit represents a minimization of the film profile as well as the macroscopic thickness distribution.
Optical Reflectometry.Optical reflectivity scans in the angular
range from 20°to 80°were performed on the samples after neutron measurements, using the Multiskop instrument (Optrel, Germany). By using the thickness measured from neutron reflectometry, the optical reflectometry data could be fit with very little ambiguity. The three orthogonal refractive indices were then extracted by fitting the curves using custom-written software that implements the transfer matrix formalism for layered optical media.17
Results and Discussion
Fitting Procedure.Thin films of azo-polymer, spin-coated
onto silicon substrates, were measured using neutron reflec-tometry. The resulting reflectivity curves contained numerous oscillations (so-called Kiessig fringes18) which result from
interference between neutron reflections from sample interfaces.
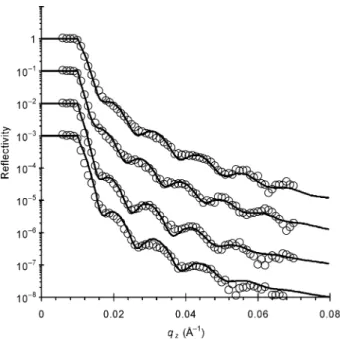
Lacking absolute phase information, neutron reflectivity data cannot be directly inverted. Instead, a range of models must be considered. The final selected model must describe the experi-mental data and provide a physically reasonable description of the system. Figure 2a shows a typical neutron reflectometry curve, and various possible fits to the data, presented in order to assess the quality of four different fitting models. The first possibility (uppermost curve) is a simple one-box model, where the thin film is taken to be a microscopically rough (22 Å), but otherwise a homogeneous and flat slab of material on top of the substrate, which in turn is modeled as a thin layer of silicon dioxide on top of an infinite slab of silicon. This fit correctly describes the film thickness, as indicated by the spacing of the oscillations in the data. However, the fit does not fully match the experimental data. In particular, the minima of the oscilla-tions in the fit are much deeper than the actual data. This mismatch is not merely a matter of microscopic roughness blurring the reflectivity curve, as shown by the second fitting model. In the second model (second curve from the top in Figure 2a), a one-box film with increased roughness (double the initial model, i.e., 44 Å) is compared to the data. As can be seen, this
causes a significant decrease in the absolute reflectivity of the model curve, and it no longer describes the experimental data. In fact it was found that, with this model, no combination of film thickness, scattering length density (SLD), and film roughness could match the profile minima and maxima. However, roughness in these calculations is modeled as a smearing of the interface, which properly describes the coherent averaging that the neutron beam probes when surface variation is smaller than the neutron coherence length. In cases when surface variations are larger than the neutron coherence length, there is no interference between the reflections from distinct film regions. In such a case, modeling involves a sum and average of the distinct neutron reflectivity curves, rather than a sum and average of the SLD profiles. This is an incoherent average, where we are summing the relative reflection intensi-ties, instead of a microscopic coherent average, where one would sum the relative reflection amplitudes. The third model (third curve in Figure 2a) fit to the data shows the result of allowing for this macroscopic variation of sample thickness. In particular, a Gaussian distribution of film thickness values (centered about the nominal thickness from the one-box model) involves averaging a distribution of neutron reflectivity curves. This averaging does indeed reduce the depth of the minima, without decreasing the absolute reflectivity. This assumption allows us to generate much more reliable and reasonable fits to the data. The lateral extent of the neutron coherence varies as a function of angle as Lcoh)2π/(∆qzsin θ), which corresponds to
45-230 µm for the present data. Thus, the fits indicate that the sample thickness varies across the macroscopic sample surface, with a size scale larger than ∼230 µm. Although the spin-casting technique used to generate the samples creates highly homo-geneous films with consistent thickness, it is nevertheless quite reasonable to suggest that the sample thickness varies by ∼20 Å across the 23 mm sample surface. Moreover, this large-scale thickness variation is easily confirmed using optical techniques. A slightly better fit to the data can be obtained by augmenting the thickness-distribution model by allowing for a small variation of the sample profile in the film normal (z) direction. The lowest curve in Figure 2 shows such a model, with the corresponding Gaussian thickness-distribution and nominal film profile shown below. The fit to the data is very good, and the film profile (with a slight decrease of film density near the surface) is reasonable. It should also be noted that merely allowing for complex profiles in the z-direction (without a thickness-distribution) cannot properly reproduce the intensity of the measured reflectivity. All the fits presented are thus the result of allowing for both thickness distribution and some small density variation in the film profile. It is also worth noting that the film SLD, obtained from the best fits, was always in the range 2.2-2.4 × 10⁻⁶Å-2, corresponding to a physical density
of 1.2-1.3 g/cm3, which is consistent with previous
measure-ments on these materials.19
Photoexpansion. In the previous ellipsometry study of
photoexpansion in azo materials,11it was found that the material
expanded as a result of laser irradiation of sufficient power, if the wavelength was inside the azo absorption band. Both a reversible photoexpansion, which occurs only when the laser light illuminates, and an irreversible photoexpansion, which persists even after irradiation ceases, were identified. The present experiments used a unique sample cell to enable neutron measurements simultaneous with optical irradiation. Because a full neutron reflectivity scan requires 8-12 h, it was not possible to fully characterize the material state during irradiation using this technique. However, the present sample cell enabled us to Figure 2. (a) Comparison of the quality of model fits. In all four curves,
the open symbols are the same experimental data, whereas the solid line is a model reflectivity curve based on a particular SLD profile. In the uppermost curve, a one-box model (thickness 499 Å, surface roughness 22 Å) is simulated. The position and spacing of the Kiessig fringes matches the data (indicating that the model film thickness is correct). However, the minima in the fit data are much deeper than the experimental data. The second curve shows a similar one-box model with double the surface roughness (44 Å). The absolute reflectivity decreases substantially, demonstrating that this ‘blurring’ of the minima in the data is not due to effective roughness. The third curve shows that by allowing for a Gaussian distribution of film thickness values across the sample surface, the data can be fit properly. The correspond-ing thickness distribution is shown in part b. The final model allows not only for a macroscopic thickness distribution, but also for a more complex SLD profile. The fit in this case properly reproduces all features of the data. The corresponding SLD profile is shown in part c.
measure at particular values of the momentum transfer, qz, during irradiation.12Consistent with the ellipsometry data, a shift
in reflectivity is observed when the laser light was active, indicating some amount of physical change. With both tech-niques, it was observed that this small reversible photoexpansion was superimposed on top of a larger light-induced expansion that did not relax after the irradiation ceased. The irreversible photoexpansion was readily probed by neutron reflectometry by measuring a thin film before and after illumination. Because the sample cell enabled this to be performed without removing the sample, the instrument and sample alignment are identical for all the scans, thereby removing this ambiguity from data fitting.
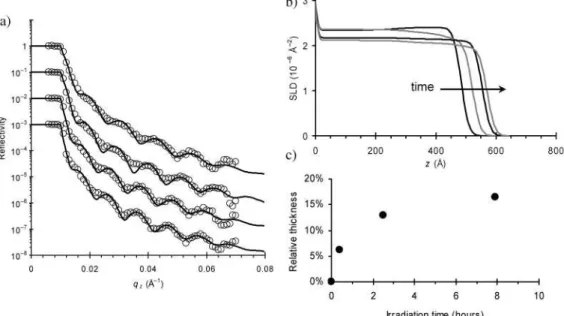
Figure 3a shows reflectivity curves for a thin azo-polymer film as it is irradiated with 488 nm laser light (circularly polarized, 38 mW/cm2) for progressively longer periods of time.
The scans were performed after the illumination light was deactivated and the material allowed to relax. The corresponding film profiles are shown below. As can be seen in Figure 3b, the neutron reflectivity data immediately confirms the ellip-sometry data. The film thickness increases substantially with irradiation, and a corresponding decrease in the film density is also recorded. By integrating the area beneath the SLD profile, we confirmed that mass is conserved in the photoexpansion process. The extent of expansion is shown in Figure 3c, where it can be seen that the thin film expansion saturates to ∼17% after ∼8 h irradiation. In the previous ellipsometry work, irradiation times were more modest and the extent of expansion was correspondingly smaller, and consistent with the neutron data. The SLD profiles also enable us to analyze this photo-mechanical phenomenon as a function of depth into the film. Because the azobenzene chromophore is a strong absorber (extinction coefficient ǫ488nm)5.30 µm-1), the intensity of laser
light decreases exponentially as the beam travels through the film. This creates a light intensity gradient inside the material. Because the experiments were performed on polished silicon substrates, the incident beam will be reflected and travel through the material a second time. For the films considered here, the intensity of laser light at the substrate is ∼40% lower than at the film surface. The film profiles shown in Figure 3b indicate
that the surface region, where light intensity is greater, expands preferentially. For the ∼30 min illumination, the density of the surface region has decreased compared to the initial value, whereas the bulk of the film has not changed. With greater irradiation time, the entire film becomes photoexpanded in a nearly uniform way. This demonstrates that there is a power dependence to the photoexpansion but also proves that the entire film is able to expand with sufficient irradiation time and/or power.
Photocontraction.A unique material response was
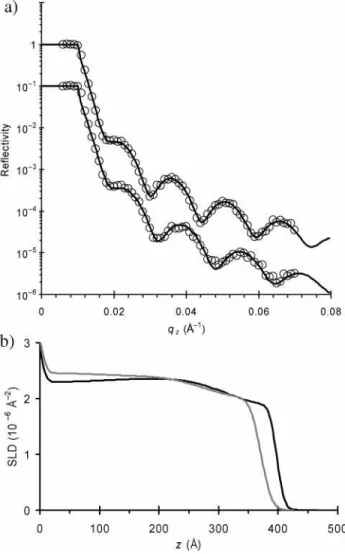
discov-ered here for thin films of azo-polymer irradiated at elevated temperatures. In Figure 4a, reflectivity curves are shown for a thin film held at 85°C, before (upper curve) and after (lower curve) irradiation with 62 mW/cm2. The film SLD profiles,
corresponding to the fits, are shown in Figure 4b. At this temperature, the laser irradiation has generated a significant photocontraction, rather than the photoexpansion established at room temperature (25°C). By integrating the area under the SLD profile, we can again confirm that this is a mass-conserving transformation. The neutron reflectivity data provide a sensitive probe of density and in this case indicate that the material has become denser than the usual bulk value (∼0.02 g/cm3denser
near the center of the film). This densification is likely due to reorganization of the azobenzene chromophores, with the azo groups undergoing dipole pairing and aromatic stacking.
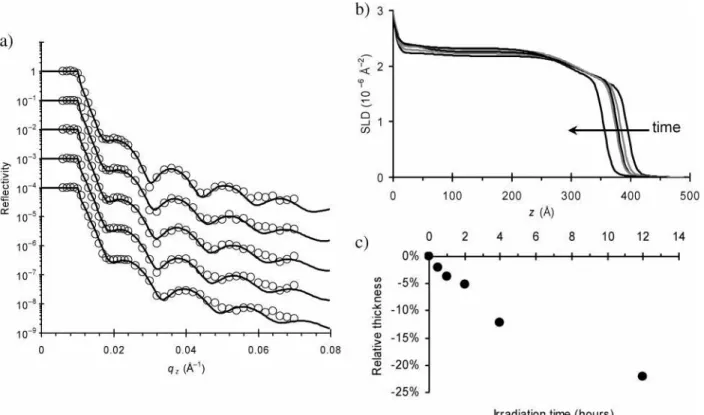
This photocontraction effect was observed in a wide variety of samples. In Figure 5, data is presented for a thin film held at 80°C, as it is irradiated with laser light (circularly polarized, 62 mW/cm2) for progressively longer periods of time. Again a
mass-conserving photocontraction effect is observed, that becomes larger in magnitude as irradiation time proceeds. Note that although mass was conserved for most irradiation times (integrated area under the SLD profile deviates from the initial value by <1%), for extremely long irradiation times at elevated temperatures (notably 12 h irradiation at 80 °C) there is a measurable (∼4%) decrease in the integrated SLD area. Since these films were annealed (at 110°C) before measurement, and because this effect only appears with irradiation, it is likely related to some form of photoinitiated cleavage of the azo bond, with subsequent thermal release of the cleavage products. This Figure 3. (a) Neutron reflectivity data (open symbols) and corresponding fits (solid lines) for a thin azo-polymer film irradiated at room temperature with 38 mW/cm2laser light for progressively longer periods of time. The total irradiation time for the curves (going from top to bottom) is 0 h, 0.4 h, 2.5 h, and 7.9 h. (b) The associated SLD profiles clearly show that the thin film is expanding with increased irradiation. (c) The total change in film thickness saturates with irradiation time.
is entirely consistent with the usual optical observation of color loss seen for azo films subjected to extreme conditions. For this reason, the irradiation times were kept below these extreme levels for all other experiments. The film profiles shown in Figure 5b do not show any evidence for preferential contraction near the surface of the film or the substrate. The densification appears throughout the material in a uniform way. Figure 5c shows that substantial amounts of photocontraction (∼15%) can be obtained with a few hours of irradiation. Note that, to preserve the sample for later optical investigation, a separate sample of comparable thickness was used to measure the long-time response (12 h irradiation data point).
Photomechanical Effect.The observed photoexpansion and
photocontraction can be viewed as two manifestations of a photomechanical phenomenon in azo-polymer systems. Figure 6 shows the photomechanical response (expansion or contrac-tion) of azo films irradiation for 2 h with 62 mW/cm2laser
light. A photoexpansion effect is observed at lower temperatures, whereas a distinct photocontraction occurs at sufficient tem-perature. The steady change in response (with a crossover at ∼50°C) suggests a competition between two effects. At low temperatures, the azobenzene molecular isomerization forces expansion of the local polymer network, to accommodate the free volume requirements of the azo isomerization. Larger-scale
motion in the polymer network is, however, impossible, and the resultant expanded state is frozen in. While the azo chromophores are somewhat mobile within their respective free volume pockets, larger scale migration of the chromophores is not possible. As temperature is increased, the higher polymer mobility allows for relaxations in the network that counteract the expansion effect (as discussed later, the thermal expansion coefficient of the material is negligible). Above a certain temperature (above ∼50°C for pdr1a), the combined effect of photoinduced motion and thermal motion enables the chro-mophores to move within the polymer matrix, aggregate, and form a denser contracted state. A molecular modeling study of two azobenzene polymer chains interacting confirmed that the low-energy state occurs when the azo chromophore dipoles are aligned and undergo aromatic stacking (see Supporting Informa-tion, Figure S4). This azo dipole association is well established in the liquid crystal literature, although this crystalline state is not typically accessible to amorphous polymers. On the basis of our present results, it appears that irradiation with light at elevated temperatures enables the azo chromophores to reorient and overcome an energy barrier, such that they aggregate and crystallize. It should be noted that this photoinduced aggregation is occurring well below the material’s glass-to-rubber transition temperature (Tg). Similar behavior has been observed in the azo
system for other types of photomotions, such as photoorientation and surface patterning, which are both readily initiated below Tg.
Figure 7 shows reflectivity data for different types of thermal treatment. The upper two curves represent a thin film held at 25 °C (uppermost curve) and the same film after thermal ramping to 80°C (second curve). The two curves are identical (and can be fit with the same film model), demonstrating that thermal treatment alone does not give rise to any measurable change in film thickness or density. Thus, the physical changes being observed here are due to the azobenzene isomerization, and not merely annealing. The denser photocontracted state is not achieved with heat treatment alone, which suggests that photoinduced alignment is required in some way. It is likely that photoorientation generates seed crystals, which can then be thermally annealed and grown into a higher-density state. The lower three curves in Figure 7 show a thin film that has been irradiated with 38 mW/cm2at room temperature (which
leads to an expansion) and subsequently heated to 80°C. This purely thermal treatment step has evidently caused the thin film to contract. This effect is not merely a reversal of the expanded state: with sufficient thermal treatment, various films were found to thermally contract to a state thinner than the original film thickness. This was only observed, however, in films that had been irradiated with laser light. This effect was also seen by ellipsometry, where, for instance, an irradiated thin film annealed above Tg was found to be ∼3.5% thinner than the
original film thickness.
The formation of a denser state with combined heat and light treatment has also been seen in the formation of surface relief gratings (SRGs).20,21In that work, a stable surface pattern was
generated at room temperature and then thermally erased. During this heat treatment, a density grating, coincident with the original SRG but buried beneath the surface of the material, was found to form. This indicates that light treatment generates some form of seeding crystals that can then be thermally annealed into a higher-density semicrystalline state. Similarly, we have observed that photoirradiation (which certainly induces some measure of chromophore orientation) seeds the material, such that subse-quent thermal treatment induces contraction and densification. Figure 4. (a) Neutron reflectivity data (open symbols) and
corre-sponding fits (solid lines) for a thin azo-polymer film held at 85°C. The upper curve is before laser illumination, and the lower curve is after 2 h irradiation with 62 mW/cm2laser light. (b) The SLD profiles show clearly that irradiation at this temperature leads to a photocon-traction, with decrease in film thickness and a corresponding increase in film density.
Thermal Considerations. An experiment was performed
where the azo film was irradiated using a 15 mW/cm2broadband
incoherent light source. In this case the neutron reflectivity curve showed no appreciable difference before, during, or after irradiation. Furthermore, samples that had been irradiated to the point of being photobleached (which involves destruction of the azo bond) became unresponsive to laser illumination. Previous calculations22also allow us to neglect photoheating
effects. Given the present irradiation conditions, a temperature rise of only a few degrees would be expected. For the samples held at elevated temperatures, the changes in film density are again directly related to laser irradiation of the azo material. Merely changing the sample temperature caused essentially no change in the reflectivity curve (relative thickness difference <0.4%). The thermal expansion of the thin film can also be neglected, since it is orders of magnitude smaller than the observed effect (the thermal expansion coefficient of a polymer is typically <10-5K-1). It is thus clear that the observed changes
are due to laser illumination and not merely sample heating. Moreover, it is clear that the effects are related to the azobenzene chromophore and its molecular isomerization.
Other Variables.The photomechanical effects are sensitive
to laser power for short irradiation times. However, for the long Figure 5. (a) Neutron reflectivity data (open symbols) and corresponding fits (solid lines) for a thin azo-polymer film held at 80°C and irradiated with 62 mW/cm2laser light for progressively longer periods of time. The total irradiation time for the curves (going from top to bottom) is 0 h, 0.5 h, 1 h, 2 h, and 4 h. (b) The corresponding SLD profiles show film contraction and associated densification. (c) The photocontraction scales with irradiation time. For this long-time irradiation at elevated temperature, some amount of material loss from the film was detected.
Figure 6. Magnitude of the photomechanical effect (photoexpansion or photocontraction) as a function of the temperature at which irradiation takes place. The relative change in film thickness is shown, based on a variety of thin films all irradiated with 62 mW/cm2 of 488 nm circularly polarized light for 2 h. A crossover from photoexpansion to photocontraction occurs at ∼50°C.
Figure 7. Analysis of the thermal component of photomechanical changes. The upper two curves are a thin film measured at room temperature (upper curve) and again at 80 °C. The two curves are identical (and are described using the same model data), showing that thermal treatment alone does not give rise to any material changes. The third curve corresponds to a thin film before irradiation (25°C), and the fourth curve shows the same sample after photoexpansion (2 h irradiation, 38 mW/cm2) at 25°C. The final curve shows the same film heated to 80°C, where a contraction effect is observed without laser illumination.
irradiation times considered here (>30 min), it was found that the extent of thickness change was not strongly related to irradiation intensity, whereas it was sensitive to the irradiation time. This indicates that for the powers considered here (>30 mW/cm2), the material response is saturated, and the process
of expansion or densification is limited not by isomerization frequency or efficiency but by the reorganization of the azo side-groups, and motion of polymer chains in the material. The photomechanical effects were observed in all thin azo films studied, across the thickness range from 200 to 600 Å. The relative amount of photoexpansion and photocontraction, after 2 h irradiation, was not found to depend on film thickness. Instead it again appears that the studied irradiation power (>30 mW/cm2) is sufficient to fully expand films in this thickness
range. It should be noted that in the previous ellipsometry study,11 the photoexpansion was sensitive to both irradiation
power and film thickness. However, the irradiation times in that study were considerably shorter, and it is likely that the entire film volume was not undergoing saturated photomechanical change. For the longer irradiation time and relatively high irradiation power considered here, a saturated response is measured.
The observed photomechanical effects appear to be general to azo polymers. A similar extent of photoexpansion was measured with thin films of poly(disperse red 13 acrylate) (pdr13a). This polymer is similar to pdr1a, except that it has a Cl substituent at the 2′position of aromatic ring. Given that the azobenzene’s other unique motions (such as photoorientation and surface mass transport) are quite general and appear in nearly all samples, these photomechanical effects are likely present in all azo-polymer systems. In fact, a large number of the unusual photomotions observed in azo systems are probably related to this photomechanical effect. For instance, the mac-roscopic bending and unbending of liquid crystalline azo films8,9
may be a manifestation of the photocontraction effects described here. The free surface of these films contracts to a greater extent than the bulk (since the light intensity is higher at the surface, owing to sample absorption), and this gradient in contraction leads to macroscopic deformation. It appears to be a general trend that liquid crystalline azo samples will photocontract with irradiation, rather than photoexpand as amorphous systems tend to.7,23 This is likely occurring because the liquid crystalline
samples, being highly mobile, are above the expansion-to-contraction crossover temperature even at room temperature. It is possible that these samples, if cooled sufficiently, will exhibit photoexpansion behavior instead. For typical amorphous poly-mers well below Tg, the molecular mobility is arrested and
photocontraction effects cannot occur. Instead, the frustrated azo motion leads to deformation of the polymer matrix and a net expansion.
Linearly Polarized Irradiation.The effect of incident laser
polarization was also studied. Figure 8 shows an example of a thin film irradiated with 38 mW/cm2at 25°C, and a thin film
irradiated with 62 mW/cm2at 80°C, for 2 h. In both cases, the
thin films respond similarly to irradiation with circularly polarized light. That is, the thin film at 25°C photoexpanded by 10%, whereas the film at 80°C photocontracted by 8%. Although the photocontraction phenomenon is attributed to photoalignment, irradiation with linearly polarized light (which typically induces greater ordering and alignment) did not increase the magnitude of the contraction effect. This may be because photoorientation necessarily decreases the fraction of azo chromophores undergoing isomerization (since they are no longer addressed by the incident light), which would tend to
decrease the photomotion required for photomechanical effects. It is also worth noting, however, that the final amount of photoorientation is quite small. Using the thickness measured with neutron reflectivity, one can fit optical reflectivity reliably to determine the three orthogonal components of the refractive index (nx, ny, nz). Figure 9 compares the optical reflectivity data for a thin film photocontracted using circularly polarized light compared to linearly polarized light. In both cases, the data are well described by assuming only an isotropic refractive index (nx)ny)nz). Thus the higher-density azo crystallites have an isotropic orientational distribution. We attempted to directly detect the azo crystallites by using the neutron spectrometer’s Figure 8. Effect of irradiating azo films with linearly polarized light. The upper two curves represent a thin film before (upper curve) and after (second curve) irradiation at 25 °C. The bottom two curves represent a thin film before (third curve) and after (final curve) irradiation at 80°C. The effects are identical to those measured with circularly polarized light, where photoexpansion occurs at room temperature, whereas photocontraction occurs at elevated temperatures.
Figure 9. Optical reflectivity data (solid black lines) and associated model fits (thin gray lines) for azo-polymer films after photocontraction. The model fits were obtained using the thickness from neutron reflectivity and allowing the three orthogonal refractive indices to vary. In both cases of a sample photocontracted with circularly polarized light (a) and linearly polarized light (b), the final sample is isotropic.
triple-axis mode and scanning for Bragg peaks arising from the azo crystal spacing. Although the Bragg peak due to the silicon substrate was detected, no peaks due to the azo film were detected in films irradiated with either circularly or linearly polarized light. Detection of Bragg peaks in the selected geometry would require that the azo crystals be oriented with their spacing normal to the sample surface. The lack of a Bragg peak could be due to the formation of a single azo crystal that is not within the selected scattering plane. However, the more likely explanation is that the azo crystallites are oriented randomly (i.e. the sample is polycrystalline), and the Bragg peak intensity is therefore too weak to be detected. Future experiments using powder diffraction on a sufficient sample volume might be able to detect the crystals.
Reversibility. The photomechanical effect studied here
appears to be partially reversible. For thin films photoexpanded at room temperature, photocontraction at elevated temperatures was thereafter possible. For instance, an initial 545 Å film was photoexpanded (2 h at 38 mW/cm2) by 11% at 25 °C. A
subsequent irradiation at 80°C (2 h at 38 mW/cm2) caused a
contraction to a state 5% thinner than the original film thickness. The photocontracted state persists regardless of thermal treat-ment, including annealing above the polymer Tg. In fact, any
thermal treatment step (after irradiation) leads to further material densification (up to a certain saturation limit). However, the photocontracted state can evidently be partially reversed by irradiating again below the crossover temperature. For instance, an initially 395 Å film was photocontracted at 85°C (2 h at 62 mW/cm2) to a state 7% thinner than the original film and then
further photocontracted at 110 °C (2 h at 62 mW/ cm2) to a
state 15% thinner than the original film. This film was then irradiated at 25°C (2 h at 62 mW/cm2), where it photoexpanded
to a state 2% thicker than the original film. Thus, irradiation can be used to reverse the contracted state to some extent, although the efficiency of the process appears reduced. It is not known whether greater irradiation time or power could be used to expand the film to the ∼17% saturation limit. Again it appears that at low temperature the matrix cannot relax and reorganize. The azo isomerization breaks the dipole pairing, creating free volume pockets and expanding the polymer matrix. However the material cannot relax back into a densified state without the addition of some thermal mobility.
Perspectives.Given that nearly all the photomotions
discov-ered for azo materials are general (occurring in all cases where photoisomerization occurs), it is likely that this photomechanical phenomenon is present in most azobenzene systems. In fact, it may very well be that numerous effects observed with azos can in fact be explained in the context of this photomechanical effect. For instance, the macroscopic bending of free-standing liquid crystalline azo films was attributed to contraction at the film surface.8,9That these materials photocontract at room
temper-ature is consistent with the present findings, given that the highly mobile liquid crystalline systems probably have a low crossover temperature and thus are in the photocontraction regime at room temperature. Similarly, findings that showed that a liquid crystalline and a similar amorphous system had opposite macroscopic expansion/contraction behavior7can be attributed
to a difference in crossover temperature. According to this explanation, the liquid crystalline samples should exhibit photoexpansion if cooled sufficiently.
Importantly, the present results identify that the photo-mechanical effect is localized and occurs in nanometer-sized samples. This thus links the macroscopic observations of photomechanical phenomenon to the microscopic photomotions
that have been characterized in azo materials. In particular, the all-optical formation of surface relief structures that occurs when azo materials are irradiated with light gradients may in fact be due to the photomechanical effect. Spatial variation of light intensity would generate an internal stress distribution in the material (owing to a gradient in expansion/contraction effects), which would then drive material motion. This is essentially equivalent to the isomerization-pressure model already pre-sented to account for azo surface patterning,24,25now with the
inclusion of a microscopic explanation for the driving force. With regard to applications, such as photoactuation, the identified photomechanical effect offers some unique features. With the addition of localized temperature control (which could also be laser-based), the range of motion is quite large: from -15% to +15%. The photomechanical transformations have both reversible and irreversible aspects, which can each be exploited as required by device characteristics (two-state values or reversible actuation). Importantly, by using light, one may actuate a device remotely and without other energy requirements.
Conclusions
Using neutron reflectometry, we have identified two compet-ing photomechanical effects in azo polymer systems: one that causes expansion of the polymer matrix, and one that induces contraction of the material. We are able to measure the expansion and contraction effects unambiguously, since neutron reflectometry probes the physical density rather than the optical refractive index (which may be anisotropic and time-varying). Temperature can be used to alter the relative importance of the two photomechanical effects, switching from photoexpansion behavior below a characteristic crossover temperature to photo-contraction behavior above this temperature. Both effects (expansion and contraction) are stable over time, although they can be reversed with subsequent light irradiation steps. We attribute the photoexpansion to the azobenzene molecular isomerization, which requires a certain free volume to proceed, and thereby induces a local pressure in the material. The polymer matrix then expands to accommodate this molecular motion but cannot relax at low temperature. We attribute the photocon-traction to the formation of seed crystals due to photoorientation, that is, pairing and aggregation of the azo dipoles, which are able to crystallize and thereby increase material density. This photomotion and relaxation of the polymer matrix is only possible when the combined effects of light-induced and thermally enabled motion reaches a critical value. For the materials studied here, this crossover temperature is ∼50 °C.
Acknowledgment. Neutron fitting software code was
gener-ously made available by Thad Harroun (Brock University). We thank Mike Watson for design and construction of the sample cell, Faisal Aldaye for help with molecular modeling, and Nasir Ahmad for materials synthesis. Research funds were provided by NSERC Canada, the FQRNT Centre for Self-Assembled Chemical Structures, and the Canadian Foundation for Innova-tion.
Supporting Information Available: Plot of relative thickness
measurements vs time (Figure S1), chemical structure of pdr13a (Figure S2), experimental setup for measuring photophysical changes in azo films (Figure S3), and molecular model of two chains of pdr1a. This material is available free of charge via the Internet at http://pubs.acs.org.
References and Notes
(1) Natansohn, A.; Rochon, P. Chem. ReV. 2002, 102, 4139.
(2) Yager, K. G.; Barrett, C. J. J. Photochem. Photobiol., A 2006, 182, 250.
(3) Ichimura, K. Chem. ReV. 2000, 100, 1847.
(4) Yu, Y. L.; Ikeda, T. J. Photochem. Photobiol., C 2004, 5, 247. (5) El Halabieh, R. H.; Mermut, O.; Barrett, C. J. Pure Appl. Chem. 2004,
76, 1445.
(6) Yager, K. G.; Barrett, C. J. Curr. Opin. Sol. State Mater. Sci. 2001,
5, 487.
(7) Bublitz, D.; Helgert, M.; Fleck, B.; Wenke, L.; Hvilsted, S.; Ramanu-jam, P. S. Appl. Phys. B: Lasers Opt. 2000, 70, 863.
(8) Yu, Y.; Nakano, M.; Ikeda, T. Nature 2003, 425, 145.
(9) Ikeda, T.; Nakano, M.; Yu, Y.; Tsutsumi, O.; Kanazawa, A. AdV.
Mater. 2003, 15, 201.
(10) Camacho-Lopez, M.; Finkelmann, H.; Palffy-Muhoray, P.; Shelley, M. Nat. Mater. 2004, 3, 307.
(11) Tanchak, O. M.; Barrett, C. J. Macromol. 2005, 38, 10566. (12) Yager, K. G.; Tanchak, O. M.; Barrett, C. J.; Watson, M. J.; Fritzsche,
H. ReV. Sci. Instrum. 2006, 77.
(13) Natansohn, A.; Rochon, P.; Gosselin, J.; Xie, S. Macromolecules 1992,
25, 2268.
(14) Parratt, L. G. Phys. ReV. 1954, 95, 359.
(15) Braun, C. Parratt32, ver. 1.5. HMI Berlin, 1999; www.hmi.de/bensc/ instrumentation/instrumente/v6/refl/parratt_en.htm.
(16) Harroun, T. Parratt, ver. 1.3. Brock University, 2006; http:// www.physics.brocku.ca/faculty/harroun/parratt/index.html. (17) Hecht, E. Optics, 4th ed.; Addison Wesley: Reading, MA, 2002. (18) Kiessig, H. Ann. Phys.-Berlin 1931, 10, 769.
(19) Brown, D.; Natansohn, A.; Rochon, P. Macromol. 1995, 28, 6116. (20) Geue, T.; Henneberg, O.; Grenzer, J.; Pietsch, U.; Natansohn, A.;
Rochon, P.; Finkelstein, K. Colloids Surf., A 2002, 198-200, 31. (21) Pietsch, U.; Rochon, P.; Natansohn, A. AdV. Mater. 2000, 12, 1129. (22) Yager, K. G.; Barrett, C. J. J. Chem. Phys. 2004, 120, 1089. (23) Holme, N. C. R.; Nikolova, L.; Hvilsted, S.; Rasmussen, P. H.; Berg,
R. H.; Ramanujam, P. S. Appl. Phys. Lett. 1999, 74, 519.
(24) Barrett, C. J.; Natansohn, A. L.; Rochon, P. L. J. Phys. Chem. 1996,
100, 8836.
(25) Barrett, C. J.; Rochon, P. L.; Natansohn, A. L. J. Chem. Phys. 1998,
109, 1505. MA0617320