Article
Strigolactones Play an Important Role in Shaping
Exodermal Morphology via a KAI2-Dependent
Pathway
Guowei Liu,
Marina
Stirnemann,
Christian
Gu¨beli, ..., Didier
Reinhardt, Enrico
Martinoia,
Lorenzo Borghi
[email protected] (E.M.) [email protected] (L.B.) HIGHLIGHTSStrigolactones induce the presence of hypodermal passage cells (HPC) in the root
ABA, ethylene, auxin, and karrikins negatively regulate the density of HPC
HPC density is regulated by the KAI2/MAX2 signaling pathway
Hormonal cross talk regulates HPC density and therefore hypodermis permeability
Liu et al., iScience17, 144–154 July 26, 2019ª 2019 The Authors.
https://doi.org/10.1016/ j.isci.2019.06.024
Article
Strigolactones Play an Important Role
in Shaping Exodermal Morphology
via a KAI2-Dependent Pathway
Guowei Liu,
1Marina Stirnemann,
1Christian Gu¨beli,
1Susanne Egloff,
1Pierre-Emmanuel Courty,
2Sylvain Aubry,
1Michiel Vandenbussche,
3Patrice Morel,
3Didier Reinhardt,
4Enrico Martinoia,
1,*
and Lorenzo Borghi
1,5,*
SUMMARY
The majority of land plants have two suberized root barriers: the endodermis and the hypodermis (exodermis). Both barriers bear non-suberized passage cells that are thought to regulate water and nutrient exchange between the root and the soil. We learned a lot about endodermal passage cells, whereas our knowledge on hypodermal passage cells (HPCs) is still very scarce. Here we report on fac-tors regulating the HPC number in Petunia roots. Strigolactones exhibit a positive effect, whereas sup-ply of abscisic acid (ABA), ethylene, and auxin result in a strong reduction of the HPC number. Unex-pectedly the strigolactone signaling mutant d14/dad2 showed significantly higher HPC numbers than the wild-type. In contrast, its mutant counterpart max2 of the heterodimeric receptor DAD2/MAX2 displayed a significant decrease in HPC number. A mutation in the Petunia karrikin sensor KAI2 ex-hibits drastically decreased HPC amounts, supporting the hypothesis that the dimeric KAI2/MAX2 re-ceptor is central in determining the HPC number.
INTRODUCTION
Many plant roots possess two barrier layers, the exodermis (or hypodermis) and endodermis (Sharda and Koide, 2008; Rich et al., 2014). Both layers consist of a sheet of cells with suberin-coated (suberized) imper-meable cell walls, but they also contain a limited number of non-suberized ‘‘passage cells’’, which allow the passage of liquids and solutes. However, the passage cells from exodermis and endodermis differ in several structural and functional aspects (Peterson and Enstone, 1996). The inner layer, the endodermis, is structur-ally very similar in most plants, and only few are known to lack an endodermis (Enstone et al., 2002). The cells of the endodermis are surrounded by the Casparian strips that block the apoplastic passage between cells, thereby acting as a barrier between the cortex and the stele, and restricting ion transport to trans-cellular transport across the endodermis. Rare non-suberized endodermal cells, so called endodermal passage cells, facilitate transport across the endodermis and act as important players for ion sequestration in the stele (Barberon et al., 2016). Recent work showed that endodermal passage cells are localized close to the xylem (Andersen et al., 2018), and it was suggested that hormonal signaling from the vasculature pro-motes their differentiation. Similar to the endodermis, the hypodermis contains non-suberized hypodermal passage cells (HPCs) that are thought to facilitate the uptake of nutrients into the cortex. A hypodermal layer occurs in the majority of land plants, including many staple food crops (Shishkoff, 1987).
Significant progress has been made in our understanding of the differentiation of the endodermis and its pas-sage cells (Barberon et al., 2016; Doblas et al., 2017; Andersen et al., 2018); however, much less is known about the formation of the hypodermis and the HPCs. Early work showed that the degree of HPC suberization increases when plants suffer water stress and that the increased suberization protects plants from water loss (Hose et al., 2001). In addition to their suspected role in facilitating nutrient transfer, HPCs are shown to serve as gateways for arbuscular mycorrhizal fungi (Sharda and Koide, 2008), which establish a symbiosis that allows plants to efficiently scavenge for mineral nutrients such as phosphate. HPCs express the ABCG protein PLEIOTROPIC DRUG RESISTANCE 1 (PDR1), which is localized to the plasma membrane (Kretzschmar et al., 2012; Sasse et al., 2015) and mediates secretion of the phytohormone strigolactones (SLs) that promote mycorrhization by inducing fungal hyphal branching (Parniske, 2008; Al-Babili and Bouwmeester, 2015).
Increased expression of PDR1 results in higher SL secretion (Sasse et al., 2015) and stronger mycorrhizal colonization (Liu et al., 2018a, 2018b). In contrast, pdr1 ko mutants exude very low amounts of SL and
1Department of Plant and
Microbial Biology, University of Zurich, 8008 Zurich, Switzerland
2Laboratoire Reproduction et
De´veloppement des Plantes, Univ Lyon, ENS de Lyon, UCB Lyon 1, CNRS, INRA, 69342 Lyon, France
3Department of
Reproduction and Plant Development, CNRS/INRA/ENS, 69634 Lyon, France 4Department of Biology, University of Fribourg, 1700 Fribourg, Switzerland 5Lead Contact *Correspondence: [email protected] (E.M.), [email protected](L.B.) https://doi.org/10.1016/j.isci. 2019.06.024
exhibit decreased mycorrhizal colonization rates nearly similar to the SL biosynthetic mutant dad1 (Kretzschmar et al., 2012). Based on this collective evidence, we investigated whether PDR1 or SLs play a role on the presence of HPC.
RESULTS
HPCs are non-suberized cells of the hypodermis, i.e., they are located just beneath the thin, non-suberized epidermis. The method of choice to identify HPCs is trypan blue staining, as already reported in several publications (Figures 1A–1I, seeTransparent MethodsandTable S1) (Shishkoff, 1987; Peterson and En-stone, 1996; Kretzschmar et al., 2012). A protocol based on fluorol yellow, previously used for endodermal passage cell quantification in Arabidopsis, could not be applied because of hypodermal auto-fluorescence in Petunia (Figures S1A–S1D). First, we determined the numbers of HPCs in pdr1 and dad1 mutant lines and their corresponding wild-type (WT) backgrounds. Both pdr1 and dad1 mutants exhibited only about half the HPC density (HPCs/cm of root) in their primary root compared to the WT (Figures 1J and 1K, black bars). HPCs were quantified (1) per centimeter of root length (Figures S1E and S1F), (2) per total root length, and (3) as a fraction of all hypodermal cells (&) (Transparent Methods) (Figures S2A–S2E). The latter ways of quantification allowed us to normalize HPC density for root length in centimeters and cell number, respec-tively (Figures S2F and S2G). Altogether, these results show that plants defective in SL biosynthesis or secretion have fewer HPCs. The fact that HPC density was fully restored in dad1 and pdr1 mutants by the addition of rac-GR24, a synthetic SL analogue, shows that HPC presence is stimulated by SL (Figures 1J and 1K, gray bars).
The HPC density in roots was shown to decrease over time (Sharda and Koide, 2008), presumably as a result of gradually increasing suberin deposition in hypodermal cells. This results in a developmental gradient with the highest HPC density at the root tip and decreasing density along the proximal parts of the root (Figures S1E and S1F). To assess the dynamics of HPC density, we performed a time course experiment over 6 weeks of root development. The HPC density decreased in the WT (V26) from an initial 13 HPC/ cm root to less than 5, whereas dad1 had <5 HPC/cm root length at all times (Figure 1L). Similar, albeit less significant, results were obtained with lateral roots (Figure 1M).
SLs are part of a complex hormonal regulatory network that also involves auxin, ABA, and ethylene ( Hay-ward et al., 2009; Lopez-Raez et al., 2010; Ueda and Kusaba, 2015); hence, we investigated the impact of these hormones on HPC differentiation. ABA is known to promote suberization of plant tissues (Leide et al., 2012; Boher et al., 2013; Ueda and Kusaba, 2015), and, in line with this function, exogenous ABA application decreased the density of HPCs in WT Petunia roots as well as in pdr1 and dad1 mutants ( Fig-ure 2A). DAD1 and PDR1 are involved in SL biosynthesis and exudation, respectively (Kretzschmar et al., 2012). PDR1 is induced by SL, whereas DAD1 is subject to negative feedback regulation by SL (Sasse et al., 2015). We quantified PDR1 and DAD1 expression levels after treatments with rac-GR24 and ABA. In both WT backgrounds (W115XW138 and V26) PDR1 was upregulated by rac-GR24 and downregulated by ABA, whereas DAD1 was downregulated by both rac-GR24 and ABA (Figures S3A and S3B).
Ethylene is an established negative regulator of mycorrhizal development (Martı´n Rodriguez et al., 2010). To test the effect of ethylene on HPC density, we treated Petunia seedlings either with the ethylene precursor ACC (aminocyclopropane-1-carboxylic acid) or the ethylene releaser ethephon. This allowed us to increase endogenous ethylene production (from ACC) and exogenous ethylene exposure (from ethephon). Both treat-ments strongly reduced the density of HPCs in three WT backgrounds (Figure 2B). This result is consistent with the reported negative effect of ethylene on plant mycorrhization (Varma Penmetsa et al., 2008).
Previous studies have shown that PDR1, as well as the SL biosynthesis genes CAROTENOID CLEAVAGE DEOXYGENASE7 (CCD7)/RAMOSUS5 and CCD8/RAMOSUS1, is upregulated by auxin (Hayward et al., 2009; Kretzschmar et al., 2012). Thus, auxin could potentially increase HPC density through increased SL biosynthesis and secretion. In contrast, however, the auxin NAA caused strongly reduced HPC densities at concentrations of 1mM (Figure 2C) or 100 nM NAA (Figure S3C). Auxin can induce ethylene biosynthesis; hence, the reduction of HPC density by auxin could potentially be caused by increased ethylene levels (Hansen and Grossmann, 2000). However, addition of the ethylene antagonist AVG (amino-ethoxy-vinyl-glycine) to the medium did not reverse the decrease in HPC density caused by auxin (Figure 2C), indicating that the reduction of HPC density by auxin does not involve ethylene. We further tested the effect of auxin on HPC presence using transgenic petunia lines that express p35CaMVS:indoleacetic acid-lysine
Figure 1. Effect of Strigolactones (SL) on Hypodermal Passage Cell Density
(A–I) Trypan-blue-stained HPCs. Top view on the epidermal layer (A), hypodermis (B), inner cortex layer one (C), inner cortex layer two (D), and stele (E). Root tip from primary root (F), differentiated cells in root segment 7 cm above the root tip (G), representative HPCs in WT (H), and in dad1 (I).
(J and K) HPC density in the SL transporter mutant pdr1 and in the SL biosynthesis mutant dad1; the density of HPCs in the SL biosynthesis mutant dad1 can be restored by exogenous 10mM GR24.
(L and M) HPC density dynamics in primary and lateral roots of V26 and dad1 mutant. HPC density was quantified in 2-, 3-, 4-, 5-, and 6-week-old seedlings.
Stars above the bars indicate statistically significant difference (t test, *p% 0.05, **p % 0.01, ***p % 0.001). For clear view of data, scales inFigures 1J–1M are different. Scale bar, 50mM (A–E, H, and I) and 250 mM (F and G). Error bars are GSEM.
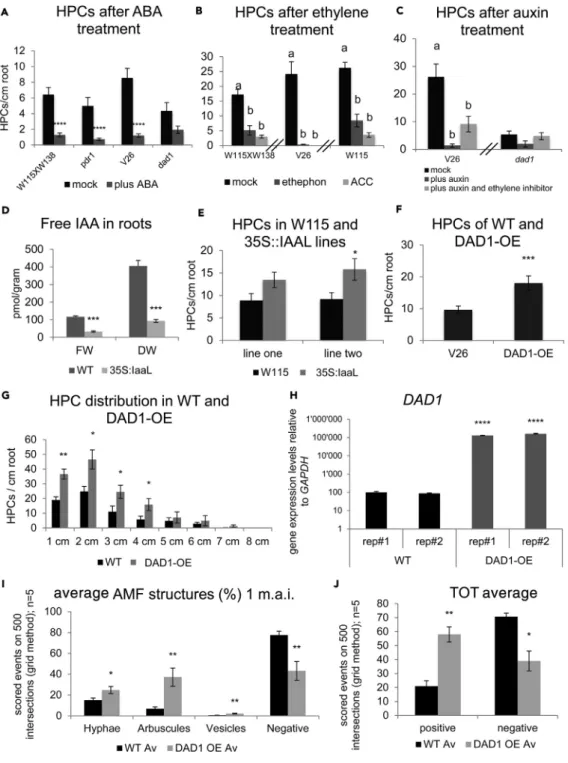
Figure 2. Exogenous Hormonal Treatments Affect HPCs Density
(A) Effect of 1mM ABA on HPC density.
(B) Effect of ethylene on HPC density (1mM ethephone or 5 mM ACC). (C) Effect of 1mM Auxin (NAA) and 10 mM AVG on HPC density.
(D) Free auxin content in WT and 35S:IaaL lines expressed relative to both fresh weight (FW) and dry weight (DW). (E) HPC densities in Petunia plants transgenic for the over-expression of the auxin-lysine conjugation enzyme (35S:IaaL). (F) HPC density in V26 and DAD1-OE roots.
(G) HPC distribution in WT and DAD1-OE lines. (H) DAD1 expression in WT and DAD1-OE lines.
(I) Arbuscular mycorrhizal (AM) structures quantified in WT and DAD1-OE roots 1 month after inoculation (m.a.i.) with Rhizophagus irregularis: hyphae, intraradical arbuscules, and vesicles. Negative means no AM structure detected. (J) Mycorrhization rates in W115 and DAD1-OE.
synthetase (35S:IaaL). IaaL conjugates IAA to lysine, thereby depleting endogenous free IAA pools (Romano et al., 1991). Indeed, IaaL expression reduced free IAA levels in petunia (Figure 2D), and these plants exhibited an increased HPC density relative to WT plants (Figure 2E), consistent with a negative ef-fect of auxin on HPC presence.
The central enzyme in SL biosynthesis is CCD8, which catalyzes a series of reactions resulting in the formation of the SL precursor carlactone (Seto et al., 2019). Transgenic petunia plants overexpressing DAD1/CCD8 (DAD1-OE) exhibited nearly double the HPC density of the WT (Figure 2F); thus, the presence of HPCs is stimulated by high levels of DAD1 expression (Figures 2G and 2H). We also observed that DAD1-OE plants showed signifi-cantly higher levels of mycorrhizal colonization compared with the WT (Figures 2I and 2J). These results show that DAD1 overexpression increases HPC density and promotes arbuscular mycorrhizal (AM) symbiosis. To assess the dependency of HPC presence on SL signaling, we tested whether HPC density was affected in dad2 and max2a mutants. DAD2 is part of the heterodimeric SL receptor complex and bears thea/b hydro-lase activity required for SL signal transduction (Drummond et al., 2011). The other partner is MAX2A (Drummond et al., 2011), an F box protein homologous to AtMAX2, which interacts with DAD2 in the pres-ence of GR24 resulting in SL signaling (in contrast to its close homologue MAX2B, which is not involved in SL signaling) (Hamiaux et al., 2012). Surprisingly, HPC density was significantly increased in dad2 mutants compared with the WT (V26) (Figure 3A). Since exogenous SL induced the number of HPCs (Figures 1J and 1K), we suspected that increased HPC density in dad2 might be caused by a compensatory stimulation of SL biosynthesis. Consistent with this hypothesis, DAD1 expression was considerably increased in dad2 compared with V26 (Figure 3B), and the levels of mycorrhizal colonization were significantly higher ( Fig-ure 3C). In conjunction with our overexpression data (Figures 2I and 2J), this indicates that increased DAD1 expression levels in dad2 may be sufficient to increase HPC density and stimulate AM development. In contrast to dad2, max2a mutants (Figures S3D and S3E) showed a pronounced decrease in HPC number compared with the corresponding WT (W115XW138) (Figure 3D). Expression of the SL biosynthesis genes DAD1 and MAX1 was not significantly affected in max2a mutants (Figure 3E). The contrasting HPC densities of the two supposed SL signaling mutants dad2 and max2a could be related to their interaction partners. In Arabidopsis, MAX2 is involved not only in SL perception (complex of DAD2 and MAX2) but also in karrikin (KAR) perception, which is mediated through the KARRIKIN INSENSITIVE 2 (KAI2)/MAX2 heterodimeric re-ceptor complex (Marzec, 2016).
To test whether KAI2 may have a function in the regulation of HPC density, we sought for a kai2 mutant in Petunia. In contrast to the single-copy genes DAD1, MAX2A (MAX2B is not involved in SL signaling), and PDR1 (Snowden et al., 2005; Drummond et al., 2011; Kretzschmar et al., 2012), the petunia genome contains five closely related KAI2 homologues (KAI2a-e) (Figure S4A). To assess which of them might have a role in AM, their expression pattern was determined, and only KAI2a was found to be expressed in roots at detect-able levels (Figure S4B). Two independent kai2a mutant alleles showed enlarged leaf blades (Figures S4C– S4E), as in the case of Arabidopsis kai2 mutants (Bennett et al., 2016). Quantification of HPCs revealed dramatically reduced HPC densities in both lines compared with the corresponding WT background W138 (Figure 3F). Remarkably, kai2a mutants were entirely resistant to AM infection (Figure S3F). A similar AM-defective mutant phenotype was recently shown in rice kai2 mutants (Gutjahr et al., 2015). These results suggest that HPC density might rely on a KAI2/MAX2-dependent signaling pathway.
To test whether karrikins may have a role in HPC density, we treated WT and max2a mutants with karrikin1 and karrikin2, two established substrates of KAI2 in Arabidopsis (Conn and Nelson, 2016), at concentrations from 10 nM to 1mM. Unexpectedly, karrikins reduced HPC density in WT plants (Figures 4A andS3C), whereas HPC density in max2a mutants was not affected by karrikins. This indicates that the repressive effect of karrikins on HPCs requires MAX2. Based on these results, we hypothesize that karrikins might downregulate DAD1 expression levels in a MAX2-dependent manner, as reported in Arabidopsis (Nelson et al., 2011), and/or that they may compete with a yet unknown KAI2a ligand (KAI2a-L) that acts as a positive regulator of HPC presence in Petunia. Indeed, karrikin treatments strongly reduced DAD1 expression (Figure S3G).
Figure 2. Continued
Different letters above the bars indicate statistically significant difference (p < 0.05, by one-way ANOVA, nR 30). Stars above the bars indicate statistically significant difference (t test, *p% 0.05, **p % 0.01, ***p % 0.001, ****p % 0.0001). Error bars areGSEM. SeeTable S1.
Arabidopsis KAI2 was shown to bind karrikins, GR24, and a related class of small molecules (cotylimides). In addition, GR24 and cotylimides promote the dimerization of MAX2 and KAI2 in yeast, implicating that they could potentially trigger KAI2-dependent signaling (Toh et al., 2014). Based on this evidence, we tested whether the enantiomers contained in rac-GR24 may promote HPC presence in a KAI2-dependent fashion. Indeed, we found that GR245DSbut not GR24ent-5DSincreased the number of HPCs in WT plants but not in kai2a mutants (Figure 4B). GR245DSalso increased HPC density in dad1 mutants (Figure 4C) as did rac-GR24 Figure 3. Presence of HPCs is MAX2-Dependent and DAD2-Independent
(A) HPC density in dad2 and WT roots. (B) DAD1 expression in dad2 mutant.
(C) Mycorrhization ratios in V26 and dad2 mutant. (D) HPC density in max2a.
(E) DAD1 and MAX1 gene expression levels in max2a. (F) HPC density in kai2a.
Different letters above the bars indicate statistically significant difference (p < 0.05, by one-way ANOVA, nR 30). Stars above the bars indicate statistically significant difference (t test, *p% 0.05, **p % 0.01, ***p % 0.001, ****p % 0.0001). Error bars areGSEM. SeeTable S1.
(Figure S2A). Taken together, these results suggest that KAI2a promotes HPC presence involving a DAD1-derivative that is transported by PDR1 and that has features of a canonical 5DS strigolactone (Figure 4D).
DISCUSSION
HPCs are a characteristic feature of the roots in many plants, and they are relevant for water flux control (Steudle, 2000) and fungal infection in AM symbiosis. Hence, HPC density is an important determinant of plant fitness, and therefore it can be expected to be under tight developmental and environmental
Figure 4. Effects of GR24 Enantiomers and Karrikins on HPCs
(A) HPC density after 1mM karrikin1 and 1 mM karrikin2 treatments.
(B) HPC density in WT and kai2a after treatments with 1mM GR24 enantiomers. (C) HPCs in dad1 after treatments with mock, 1mM, and 100 nM GR245DS.
(D) Model of HPC regulation via SL5DS.
Different letters above the bars indicate statistically significant difference (p < 0.05, by one-way ANOVA, nR 30). When no letters, no significant difference. Stars above the bars indicate statistically significant difference (Student’s t test p value < 0.05 = *; <0.001 = **). Error bars areGSEM. SeeTable S1.
control. Here, we show that HPC density is subject to hormonal regulation. SLs promoted HPC presence, whereas ABA, auxin, ethylene, and karrikins reduced HPC density.
The negative hormonal effects of ABA, auxin, and ethylene on HPC density relate to a large body of published knowledge and open interesting new avenues of research. The ABA effect is consistent with the reported func-tion of this hormone in root suberizafunc-tion induced by drought stress (Christmann et al., 2007; Charpentier et al., 2014) and in the induction of scar tissue suberization in tomato fruits (Christmann et al., 2007; Leide et al., 2012). However, the function of ABA in AM is complex, since certain levels of ABA are required for symbiotic develop-ment (Charpentier et al., 2014), whereas high concentrations inhibit AM. Although several papers reported a cross talk between ABA and SL (Tsuchiya and McCourt, 2009; Conn and Nelson, 2016), the interaction between these two hormones remains elusive, except for the fact that abiotic stresses can shift the balance between their syntheses toward ABA, which may involve competition for common precursors (Liu et al., 2015).
Effects of ethylene and auxin have also been documented for the formation of passage cells in the endo-dermis of Arabidopsis (Barberon et al., 2016), but in these cases, the hormones promoted passage cell for-mation instead of reducing their density as in our study. Whether this reflects differences between the spe-cies or rather between the tissue layers (endodermis vs. hypodermis) remains to be investigated. A possible function of ethylene in controlling hypodermal passage cell number is suggested by the observation that ethylene application significantly increased the concentration of ABA in rice roots (Ma et al., 2014), which indicates that ethylene might regulate the presence of HPCs through ABA.
The promotive effect of SL on HPC density, and the fact that only the 5DS enantiomer was active, prompted us to further explore this phenomenon with transposon-generated loss-of-function mutants in signaling genes MAX2A, DAD2, and KAI2a and in the SL biosynthetic gene DAD1. MAX2A and DAD2 have previously been shown to encode components of the SL receptor (Drummond et al., 2011). As expected, max2a mu-tants showed the bushy phenotype known from previously described MAX2a knockdown lines in Petunia (Drummond et al., 2011) and from mutants in Arabidopsis (Stirnberg et al., 2002).
Unexpectedly, however, dad2 and max2a showed opposite phenotypes regarding HPC density, with decreased density in max2a and increased density in dad2. Increased HPC density in dad2, and a concom-itant increase in AM colonization, can be explained with increased SL biosynthesis, since DAD1 was upre-gulated in dad2 (Figure 3B), and DAD1-OE showed a similar phenotype (Figures 2H–2J). These results also implicate that the promotion of HPC density by SL acts independently of DAD2, whereas MAX2A is required. It is interesting to note that the symbiotic phenotypes of mutants in the DAD2 and MAX2a ortho-logues in rice, DWARF14 (D14) and DWARF3 (D3), respectively, were similar as in petunia: d14 mutants showed higher AM colonization, whereas d3 mutants exhibited reduced AM colonization (Yoshida et al., 2012). It remains to be seen whether the contrasting AM colonization phenotypes in these rice mutants correlate with HPC densities.
The fact that HPC density was reduced in max2 but not in dad2 hints to an SL-related perception mecha-nism that involves MAX2A in conjunction with another protein partner than DAD2. MAX2 has alternative interaction partners such as KAI2 to form receptor complexes that can perceive molecules such as not only karrikins (Scaffidi et al., 2014) but also SLs and a predicted, so far unidentified endogenous hormonal KAI2 ligand (Nelson et al., 2011). Petunia has five KAI2 homologues of which only one, KAI2a, is expressed in roots. Kai2a mutants had an equally strong HPC phenotype as the SL-defective dad1 mutant, suggesting that KAI2a may act as a non-redundant receptor for a DAD1-derived 5DS putative strigolactone signal that promotes HPC differentiation.
The fact that kai2a mutants exhibited strongly reduced HPC densities suggests the involvement of a posi-tively acting KAI2a ligand. However, the reported KAI2 ligands, karrikins, reduced HPC numbers. Karrikins as exogenous growth regulators may interfere with HPC formation through KAI2 signaling by competing with an endogenous positive regulator (e.g., an elusive KAI2 ligand). The fact that the SL analogue GR24 only acted in its 5DS form and that this effect disappeared in kai2a mutants indicates that a bona fide re-ceptor system mediates the SL-dependent promotion of HPC presence, and based on our data, we pro-pose that it involves KAI2a/MAX2A. In this context, it is interesting to note that kai2 mutants in rice exhibit strongly reduced mycorrhizal colonization (Gutjahr et al., 2015). Thus, it would be informative to test whether kai2 rice mutants are affected in HPC density.
In summary, HPC density in Petunia roots depends on SL and its transport via PDR1. In particular, the SL5DS
enantiomer promoted HPC density through a MAX2/KAI2a-dependent signaling pathway. These results for the first time associate the KAI2 signaling pathway to the presence of a specific cell type, the HPCs. We show here that Petunia plants with high expression levels of DAD1, either in dad2 loss-of-function mu-tants or DAD1 OE lines, have increased HPC density compared with WT. Thus, not only exogenous appli-cation of GR245DSbut also genetic approaches to increase endogenous SL biosynthesis positively affected
HPC density. Consistent with these findings, treatments with hormones and molecules that decreased DAD1 gene expression, e.g., ABA and karrikins, reduced HPC density. In addition, auxin and ethylene inde-pendently reduced HPC density, via yet unknown pathways. Increased HPC density in dad2 and DAD1 OE lines correlated with increased mycorrhizal colonization. Conversely, dad1, pdr1, and kai2a mutants with reduced HPC density exhibited reduced mycorrhizal colonization (Kretzschmar et al., 2012) (Figure S3F). The correlation between HPC density and AM colonization indicates that HPC density may be relevant for AM symbiosis and that it can be limiting for AM. These findings also show that HPC density is an impor-tant trait in crop production because HPCs can potentially influence plant nutrition, resistance to root-borne diseases, and drought tolerance. A better understanding of the genetic basis of HPC formation will reveal how these traits are connected with endogenous developmental programs and how they can be used for crop breeding.
Limitation of the Study
The scientific interest for hypodermis differentiation is high, because of the possible implications the dis-tribution of HPCs might have on mycorrhization and plant nutrient uptake. Still, additional studies are necessary to pinpoint the role of SL and of SL transport (via the ABCG transporter PDR1) on the identity and/or maintenance of HPCs. We discuss here the further approaches we think would allow a deeper un-derstanding of the mechanisms behind a yet putative SL/PhKAI2a/HPC-identity regulatory pathway. At-KAI2 was shown to bind AtMAX2 in Arabidopsis and to perceive GR24. PhAt-KAI2 is up-to-date the only known root-expressed KAI2 homologue in petunia. Therefore, first PhKAI2a activity as receptor of SLs, and in particular of GR24-5DS, needs to be validated in vitro via isothermal titration calorimetry or via yeast-2-hybrid system in combination with its putative partner PhMAX2a. An inducible system aimed to downregulate PhKAI2a might as well better serve the scope of investigating maintenance and identity, rather than the sole distribution of HPCs. An inducible system designed to knock down PhKAI2 will likely permit faster detection of changes in HPC distribution, therefore allowing one to understand how direct the influence of SL and PhKAI2 on HPC identity/maintenance is. It is tempting to speculate the presence of a direct interaction between SL synthesis via DAD1, SL reception via PhKAI2a, and HPC identity. Addi-tional analyses on dad1xdad2 and dad1xdad2xkai2a double and triple mutants in petunia will be neces-sary to (1) challenge our presented model; (2) study DAD1, DAD2, and KAI2 hierarchy for regulating HPC distribution; and (3) investigate DAD2 and KAI2 either partially overlapping or distinct roles on HPC identity.
The technique used up to now to detect HPCs is based on trypan blue staining. This procedure is validated by several papers, still it does not provide any qualitative information on HPCs. The transformation of petunia with reporters (rather GUS than fluorescent due to the hypodermis strong auto-fluorescence) for genes involved in suberin metabolism, such as the ones used in Arabidopsis to study endodermis differen-tiation, will possibly help understanding the SL-driven mechanisms behind the regulation of HPC identity. Transmission Electron Microscopy might as well help quantify different suberin deposition in mutants for SL synthesis, signaling, and transport versus the WT. A parallel study on pPDR1:GUS expression patterns in SL mutants or after treatment with the hormones of this study might as well give new hints on the relation be-tween SL transport and HPC identity.
Finally, additional physiological analyses could reveal how much plant nutrition and mycorrhization are sen-sitive to weak and strong changes in HPC distribution. HPC distribution was already shown to alter mycorrh-ization rates, but no studies investigated yet if plant nutrient uptake is affected, either with or without my-corrhization, by the number of HPCs. Root uptake of ions such as calcium was reported to be influenced by root hypodermal suberization: a wide-spectrum analysis on ion uptake in SL mutants might reveal new roles for HPC in plant nutrition.
METHODS
SUPPLEMENTAL INFORMATION
Supplemental Information can be found online athttps://doi.org/10.1016/j.isci.2019.06.024.
ACKNOWLEDGMENTS
This work was supported by the Swiss National Science Foundation projects by the grants numbers 31003A-152831 and 31003A-169546 and the Swiss Secretariat for Education and Research and Innovation (SERI) in the frame of COST action FA1206 ‘‘STREAM.’’
AUTHOR CONTRIBUTIONS
G.L., L.B., and E.M. conceived experiments; G.L., M.S., C.G., S.E., S.A., and L.B. executed experiments; D.R., P.-E.C., M.V., and P.M. contributed materials. G.L., L.B., D.R., and E.M. wrote the manuscript.
DECLARATION OF INTERESTS
The authors declare no competing interest.
Received: February 24, 2019 Revised: May 19, 2019 Accepted: June 14, 2019 Published: July 26, 2019 REFERENCES
Al-Babili, S., and Bouwmeester, H.J. (2015). Strigolactones, a novel carotenoid-derived plant hormone. Annu. Rev. Plant Biol. 66, 161–186.
Andersen, T.G., Naseer, S., Ursache, R., Wybouw, B., Smet, W., De Rybel, B., Vermeer, J.E.M., and Geldner, N. (2018). Diffusible repression of cytokinin signalling produces endodermal symmetry and passage cells. Nature 555, 529.
Barberon, M., Vermeer, J.E., De Bellis, D., Wang, P., Naseer, S., Andersen, T.G., Humbel, B.M., Nawrath, C., Takano, J., Salt, D.E., and Geldner, N. (2016). Adaptation of root function by nutrient-induced plasticity of endodermal differentiation. Cell 164, 447–459.
Bennett, T., Liang, Y., Seale, M., Ward, S., Mu¨ller, D., and Leyser, O. (2016). Strigolactone regulates shoot development through a core signalling pathway. Biol. Open 5, 1806–1820.
Boher, P., Serra, O., Soler, M., Molinas, M., and Figueras, M. (2013). The potato suberin feruloyl transferase FHT which accumulates in the phellogen is induced by wounding and regulated by abscisic and salicylic acids. J. Exp. Bot. 64, 3225–3236.
Charpentier, M., Sun, J., Wen, J., Mysore, K.S., and Oldroyd, G.E.D. (2014). Abscisic acid promotion of arbuscular mycorrhizal colonization requires a component of the PROTEIN PHOSPHATASE 2A complex. Plant Physiol. 166, 2077–2090.
Christmann, A., Weiler, E.W., Steudle, E., and Grill, E. (2007). A hydraulic signal in root-to-shoot signalling of water shortage. Plant J. 52, 167–174.
Conn, C.E., and Nelson, D.C. (2016). Evidence that KARRIKIN-INSENSITIVE2 (KAI2) receptors may perceive an unknown signal that is not karrikin or strigolactone. Front. Plant Sci. 6, 1219.
Doblas, V.G., Geldner, N., and Barberon, M. (2017). The endodermis, a tightly controlled
barrier for nutrients. Curr. Opin. Plant Biol. 39, 136–143.
Drummond, R.S., Sheehan, H., Simons, J.L., Martinez-Sanchez, N.M., Turner, R.M., Putterill, J., and Snowden, K.C. (2011). The expression of petunia strigolactone pathway genes is altered as part of the endogenous developmental program. Front. Plant Sci. 2, 115.
Enstone, D.E., Peterson, C.A., and Ma, F.S. (2002). Root endodermis and exodermis: structure, function, and responses to the environment. J. Plant Growth Regul. 21, 335–351.
Gutjahr, C., Gobbato, E., Choi, J., Riemann, M., Johnston, M.G., Summers, W., Carbonnel, S., Mansfield, C., Yang, S.Y., Nadal, M., et al. (2015). Rice perception of symbiotic arbuscular mycorrhizal fungi requires the karrikin receptor complex. Science 350, 1521–1524.
Hamiaux, C., Drummond, R.S., Janssen, B.J., Ledger, S.E., Cooney, J.M., Newcomb, R.D., and Snowden, K.C. (2012). DAD2 is an alpha/beta hydrolase likely to be involved in the perception of the plant branching hormone, strigolactone. Curr. Biol. 22, 2032–2036.
Hansen, H., and Grossmann, K. (2000). Auxin-induced ethylene triggers abscisic acid biosynthesis and growth inhibition. Plant Physiol. 124, 1437–1448.
Hayward, A., Stirnberg, P., Beveridge, C., and Leyser, O. (2009). Interactions between auxin and strigolactone in shoot branching control. Plant Physiol. 151, 400–412.
Hose, E., Clarkson, D.T., Steudle, E., Schreiber, L., and Hartung, W. (2001). The exodermis: a variable apoplastic barrier. J. Exp. Bot. 52, 2245–2264.
Kretzschmar, T., Kohlen, W., Sasse, J., Borghi, L., Schlegel, M., Bachelier, J.B., Reinhardt, D., Bours, R., Bouwmeester, H.J., and Martinoia, E. (2012). A petunia ABC protein controls
strigolactone-dependent symbiotic signalling and branching. Nature 483, 341–U135.
Leide, J., Hildebrandt, U., Hartung, W., Riederer, M., and Vogg, G. (2012). Abscisic acid mediates the formation of a suberized stem scar tissue in tomato fruits. New Phytol. 194, 402–415.
Liu, G., Bollier, D., Gu¨beli, C., Peter, N., Arnold, P., Egli, M., and Borghi, L. (2018a).
Simulated microgravity and the antagonistic influence of strigolactone on plant nutrient uptake in low nutrient conditions. NPJ Microgravity 4, 20.
Liu, G., Pfeifer, J., de Brito Francisco, R., Emonet, A., Stirnemann, M., Gubeli, C., Hutter, O., Sasse, J., Mattheyer, C., Stelzer, E., et al. (2018b). Changes in the allocation of endogenous strigolactone improve plant biomass production on phosphate-poor soils. New Phytol. 217, 784–798.
Liu, J., He, H., Vitali, M., Visentin, I., Charnikhova, T., Haider, I., Schubert, A., Ruyter-Spira, C., Bouwmeester, H.J., Lovisolo, C., and Cardinale, F. (2015). Osmotic stress represses strigolactone biosynthesis in Lotus japonicus roots: exploring the interaction between strigolactones and ABA under abiotic stress. Planta 241, 1435–1451.
Lopez-Raez, J.A., Kohlen, W., Charnikhova, T., Mulder, P., Undas, A.K., Sergeant, M.J., Verstappen, F., Bugg, T.D.H., Thompson, A.J., Ruyter-Spira, C., and Bouwmeester, H. (2010). Does abscisic acid affect strigolactone biosynthesis? New Phytol. 187, 343–354.
Ma, B., Yin, C.C., He, S.J., Lu, X., Zhang, W.K., Lu, T.G., Chen, S.Y., and Zhang, J.S. (2014). Ethylene-induced inhibition of root growth requires abscisic acid function in rice (Oryza sativa L.) seedlings. PLoS Genet. 10, e1004701.
Martı´n Rodriguez, J.A´., Leo´n Morcillo, R., Vierheilig, H., Antonio Ocampo, J., Ludwig-Mu¨ller, J., and Garcı´a Garrido, J.M. (2010).
Mycorrhization of the notabilis and sitiens tomato mutants in relation to abscisic acid and ethylene contents. J. Plant Physiol. 167, 606–613.
Marzec, M. (2016). Perception and signaling of strigolactones. Front Plant Sci. 7, 1260.
Nelson, D.C., Scaffidi, A., Dun, E.A., Waters, M.T., Flematti, G.R., Dixon, K.W., Beveridge, C.A., Ghisalberti, E.L., and Smith, S.M. (2011). F-box protein MAX2 has dual roles in karrikin and strigolactone signaling in Arabidopsis thaliana. Proc. Natl. Acad. Sci. U S A 108, 8897–8902.
Parniske, M. (2008). Arbuscular mycorrhiza: the mother of plant root endosymbioses. Nat. Rev. Microbiol. 6, 763–775.
Peterson, C.A., and Enstone, D.E. (1996). Functions of passage cells in the endodermis and exodermis of roots. Physiol. Plant. 97, 592–598.
Rich, M.K., Schorderet, M., and Reinhardt, D. (2014). The role of the cell wall compartment in mutualistic symbioses of plants. Front. Plant Sci. 5, 238.
Romano, C.P., Hein, M.B., and Klee, H.J. (1991). Inactivation of auxin in tobacco transformed with the indoleacetic acid-lysine synthetase gene of Pseudomonas savastanoi. Genes Dev. 5, 438–446.
Sasse, J., Simon, S., Gubeli, C., Liu, G.W., Cheng, X., Friml, J., Bouwmeester, H., Martinoia, E., and Borghi, L. (2015). Asymmetric localizations of the ABC transporter PaPDR1 trace paths of
directional strigolactone transport. Curr. Biol. 25, 647–655.
Scaffidi, A., Waters, M.T., Sun, Y.K., Skelton, B.W., Dixon, K.W., Ghisalberti, E.L., Flematti, G.R., and Smith, S.M. (2014). Strigolactone hormones and their stereoisomers signal through two related receptor proteins to induce different physiological responses in Arabidopsis. Plant Physiol. 165, 1221–1232.
Seto, Y., Yasui, R., Kameoka, H., Tamiru, M., Cao, M., Terauchi, R., Sakurada, A., Hirano, R., Kisugi, T., Hanada, A., et al. (2019). Strigolactone perception and deactivation by a hydrolase receptor DWARF14. Nat. Commun. 10, 191.
Sharda, J.N., and Koide, R.T. (2008). Can hypodermal passage cell distribution limit root penetration by mycorrhizal fungi? New Phytol. 180, 696–701.
Shishkoff, N. (1987). Distribution of the dimorphic hypodermis of roots in Angiosperm families. Ann. Bot. 60, 1–15.
Snowden, K.C., Simkin, A.J., Janssen, B.J., Templeton, K.R., Loucas, H.M., Simons, J.L., Karunairetnam, S., Gleave, A.P., Clark, D.G., and Klee, H.J. (2005). The decreased apical dominance1/petunia hybrida CAROTENOID CLEAVAGE DIOXYGENASE8 gene affects branch production and plays a role in leaf senescence, root growth, and flower development. Plant Cell 17, 746–759.
Steudle, E. (2000). Water uptake by roots: effects of water deficit. J. Exp. Bot. 51, 1531–1542.
Stirnberg, P., van De Sande, K., and Leyser, H.M. (2002). MAX1 and MAX2 control shoot lateral branching in Arabidopsis. Development 129, 1131–1141.
Toh, S., Holbrook-Smith, D., Stokes, M.E., Tsuchiya, Y., and McCourt, P. (2014). Detection of parasitic plant suicide germination compounds using a high-throughput Arabidopsis HTL/KAI2 strigolactone perception system. Chem. Biol. 21, 988–998.
Tsuchiya, Y., and McCourt, P. (2009).
Strigolactones: a new hormone with a past. Curr. Opin. Plant Biol. 12, 556–561.
Ueda, H., and Kusaba, M. (2015). Strigolactone regulates leaf senescence in concert with ethylene in Arabidopsis. Plant Physiol. 169, 138–147.
Varma Penmetsa, R., Uribe, P., Anderson, J., Lichtenzveig, J., Gish, J.-C., Nam, Y.W., Engstrom, E., Xu, K., Sckisel, G., Pereira, M., et al. (2008). The Medicago truncatula ortholog of Arabidopsis EIN2, sickle, is a negative regulator of symbiotic and pathogenic microbial associations. Plant J. 55, 580–595.
Yoshida, S., Kameoka, H., Tempo, M., Akiyama, K., Umehara, M., Yamaguchi, S., Hayashi, H., Kyozuka, J., and Shirasu, K. (2012). The D3 F-box protein is a key component in host strigolactone responses essential for arbuscular mycorrhizal symbiosis. New Phytol. 196, 1208–1216.