HAL Id: insu-01627407
https://hal-insu.archives-ouvertes.fr/insu-01627407
Submitted on 6 Feb 2021
HAL is a multi-disciplinary open access
archive for the deposit and dissemination of
sci-entific research documents, whether they are
pub-lished or not. The documents may come from
teaching and research institutions in France or
abroad, or from public or private research centers.
L’archive ouverte pluridisciplinaire HAL, est
destinée au dépôt et à la diffusion de documents
scientifiques de niveau recherche, publiés ou non,
émanant des établissements d’enseignement et de
recherche français ou étrangers, des laboratoires
publics ou privés.
MICADO wind measurements from Observatoire de
Haute-Provence for the validation of WINDII green line
data
Gérard Thuillier, Vincent Fauliot, Michel Hersé, Ludovic Bourg, G. G.
Shepherd
To cite this version:
Gérard Thuillier, Vincent Fauliot, Michel Hersé, Ludovic Bourg, G. G. Shepherd. MICADO wind
mea-surements from Observatoire de Haute-Provence for the validation of WINDII green line data. Journal
of Geophysical Research: Atmospheres, American Geophysical Union, 1996, 101 (D6), pp.10431-10440.
�10.1029/95JD03522�. �insu-01627407�
JOURNAL OF GEOPHYSICAL RESEARCH, VOL. 101, NO. D6, PAGES 10,431-10,440, APRIL 30, 1996
MICADO
wind measurements
from Observatoire
de Haute-Provence
for the validation of WINDII green line data
G. Thuillier, V. Fauliot, M. Hers6, and L. Bourg
Service d'A•ronomie du CNRS, Verriares-le-Buisson, FranceG. G. Shepherd
Centre for Research in Earth and Space Science, York University, Toronto, Ontario, Canada
Abstract. The WINDII instrument measures the velocity of the meridional and zonal components of the wind as a function of altitude using a Michelson interferometer. Such an instrument is calibrated in the laboratory before launch. For several reasons, it is
important to compare the WINDII data with other independent measurements. This
should allow the confirmation of either the accuracy of the space measurements, the
detection of some systematic offset, or an aging as a function of time. The MICADO
interferometer has been running since the beginning of the UARS mission at Observatoire de Haute-Provence (France). The data provided by this instrument are used to perform
this study. For nighttime measurements, no aging has been detected and it is found that
WINDII overestimates
the two components
of the wind by 10 m s-1 at the latitude
and
longitude
of the ground-based
observations.
This corresponds
to an offset
of 9 m s-1 for
both fields of view. Amplitude and phase of the semidiurnal tide have also been derived from the WINDII and MICADO data as a function of season. Comparable results were obtained.
le Validation of WINDII Data Purpose of the Validation
The WINDII instrument uses a field-compensated Michel- son interferometer to perform wind and temperature measure- ments as a function of altitude. Precision and accuracy of the measurements depend on the ground calibration and on its
reliability from ground to space.
Calibration at ground faces the following difficulties: (1)
Calibration measurements are especially difficult with a large
field of view interferometer. (2) Laboratory sources, able to
produce forbidden lines as those existing in the natural air-
glow, may have some parasitic lines.
The reliability of the ground calibration in orbit can be affected by the vibrations experienced during the launch, the space environment through high-energy particles, and outgas-
sing and deposition of materials.
All these factors can induce a systematic error in the wind
determination, small instrument deadjustments, and an aging
of the instrument optics and detectors. These can reduce the
precision of the temperature and wind measurements by af-
fecting the determination of the intrinsic phase and visibility of the instrument and reduce the accuracy of the measurements through the lack of knowledge of the variation of the instru- ment characteristics as a function of time. Our aim is to study the reliability of the instrument zero wind phase characteriza-
tion (made during fall 1990) by checking the wind values mea-
sured by WINDII and their behavior as a function of time using independent wind measurements from the ground.
This objective leads to the necessity of having a campaign of
correlative measurements between WINDII in orbit and other
Copyright 1996 by the American Geophysical Union. Paper number 95JD03522.
0148-0227/96/95JD-03522505.00
instruments. This paper is dedicated to the results of a correl- ative measurements campaign between the WINDII and the ground-based MICADO interferometer. Specific features of wind measurements from ground-based interferometers and
interpretation of results have been recently reviewed in the
paper by Fauliot et al. [1995] where the semidiurnal tide is studied by the use of interferometric observations from the ground at high and midlatitudes.
MICADO has been operational since the the UARS launch. This campaign of comparison has another interest since both instruments have the same design and operate with the same
method [Thuillier and Shepherd, 1985]. While MICADO and
WINDII are Michelson interferometers, MICADO operates on the ground and WINDII observes in orbit leading to dif- ferent optical path integration. Furthermore, we must point out that WINDII was calibrated during fall 1990 and the mon- itoring of the spectral characteristics is made by a single source
for a given line, while MICADO is checked on a daily basis
using several independent sources.
1.2. Principle of WINDII Wind Measurements
The principle of these measurements from space have been detailed by Shepherd et al. [1993], but we need to remind the
reader of the essential rationale of these measurements. From
a monochromatic plane wave at wavelength ,X entering the interferometer, an interferogram is generated from which is calculated the phase O of the wave between 0 and 2rr. Let Oo
be the phase when the wind is null. The difference (O - Oo) contains the wind velocity (W), such as
W:K,(&- &0)
where K• is a constant calculated from the interferometer
characteristics.
As the zero wind phase is not available in orbit, a calibration
lamp emitting light from a line of wavelength close to • is used, providing a phase qb c. Calibration at ground consists of mea- suring (qb o - qbc) using the same lamp as in orbit and a source
able to deliver the same airglow line as in the Earth's atmo-
sphere. The fundamental principle of the wind measurement is
to assume that
(•)0- •)c) orbit --- (•)0- •)c)ground
The right-hand side of the above equation is taken as a con- stant (K2) from the ground to space. As WINDII performs the measurements in two directions (fields 1 and 2), K 2 needs to be
known for the two instrument fields.
Activating the calibration lamp in orbit provides qbc which allows the reconstruction of the zero wind phase in orbit from
K2+ qbc
Although the above principle is simple, it contains several
sources of error. When assuming a constant K 2 from the
ground to space, any systematic error in the zero wind phase
will be transferred to all measurements made in orbit. In ad-
dition, the impact of a change of the instrument characteristics through aging depends on the wavelength due to the chromatic property of glasses. The observed emission line and the refer-
ence source on board have close but not identical wavelength,
consequently the zero wind phase reconstructed in orbit from K 2 and qbc may exhibit a trend as a function of time; qb c is also able to generate an error. But as the line frequency is constant, only a random error is likely to occur. This error is made negligible with respect to the other by smoothing the qb c mea-
surements over a daily basis.
Furthermore, during the instrument ground-based calibra- tion it was not possible to use the two instrument fields of view due to particular circumstances. Field of view 2 was character-
ized, while for field of view 1, results of a mathematical model
of the interferometer were used in place of direct calibration
measurements. This would result in transferring any systematic
error in the zero wind phase from one field of view to the
other.
The statistical accuracy of wind measurements has been quoted by Shepherd et al. [1993]. The statistical error is a
function of altitude since it is basically linked to the number of
collected photons and is also a function of time at a given
altitude. Therefore for the atomic oxygen green line, at mid-
latitude during nighttime, a mean value of the error is 10 m s -•
around the altitude of the emission peak. Errors we have used are those given by the data processing software for each mea-
surement.
1.3. MICADO Instrument
The MICADO instrument (Michelson interferometer for coordinated auroral Doppler observations) consists of a field- compensated Michelson interferometer [Bouchareine and Connes, 1963] which has been thermally stabilized to allow wind and temperature measurements [Thuillier and Hers•, 1991]. It is placed on the ground and is operated during night- time. The principle of the measurement is to analyze airglow or auroral lines from their interferograms. Atmospheric lines are selected by interference filters and a movable telescope allows
observations at zenith and in other directions to derive hori-
zontal and vertical winds. In particular, it is possible to verify the homogeneity of the observed area by comparing results in two opposite directions. The accuracy of the measurements
taken by MICADO depends on its wavelength reference and
on the statistical error affecting the counting of the detector.
Those two components usually contribute 6 m s- • to the error
in the wind determination under nighttime conditions at mid- latitudes. The detailed concept, description, and calibration of this instrument are given by Thuillier and Hers• [1991].
MICADO was first operated in the auroral zone during three winter campaigns [Thuillier et al., 1990; Lilensten et al., 1992; Fauliot et al., 1993]. Afterward, it was selected as correl- ative experiment for the WINDII interferometer. A location at midlatitudes is appropriate to maximize the number of simul-
taneous measurements from WINDII in orbit and MICADO
on the ground. The Observatoire de Haute-Provence (44øN, 6øE) has been chosen as the site from which the correlative measurements, which began in October 1991 and are continu- ing, are carried out.
1.3.1. Principle of MICADO measurements. When a uni-
form source emitting a monochromatic line of constant tem- perature, intensity, and velocity enters a Michelson interferom- eter, an interferogram is generated as a function of the optical path difference change. MICADO records an interferogram by scanning six fringes with, in general, 80 measurements per fringe. Applying Fourier analysis to an interferogram over an integer number of fringes provides intensity, temperature, and wind along the line of sight (L).
As a general method, ground-based instruments use mea-
surements at zenith as reference for the zero wind phase when
one can consider that there is no direct evidence of vertical
winds. At midlatitudes, vertical winds of 10-50 m s -• have
been recently observed in the thermosphere by the use of the atomic oxygen 630-nm emissions [Siplet et al., 1995]. At meso- spheric heights, vertical winds of tens of centimeters per sec- ond have been measured by Meek and Manson [1989]. How-
ever, vertical profiles of the O(•S) oxygen line emission rate
measured at midlatitudes by WINDII during nighttime, clearly
show the absence of emission from the F region. Consequently,
the wind
phase
derived
from O(•S) oxygen
line observations
at
zenith, induced only by the mesospheric vertical wind field, is negligible compared to the precision of the measurements.
Under these conditions, observations at zenith provide us with
the zero wind phase.
This method has been validated by special observations taken for complete nights during a few days. Variations of the instrument phase at zenith are explained by the phase variation measured using a spectral calibration lamp (krypton lamp in
case of the observation of the O(•S) oxygen line emission).
This explains why the phase measured at zenith is considered as reference for the zero wind phase. Furthermore, as obser-
vations in the horizontal and vertical directions are made se-
quentially, phases at zenith are smoothed in order to remove possible local or temporary vertical wind effect if any.
When the interferometer is operated from ground, the col- lected light originates from the entire emission layer, i.e., from a range of altitude in which temperature, wind, and intensity are not constant along the line of sight (L). An integration along (L) is made when the interferogram is recorded. This is why the derived temperature, velocity, and intensity are named apparent quantities. The meaning of the apparent quantities is dependent upon the layer shape. This problem has been care- fully studied for the case of the line chosen for the correlative
THUILLIER ET AL.: MICADO WIND MEASUREMENTS 10,433 300 250 200 150 100 0 100 Emission (ph/cm3/s) 120 100 95 i 200 120 115 110 •o5 lOO 95- 90,- '- i J I '-' 300 -20 0 120 I ' I '-' 115 110 •o5 lOO 95 90,- -20 o Temperature (K) Meridional wind velocity (m/s) Zonal wind velocity (m/s)
Figure 1. Vertical distribution of O•S emission rate, temperature, and wind measured by the WINDII
instrument above Observatoire de Haute-Provence (OHP) on January 30, 1992, at 0300 UT.
1.3.2. Observations by interferometry of the O(•S) oxygen
line from ground at midlatitudes. A Michelson interferom-
eter cannot operate from ground in daytime due to its high
sensitivity to white light. As mesosphere winds are of impor-
tance in the UARS program, we have carried out in orbit and
from ground
correlative
measurements
using
the O(•S) atomic
oxygen night airglow line. This line is usually emitted in the E
and F regions.
By calculation, it can be shown that for a single layer the apparent quantities are related to the altitude of the emission peak within a few kilometers. The correspondence is the best
for the narrowest layers. For the atomic oxygen green line at
midlatitudes the correspondence lies within _+ 1 km. But there are certain cases where the green line emission originates both from the mesosphere and from the thermosphere. We have carefully studied this situation [Fauliot et al., 1995] and note that the apparent wind and temperature are dependent on the ratio of the line column brightness of each region which is, in general, not known. In particular, this study shows that the apparent temperature increases above the mesospheric value as a function of the increasing F region to E-region brightness
ratio. Fortunately, at midlatitudes the E-region layer zenith
intensity is significantly greater than that of the F region. An example is shown in Figure 1 which presents a vertical profile
of the line emission rate measured at midlatitudes by the
WINDII experiment [Shepherd et al., 1993]. Figure 1 clearly
shows the absence of F-region emission which allows, in prin-
ciple, to perform wind measurements in the mesosphere from ground at midlatitudes. This situation is certainly satisfied in the middle of the night. Around twilight it is possible to en- counter a situation where the mesosphere is dark while the thermosphere is still lit. In that case, the contribution from the F region affects the apparent quantities as observed from ground. To avoid this type of data, we define a criterion based on the value of the apparent temperature as follows:
The Doppler temperatures are around 200-250 K in the E layer and about 1000 K or greater in the F region. Using the
O(•S) emission line, WINDII has measured the temperature at
thermospheric heights during daytime and twilight at midlati- tudes as well as in the auroral zone showing values significantly above the expected temperature in those conditions of obser-
vations (800-2000 K depending on solar activity). This is due
to the low number of thermalizing collisions of the O(•S) in
that altitude regime. As the two layers may contribute to the interferogram recorded on the ground, the absence of thermo- spheric contribution is insured by verifying that the value of the measured temperature is around 230 K. Using the temperature criteria, most of the suspicious cases are eliminated. To pre- vent the keeping of certain measurements potentially having a
weak F-region contribution, a numerical procedure of integra-
tion explained in section 2.2 has been used.
2. Correlative Measurements Between MICADO and WINDII
2.1. Observations From Observatoire de Haute-Provence
(OHP) (France)
The horizontal gradients of the atmospheric parameters are expected to be smallest at midlatitudes. This condition is im- portant when comparing data from instruments performing integrations along different lines of sight. The homogeneity of the observed area is also important since the meridional and zonal components of the wind are not obtained at the same location (typically 350 km with respect to the OHP station for ground-based observations). From ground the observation of the mesospheric green line emission layer leads to an optical integration path of about 20 km. From orbit the integration path is now about 700 km. An ideal situation would be for the line of sight of each instrument to be in the same vertical plane. In that case, the common volume of atmosphere observed by the two instruments would be small with respect to that ob- served by WINDII. Thus with MICADO we check the homo- geneity by performing wind measurements in two opposite directions (e.g., east and west). The difference remains gener- ally smaller than the quoted accuracy of the measurements.
However, even if the MICADO observations indicate that the
required level of homogeneity is achieved within the observa- tion area, they do not allow any conclusion concerning the volume of atmosphere observed by WINDII.
The MICADO instrument installed at OHP to carry out
correlative measurements with WINDII made observations as
-20 -40
' ' '
... Zonal wind ... Meridional wind,,,
'"",,,,, ,/
-
..\ ....
,,.
,/
22 24 2 4 6Figure 2. Local time variation of the zonal and meridional components of the wind as measured by MICADO at OHP on the night of November 7, 1990.
overpass. In certain circumstances, two to three passes were recorded. (2) A minimum of a complete night was recorded for
each month in order to observe seasonal and diurnal wind
variations. An example is shown in Figure 2.
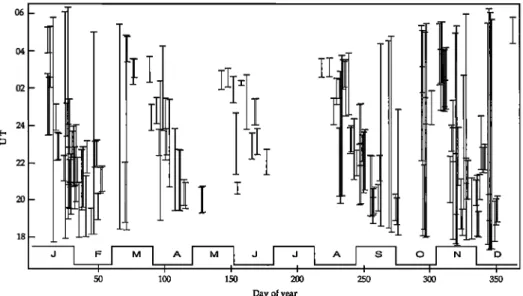
Figure 3 displays the distribution and time coverage of ob- servations gathered from October 1991 to April 1994. Their homogeneity has allowed us to study the semidiurnal tides at midlatitudes as a function of season. Results have been pre- sented and discussed by Fauliot et al. [1995]. They agree with the major characteristics of E-region circulation at midlati-
tudes
as reported
by Manson
et al. [1989].
Excellent
agreement
was found with nearby radar observations made at Monpazier [Massebeuf et al., 1981] as well as with the theoretical predic- tions of the Forbes and Vial [1989] model. This figure shows a lack of measurements during summer months which is mostly due to the short duration of nights and a spacecraft temporary
failure in July 1992.
2.2. Procedure for Ground to Space Comparison
Despite
the fact that the O(1S) layer in the mesosphere
has
a typical width of about 7 km, an instrument placed on the
ground receives photons originating from different altitudes
and having different velocities and temperatures. Furthermore, when we used data measured immediately after sunset, we
could not exclude the possibility that a small thermospheric contribution may exist in the ground-based data. Conse- quently, for all cases over OHP an integration along the MICADO line of sight (L) is made, as follows, for the
WINDII measurements:
I(x) =
E(z) 1 + UV(z)
cos 2rr X(z) dl
(1)
(œ) where
X line wavelength, including the Doppler effect induced by
the wind to measure and V the line visibility related to
its temperature at altitude z;
A interferometer optical path difference;
x optical path difference change (from 0 to 8) to generate
the interferogram;
8 total optical path change; U is the interferometer visibility.
E(z), r(z), and W(z) at altitude z are, respectively, the emission i'ate, the temperature, and the velocity along the line of sight (L) measured by WlNDII. T(z) and W(z) allow calculation of V(z) and X(z). Apparent quantities are ob- tained by performing an integration over altitude. It is the calculated apparent wind which is compared to the wind ob- tained by MICADO. All these calculations take into account
the standard deviation affecting each contributing measure-
ment.
3. Results
The number and distribution in time of the correlations
depends upon many factors. These are spacecraft position and orientation with respect to the ground-based station, day or night condition of the pass, scheduled observations, weather at
ground, instrument failures, and availability of processed data.
The main restrictive factors for achieving correlations at OHP
appear to be (1) the duration of the night which favors the
I I I I I I
50 100 150 200 250 300 350
Day of year
THUILLIER ET AL.' MICADO WIND MEASUREMENTS 10,435
+ I I I i I I I I I I 4-
•
•I '"•'•
Potential
Direct correlationscorrelations
• + 5 day correlations
x,,,
,,',,
,,' ,,,
,,/ \ ,,,
,, ,,,
... ,,,
,,'/\
1 2 3 4 5 6 7 8 9 10 11 12
Month
Figure 4. Number of possible and achieved correlations above OHP during the campaign of correlative measurements between WINDII and MICADO experiments.
winter months, (2) the transparency of the lower atmosphere
which causes fall and spring to be less favorable than winter,
(3) the spacecraft orientation which causes more correlations
to occur when the spacecraft is south looking than under
north-looking conditions, (4) the definition of the area for
correlated measurements between the two instruments. It has
been set within [40øN-48øN] in latitude and [10øW-20øE] in
longitude, taking into account the optical integration path of
both instruments.
Effects of the above experimental considerations have to be
combined with the WINDII scheduled observations and data
availability: (1) WINDII typically made 12 nighttime measure-
ments per UARS month using the O•S line. Nevertheless,
certain periods such as September 1992 and January 1993 were especially dedicated to ground correlations at OHP. (2) At the time of this paper, WINDII data had been processed with version V4.23 of the production software for the period which
extends from the end of December 1991 to the end of January
1994.
Conditions of correlation between the two instruments occur
for 86 days providing 153 possible correlations. Because of
several factors, such as those listed above, a small number of
effective correlations was found leading to consider three kinds
of correlations:
Direct correlations. WINDII observations are made at the
same local time and day as the MICADO measurements. Dur-
ing the observation periods, the meridional and zonal wind
components are obtained as a function of time. These results are interpolated at the time of the WINDII measurements.
Correlations within ---5 days. WINDII observations are made at the same local time but within _+5 days with respect to the MICADO date of observation. For each month, WINDII and MICADO data were organized as a function of time in
1-hour bins.
Figure 4 shows the number of possible correlations for each month during the entire campaign. It shows that this number
increases about every 3 months. This results from alternating between the yaw arounds of the spacecraft and the nighttime passes in the correlation area. The number of possible corre-
lations is significantly greater in January than for the other
months because 3 years of WINDII data were gathered for that month while only 2 years were available in the data set for the others. Achieved direct and _+5-day correlations are also dis- played in this figure. Since the occurrence of correlative mea- surements depends on coordination of both the WINDII and the MICADO operations, most of the correlations are ob- tained during the winter months from October to February. Figure 4 shows that the number of possible and achieved cor-
relations have the same variation with season.
Numerous uncorrelated WINDII and MICADO O(•S) ob-
servations are available at this time. It is also interesting for validation to compare scientific results derived from both data sets. For both components of the wind, we will focus the com- parison on the seasonal variation of the semidiurnal tidal am- plitude and phase. The direct and within 5-day sets of data are not totally independent since measurements of the former are included in the latter. Nevertheless, the second data set con- tains about twice as many points. Consequently, any significant
statistical difference between the direct correlation data set
and the remaining points of the _+5-day correlation data set would show up in the final results. Alternatively, the absence of
such a difference should further increase the level of confi-
dence of results derived from the analysis of the two data sets.
The same remark applies to the third set of data based on a monthly average more especially as the number of measure- ments involved is now about 4 times greater than that in the
direct case. 3.1. Trend
As stated in section 1.2, the main consequence of aging is the existence of a long-term drift of the zero wind phase in orbit. Consequently, a drift with time could occur between WINDII
and MICADO wind values. Direct correlations have been used
to investigate this aspect since they provide the best conditions for comparing the measurements from each instrument. Dif-
ferences between the horizontal wind components measured by WINDII and MICADO have been analyzed as a function of
-50
MERIDIONAL COMPONENT OF THE WIND
I
I I 0 • 0 0 0o oo
typicalerrorbar
I • I -50 0 50 WINDII (ms-') 20-DISTRIBITrION OF MERIDIONAL WIND DIFFERENCES
i 10 - , I [ -9.0 m , /'
5-
',
I I I I I -60 -40 -20 0 20 MICADO - W1NDII (m s,) I 1 I I I 40 60 80 -50ZONAL COMPONENT OF THE WIND
I
I
I
I•c
0 0
O0
•
_
_ I I I -50 0 50 WINDII (ms-')Figure 5. Relationship between the wind measured by
WINDII and MICADO above OHP for the direct correlation
cases' (a) meridional component, (b) zonal component.
b) DISTRIBUTION OF ZONAL WIND DIFFERENCES
I
I I I I
-40 -20 0 20 MICADO - WINDII (m s,)
Figure 6. Distribution of the wind difference between
MICADO and WINDIi measurements for the direct correla-
tion cases: (a) meridional component, (b) zonal component.
onal and zonal slopes are 8 x 10 -3 and 3 x 10 -3 m s-• per
day, respectively. Taking into account the accuracy of the
WINDII and MICADO measurements, the standard deviation
of both slopes are 10 -2 m s -• per day. At the end of the
correlation period the expected drift could reach _+ 13 m s-•.
This cannot be detected from the MICADO and WINDII
individual measurements considering their respective accura-
cies.
3.2. Direct Correlations
For the period of WINDII data availability, 34 direct corre- lations were made over 21 days. Three of them were discarded for the following reason: Considering in detail the correspond- ing WINDII vertical profiles of those particular cases, it was
found that either the intensity or the wind or the temperature
were not correct with respect to the other profiles obtained in
similar conditions. The failure in the retrieval process has
several origins, including the homogeneity of the observed area, scattered light, and incorrectly removed star contribu-
tion. For these cases, there are differences of the order of 40 to 60 m s -• between WINDII and MICADO. It must be noted
that such profiles do not invalidate the overall data set as illustrated by McLandress et al. [1994] results using zonal av-
eraged data.
Finally, 31 direct correlations remain and represent 22% of the possible total. Figures 5a and 5b show the WINDII mea-
surements displayed versus MICADO for both components. The points are found near the bisector. The velocity range of
these correlations extends from -100 to 80 m s-• allowing the
distribution of MICADO-WINDII differences to be deter-
mined. These are shown in Figures 6a and 6b. For both com-
ponents the mean differences are close at around -10 m s-•.
This value and the corresponding standard deviation are given
in Table 1.
3.3. Correlations Within --.5 Days
Within _+5 days between the WINDII and the MICADO
measurements the number of effective correlations increases to
70. While the percentage of achieved correlations for the direct case was only 22%, it increases to 46% of the possible total for the ___5-day correlations.
MICADO versus WINDII winds are displayed in Figures 7a and 7b for the meridional and zonal components, respectively. The corresponding distributions of differences are shown in Figures 8a and 8b. For +__5-day correlations as well as for direct ones, there is a linear dependence between WINDII and MICADO measurements. Yet, the slope between the two data sets is different from unity for _+5-day correlations. This may
result from the fact that for _+5 days, one WINDII observation may correspond to several MICADO measurements, so that
the MICADO value associated with the WINDII one is an
average. This can partly explain the scatter on Figure 7 which
Table 1. Mean Values and Standard Deviations of MICADO-WINDII Differences for
Two Components of the Wind Listed for Direct Correlations, Correlations Within _+5 days, and Monthly Means Averaged Over a Year
Direct _+5 days Monthly
Component Meridional Zonal Meridional Zonal Meridional Zonal Mean, m s -• -9.0 -9.9 -11.8 -8.9 -12.4 -10.1
THUILLIER ET AL.: MICADO WIND MEASUREMENTS 10,437
contributes to the apparent bias. Further investigations show
that the correlation coefficient increases while the number of
observations decreases when considering correlations within +5 days (0.62), +2 days (0.71), and ___ 1 day (0.74), respectively. This clearly indicates that the time range plays a significant role likely due to the day-to-day variability of the wind field (e.g., planetary waves). In addition, since direct cases (section 3.3) and the seasonal variation of the semidiurnal amplitude (sec- tion 3.6) do not exhibit any bias, it is unlikely that WINDII and MICADO could be a biased system. It is acknowledged that the detailed origin of the apparent bias is not fully explained at this time and needs further study. For both components the
mean differences are close to the results obtained in the case of
the direct correlations (Table 1).
3.4. Comparison Between WINDII and MICADO Local
Time Variation of the Wind
For each month of the year, MICADO data and WINDII observations nearby OHP were organized as a function of local time and averaged over 1-hour boxes. For each local time, each MICADO point contains measurements gathered during most
of days of the month. For WINDII, only one or two observa-
tions are used because UARS goes through 1 hour local time in 3 days, so that local time is aliased against the days of the
month. In addition, we use WINDII data, extending over a 3-year period, which are taken under different viewing condi- tions and finally gathered into boxes at a given local time. As is discussed in section 3.5, an offset zero wind phase reference
leads north- and south-viewing conditions to introduce differ- ent offsets when combining the two fields of view measure- ments. Consequently, for WINDII the averaging is less effi-
cient than for MICADO and besides the atmosphere
variability, the sampling may induce some bias. Figure 9 dis-
plays the WINDII and MICADO winds as a function of local
time for January. The WINDII curve can be described in terms of a mean local time variation and a dispersion around this
mean. From the previous discussion, it appears that the corn-
MERIDIONAL COMPONENT OF THE WIND
40 [- typical e .... bar I o L Oo _..•o•o oo•
o[-
oo
o
I _•obcO •b .-40•- o ?•ø•)o
I- o OoO•• o v .-o
o
- H
'•
I
I
I
I
I
I
I
I
-100 -80 -60 -40 -20 0 20 40 60 WINDH (mb) ZONAL COMPONENT OF THE W/ND
40
•
I , , , I I ' Y4
C
[ typicalerrorbarJ
• o' o o •2-•o • ol[-
oooo
ø
-oo-
q
•
o o o
g -40
0 o o
o
-80 • I I I ! I ! I I -1• -80 -60 -40 -20 0 20 40 60 • (m s 4)Figure 7, Relationship between the wind measured by WIN-
DII and MICADO above OHP for correlations within •5
days: (a) meridional component, (b) zonal component.
a)
DISTRIBUTION OF MERIDIONAL WIND DIFFERENCES
40-
=o- : I- i•.Sms-'l
I I I I
-100 -50 0 50 MICADO - WINDII (m s 4)
b) DISTRIBU•ON OF ZONAL W/ND DIFFERENCES
40- i i i 30- '
20-
i
J-s'9ms-'l
,10-
,
i I I I I I I I -60 -40 -20 0 20 40 60MICADO - WINDII (m s -i)
Figure 8. Distribution of the wind difference between
MICADO and WINDII measurements for correlations within
_+5 days' (a) meridional component, (b) zonal component.
bined effects of the sampling and of the atmosphere variability are not randomly distributed. Consequently, they are likely the sources of the dispersion but are also able to generate a ran-
dom bias in the monthly mean difference. Indeed, Table 2
shows that the mean differences are variable with the months
due to different observation conditions (viewing and number of measurements). To improve the averaging effect, all months
have been considered and the corresponding differences have
MERIDIONAL WIND
60
•
ß W]2,,,TDii
I
I
I
I 5 I
/ \
40
F '"'""'
MICAD0
•x,. / •
•'• 20[--
/ 'x /
•
...-- / •.• 0
.,/ Ix, /
/
;> -20 -40 -60 ! I I I I I 18 20 22 0 2 4 6 L.T ZONAL WIND I I i I I 60- - 40 t-...0
/
:> -20
-40•1
/ /
-60 - I I I I I • 18 20 22 0 2 4 6 L.TFigure 9. Comparison between the local time average of
OHP observations and WlNDII measurements for the month
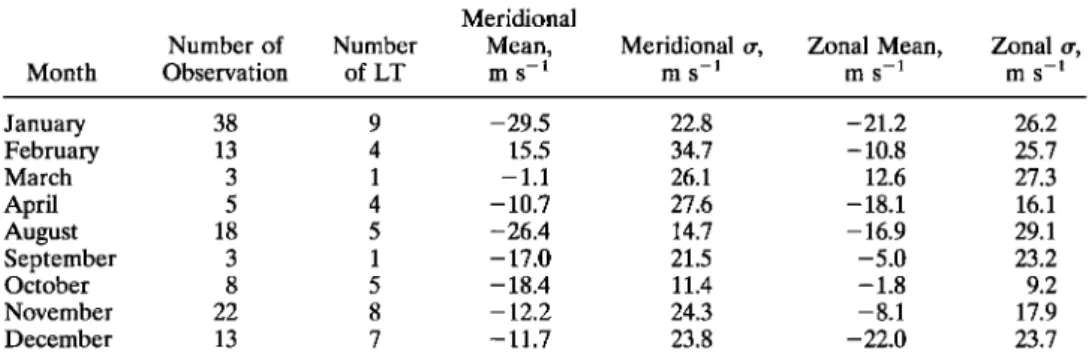
Table 2. Number of Observations and Covered Local Time for Each Month As Well As
the Mean Difference and the Associated Standard Deviation for Both Components
Meridional
Number of Number Mean, Meridional rr, Zonal Mean, Zonal
Month Observation of LT m s -• m s -• m s -• m s -• January 38 9 -29.5 22.8 -21.2 26.2 February 13 4 15.5 34.7 - 10.8 25.7 March 3 1 - 1.1 26.1 12.6 27.3 April 5 4 -10.7 27.6 -18.1 16.1 August 18 5 -26.4 14.7 - 16.9 29.1 September 3 1 - 17.0 21.5 -5.0 23.2 October 8 5 - 18.4 11.4 - 1.8 9.2 November 22 8 - 12.2 24.3 - 8.1 17.9 December 13 7 - 11.7 23.8 - 22.0 23.7
been averaged over a year. We have verified that the resulting
mean difference of about 10 m s -• between WINDII and
MICADO is statistically significant. For that purpose the Stu- dent's test has been applied to the WINDII and MICADO
data set. This shows that the difference of means remains
significant
(above
90%) above
8 and 6 m s -• for the meridional
and zonal component, respectively. These conditions are sat- isfied with our results. For both components the annual mean difference and its standard deviation are given in Table 1.
3.5. MICADO-WINDII Wind Difference Related to Each Instrument Field of View
In this section we investigate the impact of a bias of the zero
wind phase for each field of view on the reconstructed merid- ional and zonal components of the wind taking into account the geometry of observations made in orbit. Let A• and A 2, be the offset applied to each WINDII field of view, respectively.
Let A•4 and A z be the differences between WINDII and
MICADO for the meridional and zonal wind component, re- spectively. Each direct correlation provides A•u, Az, and the
line-of-sight angle of the WINDII fields of views 1 and 2 which
contribute to the recombination. Then, it is possible to derive A• and A2, the corresponding offset for each WINDII field of view by inverting the equations of projection. Statistical anal- ysis of direct correlations following that procedure leads to a
mean
offset
of 9 m s -• for both fields
of view (Table
3). This is
consistent with the same type of systematic error made during the instrument characterization. Furthermore, since the zero
wind phase was measured only for one field at ground and the zero wind phase of the other field was obtained by symmetry using a mathematical model of the interferometer, it is natural that in the case of a systematic error the error propagates simultaneously in both fields in the same manner.
Let us assume that a given offset exists for each field of view. We have pointed out above that this systematic wind shift would affect differently the calculated meridional and zonal winds according to the viewing direction. Moreover, as the
Table 3. Mean Values and Standard Deviations of
MICADO-WINDII Differences for Two Fields of View
of WINDII As Derived From Direct Correlations
FOV 1 FOV 2
Mean, m s -• -9.2 -8.9 rr, m s -• 23.9 20.8 FOV, field of view.
WINDII line-of-sight angle changes along the orbit, the mag- nitude of the error of the wind components appears to be a function of latitude and longitude. This is illustrated in Figure
10 for which the offset on fields of view 1 and 2 was set to 9 m s-•. Then, we derive the resulting offset for the meridional and
zonal wind components along the orbit under south- and north-looking conditions, respectively. South- or north-viewing conditions give similar results. The northward component of
the observed wind remains overestimated along the orbit track
with a magnitude twice as large at extreme latitudes than at
about -20 ø of latitude for south-viewing and +20 ø for north-
viewing conditions. For the eastward component the wind ve- locity is at one time overestimated and at another time under- estimated with the same magnitude depending upon the upleg or downleg orbit track. In all cases the induced wind offsets are
within _+ 12 m s -•. • 5 -10 _ [] [] [] [] [] [] [] [] m ø _ [] - [] 0 Meridional wind [] Zonal wind - I [] [] I[] n I[] [] ? [] I I- -60 -40 -20 0 20 40 Latitude (deg) b) -lO q:l ø i i i i i 0o _1-1 _ - [] 0 Meridional wind [] [] Zonal wind n-- I I • [] [31 a []l [] I -40 -20 0 20 40 60 Latitude (deg)
Figure 10. Meridional and zonal wind offsets along the orbit
track as induced by a constant offset of 9 m s-• on both fields
of view: (a) under south-viewing conditions, (b) under north- viewing conditions.
THUILLIER ET AL.' MICADO WIND MEASUREMENTS 10,439
MERIDIONAL WIND AMPLITUDE
sop- • • • +l / I"• wemn I / 40 30 20 10 8 10 12 2 4 50 4O lO o Month
b MBRIDIONAL WIND PHASE l-o-- WINDII I
• 10
• 8I-ø-
MsC•Ol
• 64
• 2 • 0 I I 8 10 12 2 4 Month ZONAL WIND AMPLITUDE4- i i i
I-•- WINDII I
8 10 12 2 4
ZONAL WIND PHASE
rip- [ ] [ -4-[
'• 101
I-•-wemu
I l
•. 2 o I I I 8 10 12 2 4 Month MonthFigure 11. Comparison between the seasonal variation of the semidiurnal wind regime as derived from zonal average of WINDII data and MICADO observations at OHP. (a) Meridional and zonal amplitude of the semidiurnal tide, (b) meridional and zonal phase of the semidiurnal tide.
3.6. Comparison With the OHP Semidiurnal Model
At OHP, MICADO has been typically observing with a minimum of one complete night per month. For each month,
these data were added to the measurements taken for the
correlative periods. The resulting data set was analyzed by Fauliot et al. [1994] who provided the seasonal variation of the amplitude and phase of the semidiurnal tide of the two-wind
components from August to April.
For each month, the WINDI! observations made in the
correlation area do not cover enough local time to allow an
analysis of the wind variation as a function of time in terms of
mean, diurnal, and semidiurnal circulation. Consequently, we applied a zonal average over the latitude range [40øN-48øN] and used 2 months of data rather than 36 days as required to
scan 24 hours of local time. Then, most of the local time range
is covered except around twilight passes. These data are used to deduce the monthly amplitude and phase of the semidiurnal tide and to compare with those deduced from MICADO ob- servations at OHP. Results are displayed in Figure 11. They are in quite good agreement, particularly during winter months
while discrepancies of about 10 m s-• in amplitude and more
than 2 hours in phase arise at equinoxes. However, we are
aware that some rapidly changing phenomenon may be damped due to the use of zonally averaged data and of a local time variation based on the 2-month averaging period of WIN-
DII measurements. Furthermore, tidal characteristics may ex-
hibit longitudinal variation, especially at the time of transitions of the wind flow [Lysenko et al., 1994]. This certainly leads to
the masking, from WINDII data, of the strong phase transition
in fall that is otherwise observed by MICADO.
4. Conclusions
Correlative measurements were carried out between
WINDII and MICADO placed at OHP. Three different ways have been considered to compare data from orbit and from ground: direct correlations, correlations within +5 days, and correlations within a month for comparing WINDII data with
mean monthly MICADO models. We have used data for the two instrument fields of view generated with the version V4.23 of the scientific production software providing the zonal and meridional components of the wind. Among all possible direct correlations with OHP, only 22% were achieved. The few de- fective correlations are mainly explained by abnormal WINDII profiles of intensity, temperature or wind. The following results have been derived for improving the characterization of the
night-time WINDII observations.
No trend as a function of time seems detectable with the
data used in this study. For the viewing conditions as met
around OHP, it appears that WINDII overestimates the me-
ridional and zonal wind components by 10 m s -1. The three
methods of comparison provide consistent results.
This wind difference has been related to the two instrument fields of view. It corresponds to an overestimate of 9 m s-• on both fields. This result is due to the method of characterization
of the zero wind phase of the instrument. A wind offset per field of view generates a variable offset along the orbit track for the resulting meridional and zonal wind components due to the geometry of the combination of line-of-sight winds. With an
overestimate of 9 m s -• per field the two horizontal wind
components
can be affected
by a variable
offset
of +_
12 m s -•.
The amplitude and phase of the semidiurnal tide, as ob- served by MICADO from ground and WINDII in orbit, are similar. A discrepancy found around equinoxes has been ex-
plained.
Acknowledgments. The WINDII project is sponsored by the Ca- nadian Space Agency and the Centre National d'Etudes Spatiales. Additional support for science analysis is provided by the Natural Sciences and Engineering Research Council of Canada and the Centre National de la Recherche Scientifique. The MICADO experiment has been developed at Service d'A6ronomie (SA), the Observatoire de Haute-Provence (OHP), the Centre d'Etudes et de Recherches en Geodynamique et Astrom&rie (CERGA), and the Centre d'Etudes Spatiales du Rayonnement (CESR). The data processing has been led by G. AZRIA (SA). The MICADO investigation has been supported by the Institut National des Sciences de l'Univers, the Centre National
d'Etudes Spatiales, and the Centre National de la Recherche Scienti- fique (GRECO Plasma E and PAMOY). We thank J. L. Chevassut and M. Fehrenbach for operating the MICADO instrument according to the correlative measurements program and the Observatoire de Haute-Provence for supporting these observations.
References
Bouchareine, P., and P. Connes, Interferometer with compensated field for Fourier transform spectroscopy, J. Phys., 24, 134-138, 1963. Fauliot, V., G. Thuillier, and M. Hers•, Observations of the F-region horizontal and vertical winds in the auroral zone, Ann. Geophys., 11,
17-28, 1993.
Fauliot, V., G. Thuillier, and M. Hers•, Observations of the E-region horizontal winds in the auroral zone and at mid-latitudes by ground- based interferometry, Ann. Geophys., 13, 1172-1186, 1995. Forbes, J. M., and F. Vial, Monthly simulations of the solar semi-
diurnal tide in the mesosphere and lower thermosphere, J. Atmos. Terr. Phys., 51,649-662, 1989.
Lilensten, J., G. Thuillier, C. Lathuillere, W. Kofman, V. Fauliot, and
M. Hers•, EISCAT-MICADO coordinated measurements of merid-
ional wind, Ann. Geophys., 10, 603-618, 1992.
Lysenko, I. A., Y. I. Portnyagin, A. N. Fakhrutdinova, R. A. Ishmu- ratov, A. H. Manson, and C. E. Meek, Wind regime at 80-110 km at mid-latitudes of the northern hemisphere, J. Atmos. Terr. Phys.,
56, 31-42, 1994.
Manson, A. H., C. E. Meek, H. Teitelbaum, F. Vial, R. Schminder, D.
Kurschner, M. J. Smith, G. J. Fraser, and R. R. Clark, Climatologies of semi-diurnal and diurnal tides in the middle atmosphere (70-110 km) at middle latitudes (40-55ø), J. Atmos. Terr. Phys., 51,579-593,
1989.
Massebeuf, M., R. Bernard, J. L. Fellous, and M. Glass, Simultaneous
meteor radar observations at Monpazier (44øN) and Punta Boriquen (18øN), II, Mean zonal wind and long period waves, J. Atmos. Terr. Phys., 43, 535-542, 1981.
McLandress, C., Y. Rochon, G. G. Shepherd, B. H. Solheim, G. Thuil- lief, and F. Vial, The meridional wind component of the thermo- spheric tide observed by WINDII on UARS, Geophys. Res. Lett., 2•(22), 2417, 1994.
Meek, C. E., and A. H. Manson, Vertical motions in the Upper Middle Atmosphere from Saskatoon (52øN, 107øW) M. F. Radar, J. Atmos.
Sci., 46, 849-858, 1989.
Shepherd, G. G., et al., The wind imaging interferometer on the Upper Atmosphere Research Satellite, J. Geophys. Res., 98, 10725-10750,
1993.
Sipler, D. P., M. A. Biondi, and M. E. Zipf, Vertical winds in the midlatitude thermosphere from Fabry-Perot Interferometer mea- surements, J. Atmos. Terr. Phys., 57, 621-629, 1995.
Thuillier, G., and M. Hers6, Thermally stable field compensated Mich- elson interferometer for measurement of temperature and wind of the planetary atmospheres, Appl. Opt., 30, 1210-1220, 1991. Thuillier, G., and G. G. Shepherd, A fully compensated Michelson
interferometer of fixed path difference, Appl. Opt., 24, 1599-1603,
1985.
Thuillier, G., C. Lathuillere, M. Hers6, C. Senior, W. Kofman, M. L. Duboin, D. Alcayde, F. Barlier, and J. Fontanari, Co-ordinated
EISCAT-MICADO interferometer measurements of neutral winds
and temperatures in E- and F-regions, J. Atmos. Terr. Phys., 52,
625-636, 1990.
L. Bourg, V. Fauliot, M. Hers6, and G. Thuillier (corresponding author), Service d'A6ronomie du CNRS BP No. 3, 91371 Verri•res-
le-Buisson Cedex, France.
G. G. Shepherd, Centre for Research in Earth and Space Science, York University, Toronto, Ontario, Canada.
(Received November 9, 1994; revised October 21, 1995; accepted November 10, 1995.)