HAL Id: hal-01577492
https://hal.archives-ouvertes.fr/hal-01577492
Submitted on 3 Jun 2020HAL is a multi-disciplinary open access
archive for the deposit and dissemination of sci-entific research documents, whether they are pub-lished or not. The documents may come from teaching and research institutions in France or abroad, or from public or private research centers.
L’archive ouverte pluridisciplinaire HAL, est destinée au dépôt et à la diffusion de documents scientifiques de niveau recherche, publiés ou non, émanant des établissements d’enseignement et de recherche français ou étrangers, des laboratoires publics ou privés.
Combining different modelling approaches for a
participative assessment of alternative agricultural
systems at different scales
Sylvestre Delmotte, Santiago Lopez Ridaura, Gaël Goulevant, Jean-Claude
Mouret, Christophe Le Page, Philippe Chauvelon, Alain Sandoz, Jean Marc
Barbier, Jacques Wéry
To cite this version:
Sylvestre Delmotte, Santiago Lopez Ridaura, Gaël Goulevant, Jean-Claude Mouret, Christophe Le Page, et al.. Combining different modelling approaches for a participative assessment of alternative agricultural systems at different scales. 5. World Congress on Conservation Agriculture, Grains Research and Development Corporation (GRDC). Barton, AUS.; Australian Centre for International Agricultural Research (ACIAR). Bruce, AUS., Sep 2011, Brisbane, Australia. �hal-01577492�
Combining different modelling approaches for a participative assessment
of alternative agricultural systems at different scales
Delmotte S 1, Lopez-Ridaura S1, Goulevant G1, Mouret JC1, Le Page C2, Chauvelon P3, Sandoz A3, Barbier JM1, Wery J4
1
INRA, UMR Innovation, 2 place Pierre Viala, 34060 Montpellier Cedex 2, France ; delmotte@supagro.inra.fr
2
CIRAD, UPR Green, Campus International de Baillarguet, 34398 Montpellier Cedex 5, France
3
Fondation Sansouire, Station Biologique de la Tour du Valat, Le Sambuc, F-13200 Arles, France
4
SupAgro, UMR System, 2 place Pierre Viala, 34060 Montpellier Cedex 2, France
Keywords: Land use change, bio-economic model, agent-based model, organic farming,
CAP, policies
Introduction
Evaluating the impacts and performances of alternative cropping and farming systems in a region requires the use of proper systems analysis tools. Contextualizing this evaluation in a prospective scenario analysis of a region is needed, as an alternative systems may be adapted to the current context but may have serious drawbacks if the socio economic context change (Blazy et al., 2009). Models are essential tools as they can integrate the effects of change of context (i.e. policy and prices) and of systems and calculate multiple indicators at different scales for the different sustainability domains (economic, social and environmental) (van Ittersum et al., 2008). The multifunctional nature of agriculture is increasingly recognized meaning that different stakeholders, with different objectives (i.e. agricultural production, nature conservation) have interests and objectives about the evolution of farming systems in a region. Therefore, evaluating scenarios of agriculture evolution, which integrate both alternative systems and new policies, requires a prospective, integrated (multi-criteria and interdisciplinary), multi-scale and participative approach. On the basis of a comparative analysis of various modelling tools we have developed the PIMPAAS approach (Prospective, Integrated, Multiscale and Participative Assessment of Agricultural Systems; Delmotte et al, 2011). PIMPAAS combines detailed knowledge on cropping and farming systems with land use change, bio-economic and agent-based models in order to build and assess scenarios of agricultural evolution in interaction with the stakeholders in a region. This approach is targeted to assist stakeholders in the negotiations of local policies as well as consensus building on local development objectives.
This paper presents the methodology currently implemented in the Camargue Region (southern France). We first present briefly the models, data and participative methodologies that were developed and then the main results of their applications for two scenarios: foreseen changes in the Common Agricultural Policy 2013, and an extension of organic farming (OF) in the region.
Materials and Methods
Through 20 years of action research in the Rhone river delta of Camargue, a good knowledge of farming systems structures and performances and local stakeholders network was acquired. We conducted a first series of interviews with most influential stakeholders of the region (e.g. grain collectors, farmer syndicate and natural regional park) to present the project and engage
them in the process of defining scenarios and indicators for their evaluation. From interviews with farmers, farmers fields surveys, crop modelling, local expert knowledge and regional statistics, a database quantifying the current and alternative agricultural activities was developed (e.g. average yield for ten most common crops, labour demand, fuel, pesticides and fertilizers consumption). A GIS was developed to get spatial information about soil types, altitude and irrigation infrastructure as well as a spatial farm typology to capture the variability of farming systems and to upscale in the models. We first conducted a retrospective land use change (LUC) analysis for 11 consecutive years (1998-2008) for the central sub-region. The results were used to enhance first discussions with stakeholders and evidence the need for participative workshops for scenarios assessment.
We then developed an interactive agent-based model (ABM) where farmers make choices for an hypothetical farm (derived from the typology) in terms of crop and style of production (organic or conventional, intensive or extensive). Simulations are done for seven consecutive years and outputs are the indicators previously identified at different scales (e.g. field, farm, water distribution area) with the farmers (e.g. gross margin, labour demand) and other stakeholders (e.g. employment, water use, subsidies). Participative workshops were conducted using the ABM with farmers to explore a scenario related to CAP reform. Other workshops are being organised with farmers and local stakeholders to assess the same scenario and have discussions about the impacts of farmers choices at sub-regional and regional scale. In parallel, bio-economic models (BEM) at different scales were developed to discuss with stakeholders plausible adaptation strategies to the CAP reform and evaluate the potential for OF in this context. The results of the BEM will serve, in a final workshop using the ABM, to delimit the solution space for different scenarios and guide farmers choices as well as the development of local environmental policy measures. Results of this final workshop will be presented during the congress. In the next part, we present the type of results that were obtained from first PIMPAAS application in the Camargue and discuss them from the point of view of participation.
Results and Discussion
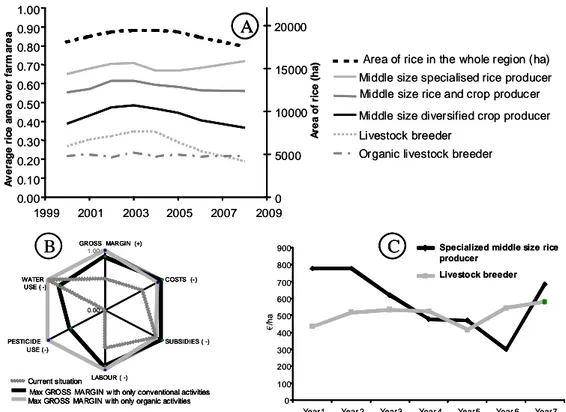
Figure 1-A shows the evolution of the average proportion of farm area devoted to rice, for five farm types, resulting from a LUC analysis. While the organic livestock breeders had a stable 20% of their area in rice, the livestock breeders and the diversified cereal producers had a downslope trend. Specialized rice producers had a stable or increasing rice area. Taking into account the current CAP high subsidy level for rice production, this analysis shows the vulnerability of specialised farmers to CAP reforms. Livestock breeders and diversified cereal producers can be expected to be more resilient to the foreseen reduction of rice specific subsidy, and could more easily convert to organic production as it implies to shift to long and diversified rotations and therefore to reduce the rice area. To verify such hypothesis, we used a BEM to simulate the possibility and impact of a conversion to OF for these types of farm. Figure 1-B presents a radar graph for a specialized rice producer farm with 425 hectares when the gross margin is maximized with conventional and organic activities. Organic and conventional activities result in similar gross margin, costs, subsidies and labour while for pesticide use and water use the OF activities provide better values. Compared to the current situation, it can be seen that gross margin can be nearly doubled with both conventional and organic production options. However, it has to noticed that the BEM is optimising land use for a single year without taking into account the rotations needed to reach such optimal land use. Results from the BEM show that OF can be as competitive as conventional farming
while reducing possible impacts on the environment however, the pathways for conversion are not explicitly given. Such pathways were then explored with farmers by the use of ABM. In Figure 1-C the evolution of gross margin is shown for two different farm types as simulated by two farmers in the ABM in a participatory scenario evaluation where the specific subsidy for rice was not given from the year 3 onward. Both farmers reacted to the hypothetical CAP reform by converting part of their farm to OF. The CAP reform and consequent conversion to OF didn’t have a large effect for the livestock breeder while for the rice producer, conversion to OF implies a diversification of production, and an initial decrease of gross margin linked to the reduction of rice surface in the conversion to OF. At the end of the simulation, gross margin of the rice producer is recovered as, once the transition period has ended, all productions are sold at the prices of organic products. Combining the three approaches for the evaluation of scenarios highlights their complementarities. The LUC analysis is used as a tool to make hypotheses, from a retrospective point of view, on the potential adaptability to CAP reforms by different farm types. BEM is used for assisting reflection on plausible and desired scenarios and identifying the main biophysical constraints. Finally, ABM is used to test possible adaptation strategies of farmers and to organize and focus the collective discussions.
Figure 1- A: Land use change analysis of the evolution of the proportion of farm area that
was devoted for rice between 1998 and 2008 (moving average of 3 years for all farms of a given type) and total area on rice in the whole region. B: Current situation for a chosen
middle size specialized rice producer and maximization of the gross margin with conventional and organic activities scenarios (from BEM), the outer circle of the radar the
best values for each indicator, (-) means that this indicator is to be minimized while (+) means to be maximized, “SUBSIDIES” is the rate of subsidies in the gross margin, LABOUR
is the gross margin divided by the labour demand. C: Evolution of the gross margin as simulated by two farmers using the ABM during an interactive simulation workshop about
the CAP reform.
0 100 200 300 400 500 600 700 800 900
Year 1 Year 2 Year3 Year 4 Year5 Year 6 Year7
€
/h
a
Specialized middle size rice producer Livestock breeder 0.00 0.10 0.20 0.30 0.40 0.50 0.60 0.70 0.80 0.90 1.00 1999 2001 2003 2005 2007 2009 A v e ra g e r ic e a re a o v e r fa rm a re a 0 5000 10000 15000 20000 A re a o f ri c e (h a )
Middle size specialised rice producer
Middle size diversified crop producer Livestock breeder
Organic livestock breeder
Area of rice in the whole region (ha) Middle size rice and crop producer
B 0.00 1.00 GROSS MARGIN (+) COSTS (- ) SUBSIDIES ( -) LABOUR ( -) PESTICIDE USE ( -) WATER USE ( -)
Max GROSS MARGIN w ith only conventional activities Current situation
Max GROSS MARGIN w ith only organic activities
0.00 1.00 GROSS MARGIN (+) COSTS (- ) SUBSIDIES ( -) LABOUR ( -) PESTICIDE USE ( -) WATER USE ( -)
Max GROSS MARGIN w ith only conventional activities Current situation
Max GROSS MARGIN w ith only organic activities
C A 0 100 200 300 400 500 600 700 800 900
Year 1 Year 2 Year3 Year 4 Year5 Year 6 Year7
€
/h
a
Specialized middle size rice producer Livestock breeder 0.00 0.10 0.20 0.30 0.40 0.50 0.60 0.70 0.80 0.90 1.00 1999 2001 2003 2005 2007 2009 A v e ra g e r ic e a re a o v e r fa rm a re a 0 5000 10000 15000 20000 A re a o f ri c e (h a )
Middle size specialised rice producer
Middle size diversified crop producer Livestock breeder
Organic livestock breeder
Area of rice in the whole region (ha) Middle size rice and crop producer
B 0.00 1.00 GROSS MARGIN (+) COSTS (- ) SUBSIDIES ( -) LABOUR ( -) PESTICIDE USE ( -) WATER USE ( -)
Max GROSS MARGIN w ith only conventional activities Current situation
Max GROSS MARGIN w ith only organic activities
0.00 1.00 GROSS MARGIN (+) COSTS (- ) SUBSIDIES ( -) LABOUR ( -) PESTICIDE USE ( -) WATER USE ( -)
Max GROSS MARGIN w ith only conventional activities Current situation
Max GROSS MARGIN w ith only organic activities
C C A
Farmers found the approach powerful to help them thinking of possible adaptation they could do on their farm, while other stakeholder appreciated the transparency of the tools as an advantage for negotiation among them. Uncertainty and validation of data and models was a recurrent subject of discussion between scientist and participants, and the capacity to change the value of certain parameters during interactive simulations was found as a necessary characteristic to enhance confidence in the simulation. The case studies reported here focus on two specific scenarios with conventional and organic activities. However, conservation agriculture (CA) is being tested in on-farm experiments, allowing to include CA activities in further scenarios analyses. Other regions where environmental concerns and agriculture are issues at stakes could benefit from this experience in the combination of approaches.
References
Delmotte S, Lopez-Ridaura S, Barbier JM and Wery J. 2011. Methodological concerns about participatory scenario assessment of alternative farming system at different scales. To be subm. Ag. Sys.
Blazy, J.-M., Dorel, M., Salmon, F., Ozier-Lafontaine, H., Wery, J., Tixier, P., 2009. Model-based assessment of technological innovation in banana cropping systems contextualized by farm types in Guadeloupe. Eur. J. Agr 31, 10-19.
van Ittersum, M.K., Ewert, F., Heckelei, T., Wery, J., Alkan Olsson, J., Andersen, E., Bezlepkina, I., Brouwer, F., Donatelli, M., Flichman, G., Olsson, L., Rizzoli, A.E., van der Wal, T., Wien, J.E., Wolf, J., 2008. Integrated assessment of agricultural systems - A component-based framework for the European Union (SEAMLESS). Ag. Sys. 96, 150-165.