HAL Id: inserm-00371006
https://www.hal.inserm.fr/inserm-00371006
Submitted on 15 Mar 2010
HAL is a multi-disciplinary open access archive for the deposit and dissemination of sci-entific research documents, whether they are pub-lished or not. The documents may come from teaching and research institutions in France or abroad, or from public or private research centers.
L’archive ouverte pluridisciplinaire HAL, est destinée au dépôt et à la diffusion de documents scientifiques de niveau recherche, publiés ou non, émanant des établissements d’enseignement et de recherche français ou étrangers, des laboratoires publics ou privés.
IQ, socioeconomic status, and early death: The US
National Longitudinal Survey of Youth.
Markus Jokela, Marko Elovainio, Archana Singh-Manoux, Mika Kivimäki
To cite this version:
Markus Jokela, Marko Elovainio, Archana Singh-Manoux, Mika Kivimäki. IQ, socioeconomic status, and early death: The US National Longitudinal Survey of Youth.. Psychosomatic Medicine, Lippin-cott, Williams & Wilkins, 2009, 71 (3), pp.322-8. �10.1097/PSY.0b013e31819b69f6�. �inserm-00371006�
IQ, Socioeconomic Status, and Early Death: The U.S. National
Longitudinal Survey of Youth
Psychosomatic Medicine, in press (23.09.2008)
Markus Jokela, Ph.D.,1,2 Marko Elovainio, Ph.D.,1,3 Archana Singh-Manoux, Ph.D.,1,4 Mika Kivimäki, Ph.D.1
1
Department of Epidemiology and Public Health, University College London, London, UK;2Department of Psychology, University of Helsinki, Finland;3National Research and Development Centre for Welfare and Health, Finland;4INSERM U687, France
Correspondence to:
Markus Jokela, Department of Psychology, University of Helsinki, P.O. Box 9, FIN-00014, University of Helsinki, Finland. Tel. +358-9-19129526, Fax. +358-9-19129521, E-mail: markus.jokela@helsinki.fi
Manuscript statistics: 5980 in manuscript (text, references, tables), 201 words in abstract,
3 tables, 2 figures
ABSTRACT
Objective: To assess whether the association between cognitive ability (IQ) and early
mortality is mediated by socioeconomic status (SES) or whether the association between SES and mortality reflects a spurious association caused by IQ.
Methods: The participants were from the U.S. National Longitudinal Survey of Youth
(n=11321). IQ was assessed at age 16 to 23 years and the participants were followed up to 40 to 47 years of age.
Results: Controlling for sex, birth year, race/ethnicity, baseline health, and parental
education, higher IQ was associated with lower probability of death (odds ratio per 1 standard deviation increase in IQ=0.78, 95% confidence interval= 0.66, 0.91). This association disappeared (OR=0.99, CI=0.81, 1.20) when adjusted for education and household income. Adjustment for IQ had no effect on the association between SES and mortality. These findings were similar in Hispanic, Black, and White/other participants and in women and men. Parental education moderated the IQ-mortality association, so that this association was not observed in participants with low parental education.
Conclusions: Low IQ predicts early mortality in the U.S. population and this association is
largely explained by SES. The results do not support the alternative hypothesis that the socioeconomic gradient in early mortality would reflect IQ differences.
Keywords: Cognitive ability; Cognitive epidemiology; Intelligence; Mortality; NLSY Abbreviations: IQ=intelligence quotient, SES=socioeconomic status, OR=odds ratio,
General cognitive ability, assessed by cognitive tests and often referred to as intelligence quotient (IQ), reflects a general capacity of abstract reasoning and learning potential (1-3). An increasing number of studies have shown that high IQ in childhood or early adulthood predicts low mortality risk over the life course (4-15). However, the mechanisms
underlying the association between IQ and mortality remain uncertain (14-15). One possibility is that IQ predicts mortality because IQ is related to social and economic
circumstances predicting mortality. An alternative scenario suggests that the effect of these circumstances on mortality is largely accounted for by IQ.
It is well established that low IQ in childhood or adolescence predicts low socioeconomic status (SES) later in life (16-17) and that low SES, in turn, predicts mortality risk over the life course (18-19). These associations give rise to two competing hypotheses of IQ, SES, and mortality. One the one hand, the effect of IQ on mortality may be mediated via socioeconomic circumstances. This hypothesis has received provisional support, as education and occupational status have been found to explain the IQ–mortality association in part, although not completely (14-15). On the other hand, it has been
hypothesized that IQ may explain health disparities associated with SES (20) by determining both SES and mortality risk, so that the association between SES and mortality is actually explained by IQ. This hypothesis has also received provisional support, as IQ has been found to account for the association between SES and mortality in part, although not completely (12).
The study of IQ, SES, and mortality is important in understanding the mechanisms explaining the IQ–mortality association and for understanding the origins of the
mortality have included only limited assessments of SES: In most studies, adulthood SES has been assessed only in one point in time, which may be an insufficient method of evaluating the effect of IQ on lifetime SES and the influence of SES on mortality.
In the current study, we examined whether IQ assessed at the age 16 to 23 predicted death before the age of 47 in an ethnically heterogeneous sample of men and women participating in the U.S. National Longitudinal Survey of Youth (22). The study design allowed us to examine whether the influence of IQ on mortality was mediated by life-course SES, i.e., education and household income, assessed 19 times over the follow-up period, and whether the association between SES and mortality was accounted for by IQ. We also examined whether education level of the participants’ parents accounted for part of the IQ-mortality association.
MATERIALS AND METHODS Participants
The participants were 5682 men and 5639 women (total n=11321) participating in the representative U.S. National Longitudinal Survey of Youth (22). In this study, a national sample of individuals born between 1957 and 1964 has been followed annually since 1979 and biannually after 1994 with most recent data available on the follow-up in 2004. The original sample (n=12686) consists of three subsamples aged 15 to 22 years at baseline in 1979: a representative sample of noninstitutionalized civilian youths (n=6111); a
supplemental sample designed to oversample civilian Hispanic, black, and economically disadvantaged nonblack/non-Hispanic youths (n=5295); and a military sample (n=1280). Details of the sampling process have been reported elsewhere (22;
http://www.bls.gov/nls/nlsy79.htm). Due to funding constraints, the number of interviewed military sample and supplemental sample members were limited after years 1984 and 1990, respectively. Here we included all the 11321 participants who had completed a cognitive test administered in 1980 and had data on covariates and on study participation status on at least one of the 19 subsequent follow-up interviews between 1981 and 2004.
Appropriate longitudinal sampling weights taking into account sex, race/ethnicity, year of birth, sample type, and location were applied in the survival analyses in order to adjust for differential probabilities of selection into the sample and for attrition. Thus, the sample yielded representative estimates for the U.S. population born between years 1957 and 1964. The study was approved by institutional review boards of the institutions conducting the surveys and informed consent was obtained complying with Federal law and the policies of the U.S. office of Management and Budget.
Mortality
Follow-ups have been carried out annually between 1979 and 1994 and bi-annually between 1994 and 2004, so study participation data allowed us to determine the mortality status of the participants with an accuracy of one year before 1994 and with two years after 1994. For participants who have not been interviewed in follow-ups, the reason for non-interview has been recorded (e.g., refusal, unknown location, or deceased). Participants have been recorded as deceased only if the death of the participant has been possible to confirm via a death certificate, an obituary, or other national death records. As we did not have exact data on participant’s date of death, age at death was determined to be the age the participant would have been in the follow-up period in which the participant was first
determined to be deceased. However, some individuals permanently lost to follow-up at some point of the study may have deceased without being recorded as such in the data. For non-deceased participants who were lost to follow-up, the end of study period was
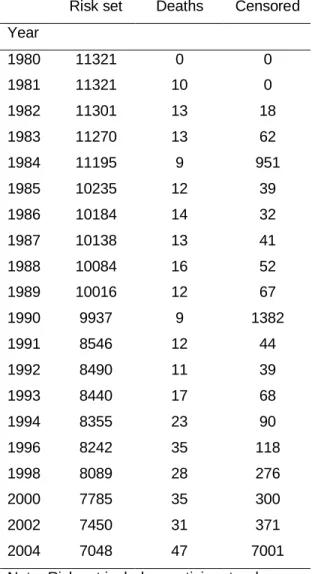
determined by the participant’s age at the latest available interview. Table 1 shows the deaths and censored participants by study year. Of the participants who had data on IQ and other covariates, 360 were recorded as deceased by the end of the follow-up period. Data on the cause of death were not available, so the focus of this study was on all-cause
mortality only. Given that the study has been set up to examine social and economic rather than epidemiological research questions, there were no repeated- measure data of medical risk factors and health behaviors associated with mortality that could have been
incorporated in the present analyses.
IQ
In 1980 the then 16 to 23 year-old participants were administered the Armed Services Vocational Aptitude Battery (ASVAB), which consists of 10 subtests: general science, arithmetic reasoning, word knowledge, paragraph comprehension, numerical operations, coding speed, auto and shop information, mathematics knowledge, mechanical
comprehension, and electronics information (22). Four of the subtests comprise the Armed Forces Qualification Test (AFQT) which includes only the more general, less vocationally-specific tests assessing general cognitive ability, and is calculated from the raw scores by the formula AFQT=arithmetic reasoning + word knowledge + paragraph comprehension + (mathematics knowledge/2). The scale was standardized (M=0, SD=1) in order to facilitate the interpretation of the statistical estimates.
SES indicators
Participant’s SES was assessed on the basis of highest completed education and household income at each follow-up phase. The participants reported their highest completed grade on a 20-point scale (range from 0=no education to 20=8th year of college or more;
mean=12.7, SD=2.4). Household income was assessed on the basis of total net household income from all income sources of the participant and her/his spouse in past calendar year, reported by the participants in each follow-up. The scale was transformed by square root transformation and standardized (mean=0, SD=1).
Covariates
Other characteristics included age, sex, racial/ethnic background, baseline health status, parental education, and marital status.
Racial/ethnic background. In the National Longitudinal Survey of Youth the participants have been categorized into three ethnic/racial groups (Hispanic, Black, and White/other) based on self-reported data (protocol described in section 4.32 of the study user’s guide, ref. 22). This categorization was used in the present analyses. Of the
participants included in the study, 1736 were Hispanic, 2777 were Blacks, and 6808 were White/other.
Baseline health status. At baseline the participants reported whether they had a health problem that limited the kind or the amount of work they were able to do. The participants were mostly healthy at study inception, with 4.8% of the participants reporting a limiting health problem.
Parental education was assessed at baseline in 1979 on the basis of education level of the more educated parent of the participant (range from 0=no education to 20=8th year of college or more; mean=11.7, SD=3.4).
Marital status. Given that marital status is associated with mortality risk (23) and that income level was assessed on the basis of household income (see above), which is
naturally related to marital status, marital status was included as a covariate. Marital status was reported by the participants in each follow-up, and was coded into three categories: never married, married, and separated/divorced/widowed.
Statistical analysis
The associations between IQ and completed education was assessed with 19 separate linear regressions predicting completed education level at each follow-up phase, adjusted for sex, birth year, and race/ethnicity, and using cross-sectional sampling weights. The association between IQ and household income was assessed in the same way, additionally adjusted for marital status. These analyses allowed us to examine whether the association between IQ and SES indicators changed over the follow-up period. The results were illustrated by plotting the standardized regression coefficients of IQ by follow-up phase.
As a preliminary analysis of IQ and mortality, we categorized the participants into low (IQ score below 1 SD of mean), average (IQ within 1 SD of mean) and high (IQ above 1 SD of mean) IQ groups, calculated sample hazard functions, i.e., the probability of dying at a given age, and plotted the corresponding mortality functions, i.e., the probability of dying by a given age, for each group (the 95% confidence intervals were calculated using
Greenwood’s approximation). This analysis provided crude sample mortality rates for the three IQ groups without sample weights or adjustment for covariates.
The association between IQ, SES, and mortality was then assessed with discrete-time survival analysis (24). This analysis allowed us to take into account differences in follow-up period between the participants and to model time-dependent effects, e.g., life-course SES. Discrete-time rather than continuous-time survival analysis was applied due to the rather coarse measure of timing of death (see above). The members of the oldest cohort were 47 years old at the final follow-up phase, so survival analysis allowed us to estimate mortality up to this age. Age was used as the measure of time and given that mortality rate tends to accelerate with age we included linear and quadratic terms of age in all models.
Survival analysis was carried out in four steps. First we assessed how background covariates, SES, and IQ predicted mortality risk when these were examined in separate models. We then entered all covariates in a single model in order to assess the independent effects of IQ and SES. The interaction effect between IQ and age was tested in order to assess whether the influence of IQ on mortality was constant over age or whether this association strengthened or weakened with age. The results of the survival analysis were illustrated by calculating the predicted probability of death by the age of 47 by IQ level (from 2 SD below the mean to 2 SD above the mean).
As a sensitivity analysis, we examined the associations between the four AFQT subscales and mortality separately. We also assessed whether the association between IQ and mortality was moderated by sociodemographic background covariates, i.e., sex, race/ethnicity, and parental education, by testing interaction effects between these covariates and IQ in overall model. These interaction effects were further explored by
fitting the survival models separately by sex, race/ethnicity, and levels of parental education.
The participants reported their education, household income and current marital status in annual or biannual follow-up interviews between 1981 and 2004, which resulted in 19 assessment times. These data allowed us to construct these three covariates as time-varying, i.e., having different values across the follow-up period. All missing values in these variables were replaced by data from the previous year. Other covariates were used as time-invariant, i.e., having a constant value over the follow-up period. Appropriate longitudinal sampling weights were used in the analyses. In addition, some of the participants were from the same households, so not all observations were independent. Robust estimator with household clustering instead of maximum likelihood was therefore used to provide appropriate estimates of standard errors.
Finally, we carried out an attrition analysis by refitting the final survival analysis model of IQ and mortality but by having age at censoring rather than mortality as the outcome. This model was fitted by excluding the deceased participants and by applying the same sampling weights as in predicting mortality. No association between IQ and
censoring suggest loss to follow-up to be an unlikely source of bias. Underestimation is possible if IQ is associated with censoring in a similar way as it is associated with mortality. The risk of overestimation increases if the IQ–censoring association is in the opposite direction than the IQ–mortality association.
RESULTS
First we assessed how IQ predicted education and household income over the follow-up period. As shown by the plotted regression coefficients of IQ in Figure 1, the association between IQ and education increased from =0.51 to =0.69 (all p-values<0.001) between years 1981 and 2004. The coefficients between IQ and household income, in turn,
increased from =0.19 to =0.35 (all p-values<0.001). These patterns indicated that IQ predicted SES more strongly in late than in early adulthood.
[FIGURE 1 HERE, WIDTH 1 COLUMN]
IQ and SES indicators as predictors of mortality
In assessing the association between IQ and mortality, we first calculated and plotted crude mortality rates by IQ groups (Figure 2). Individuals with high IQ had a lower mortality rate than those with low IQ, and by the age of 47 the mortality functions had reached the values of 9%, 6%, and 3% in the low, average, and high IQ groups, respectively, suggesting a three-fold mortality differential between those with above-average IQ and those with below-average IQ.
[FIGURE 2 HERE, WIDTH 1 COLUMN]
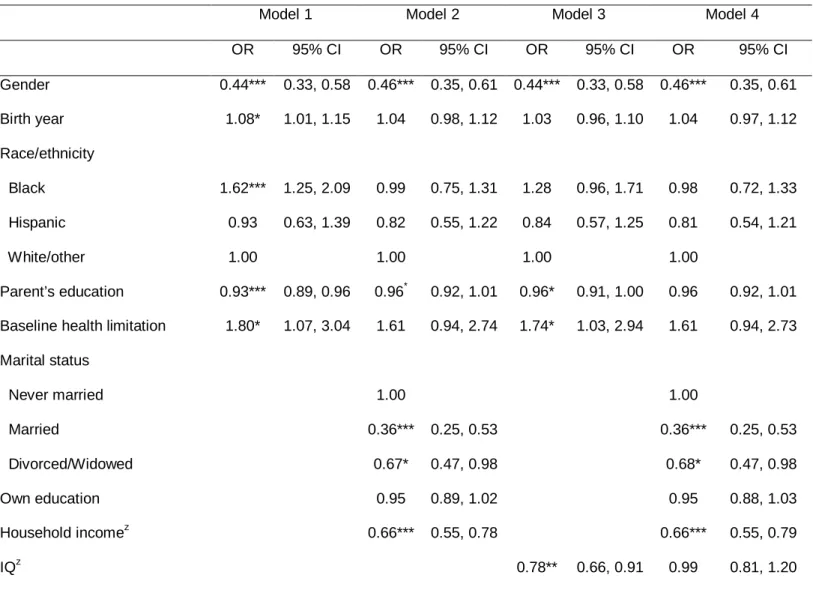
We then modeled the associations between IQ, SES, and mortality using discrete-time survival analysis. Model 1 of Table 2 shows the association between background variables and mortality. Model 2 includes SES indicators and marital status in addition to
background variables. Although participant’s own education predicted decreased mortality when household income was not included in the model (OR=0.88, CI=0.83, 0.93, P<0.001; data not shown in the table), only income was significant when both SES indicators were entered in a single model (model 2). Models 3 and 4 repeated models 1 and 2 but included
IQ as a covariate. When sex, birth year, race/ethnicity, and baseline health status were controlled, IQ predicted decreased mortality risk (OR=0.71, CI=0.62, 0.82, P<0.001; data not shown) and this association was little changed after including parental education in the model (OR=0.78; model 3). The relation between IQ and mortality was attenuated when adjusting for education and marital status in addition to background variables (OR=0.91, CI=0.75, 1.11, P=0.36; data not shown), and disappeared almost completely when further adjusted for household income (OR=0.99; model 4). Adjusting for marital status (but not for SES indicators) did not substantially alter the association between IQ and mortality (OR=0.82, CI=0.70, 0.97, P=0.02; data not shown), indicating that the influence of IQ on mortality risk was largely accounted for by life-course socioeconomic circumstances.
In order to illustrate the effect magnitude of IQ on mortality in terms of percentage points, we calculated the predicted probabilities of death by the age of 47 by IQ level (table 3), adjusted for background variables and parental education (step 1), for education and marital status (step 2), and for household income (step 3). The right-most column of table 3 reproduces the OR:s reported in the paragraph above and in table 2. Given the low absolute mortality probabilities, the OR:s closely equaled to relative risk ratios, i.e., the relative change in probability of death by the age of 47 associated with 1 SD change in IQ.
Sensitivity analyses
We examined interaction effects between age and IQ in order to evaluate whether the influence of IQ on mortality was dependent on age. None of these interaction effects were significant, suggesting that the association between IQ and mortality risk was constant over age. As a sensitivity analysis of the IQ measure, we examined whether different IQ
subscales predicted mortality risk differently. Fitting model 3 of table 2 using standardized IQ subscales (Mean=0, SD=1) rather than the global score indicated that, in separate models, mortality was similarly predicted by arithmetic reasoning (OR=0.84, CI=0.72, 0.99, P=0.04), word knowledge (OR=0.88, CI=0.75, 1.02, P=0.09), paragraph
comprehension (OR=0.80, CI=0.70, 0.92, P=0.04), and mathematics knowledge
(OR=0.85, CI=0.75, 0.97, P=0.02), suggesting that the IQ-mortality association held across cognitive domains.
Next we examined the association between IQ and mortality separately within
different ethnic/racial groups and within men and women. Race/ethnicity × IQ interactions were not statistically significant (p values>0.89), suggesting no differences between racial/ethic groups. IQ predicted mortality in a similar fashion in Hispanic (OR=0.67, CI=0.48, 0.92, P=0.012), Black (OR=0.71, CI=0.57, 0.88, P=0.002), and White/other (OR=0.83, CI=0.66, 1.03, P=0.09) participants. In all groups, adjusting for marital status, education, and household income attenuated the relation between IQ and mortality to a nonsignificant level (Hispanic: OR=0.85, CI=0.57, 1.28, P=0.44; Black: OR=0.96, CI=0.75, 1.24, P=0.75; White/other: OR=1.02, CI=0.88, 1.33, P=0.88) indicating that socioeconomic circumstances mediated the association in all ethnic/racial groups.
The association between IQ and mortality was also similar in men (OR=0.77, CI=0.64, 0.94, P=0.009) and in women (OR=0.78, CI=0.58, 1.05, P=0.11), and this association disappeared when socioeconomic status was controlled for (men: OR=0.99, CI=0.78, 1.26, P=0.94; women: OR=1.00, CI=0.71, 1.39, P=0.98).
Finally, we examined whether the association between IQ and mortality was
model 1 of table 2 (data not shown). This interaction effect was statistically significant (OR=0.95, CI=0.91, 1.00, P=0.05) and suggested that IQ predicted mortality more strongly in participants with higher parental education. To illustrate this we fitted the survival analysis model separately by three levels of parental education (less than completed high school, completed high school, more than high school). IQ was not associated with mortality in the lowest parental education group (OR=0.96, CI=0.74, 1.23, P=0.73; n=3776) but predicted decreased mortality risk in the intermediate (OR=0.69, CI=0.54, 0.87, P=0.002; n=4453) and high (OR=0.71, CI=0.50, 1.01, P=0.06; n=3069) parental education groups.
Attrition analysis
We performed attrition analysis by fitting survival analysis model predicting age at censoring. In interpreting these results, it needs to be kept in mind that certain subsamples were excluded by study design in 1984 and 1990 and that the model was fitted using sample weights correcting for attrition (see method section). Adjusted for age and age squared, drop-out was predicted by birth year (OR=1.89, CI=1.83, 1.95, P<0.001), Black (OR=0.85, CI=0.82, 0.89, P<0.001) and Hispanic (OR=0.88, CI=0.84, 0.93, P<0.001) ethnicity, parental education (OR=0.99, CI=0.98, 1.00, P=0.02), health limitations (OR=0.91, CI=0.85, 0.97, P=0.01), IQ (OR=0.97, CI=0.95, 1.00, P=0.05), marital status (married: OR=1.04, CI=0.98, 1.11, P=0.24; divorced: OR=1.11, CI=1.04, 1.18, P=0.002), and education (OR=1.02, CI=1.01, 1.03, P<0.001) but not by household income (OR=1.00, CI=0.98, 1.02, P=0.95). Thus, the attrition effect of IQ in our analyses was small and, if anything, may have attenuated the estimated association between IQ and mortality, as
some deceased participants with low IQ (and hence with high mortality risk) might have been lost to follow-up rather than having been recorded as deceased in the dataset.
DISCUSSION
The present study provides evidence for the role of IQ in predicting early mortality in the United States. Independently of age, sex, race/ethnicity, baseline health limitations, and parental education, high IQ in young adulthood predicted low mortality risk by the age of 47 years: An IQ one SD above the mean was associated with an approximately 22% decrease in the odds of death. This association was completely mediated by life-course socioeconomic circumstances, i.e., educational level and household income, which were predicted by IQ in the expected way. The IQ-mortality association was similar in Hispanic, Black, and White/other participants and also in men and women.
The main limitation of the study is that the mortality data were based on study participation data, so that individuals permanently lost to follow-up had to be censored at the age of last available interview, because we did not have mortality data for them after drop-out. Although survival analysis takes censoring into account in estimation (i.e., that not all participants are followed through the same period of time), selective attrition may still have biased the mortality estimates. However, we believe that a major attrition bias in this study is unlikely. If anything, the weak associations between IQ and attrition might have served to bias our estimates conservatively.
Another potential limitation of this study is that IQ was assessed in adolescence or young adulthood when the participants had already went through years of education. Thus, we cannot exclude the possibility of reverse causality between IQ and SES, education in
particular. The association between IQ and SES grew stronger with age, suggesting that at least part of the association flowed from IQ to SES rather than the reverse. Namely, the strengthening association between IQ and later SES would be difficult to explain by reverse causality whereas it is plausible that the influence of IQ on SES becomes stronger with age as individuals have more opportunities to attain higher SES.
According to U.S. mortality statistics (25) covering the present study period, the five leading causes of death between ages 16 and 47 were unintentional injuries (32% of all deaths), cancer (18%), cardiovascular disease (14%), suicide (12%) and homicide (9%). Previous studies have associated IQ with unintentional injuries (26-27), suicidal behavior (28), homicide risk (29), and cardiovascular disease (8,11) whereas the IQ–cancer
association has received mixed support (4,7). We did not have cause-specific mortality data, but given the age of the study sample it seems reasonable to assume that a large part of the deaths in the sample were due to non-intentional injuries. This would also be in agreement with the observation that the IQ-mortality association was mediated by SES, because low SES is associated with exposure to hazardous environments and increased risk of non-intentional injuries (30-33). Furthermore, IQ and SES are both known to be
associated with health behaviors (20, 34-39), so part of the SES-mediated influence of IQ on mortality may reflect SES differences in health behaviors.
The present findings add to the cognitive epidemiology literature (13) by showing that the association between IQ and mortality generalizes to populations not studied previously. Previous studies in the United States (10) have not been based on representative samples, and nearly all earlier studies have included only white participants (14). In the present sample IQ predicted early mortality with a similar effect size as has been observed in
previous studies (4-14), suggesting that IQ predicts mortality in a similar fashion in the United States as in European countries, across different racial/ethnic groups, and early and later mortality.
Previous research has found SES to account for the IQ–mortality association only in part whereas we found that life-course socioeconomic circumstances accounted for the IQ-mortality association completely. There are at least three possible reasons for this
difference. First, the differing findings might reflect differences between countries. This explanation is implausible, however, because IQ predicts SES in a similar fashion in the United States as in other western countries (17). Second, we assessed life-course
educational level and household income with 19 assessment times, which provides a more accurate measure of SES and therefore a stronger test of the mediator hypothesis than used in most previous studies. Third, the present study assessed only early mortality up to midlife, whereas some previous studies (4-5) have assessed mortality up to older ages. It is possible that socioeconomic status is more important in mediating early mortality risk than mortality at later ages.
The association between IQ and mortality risk was dependent on parental education. This association was clear in individuals with high parental education but absent in those whose parents had low education. The absence of IQ-mortality association in participants from less educated households may reflect their increased exposure to other mortality risk factors that may override the influence of IQ. Furthermore, behavior genetic studies have shown that genetic factors may be less influential in determining IQ differences in
individuals from families with low rather than with high SES (40-42). Thus, IQ scores in individuals with low parental SES may disproportionally reflect consequences of early
environment rather than their genetic potential influencing the extent to which people are successful in selecting healthy environments and life styles after childhood. Replications of the IQ × parental SES interaction effect and genetically informative studies are needed to assess this hypothesis.
Social disparities in mortality are an important public health issue, but factors explaining such disparities have remained unclear. We found a stronger association between income and mortality than between education and mortality suggesting that material factors are important in social disparities (43). Our findings do not support the hypothesis (12, 20) that socioeconomic disparities in early mortality would reflect IQ differences associated with SES. Adjusting for IQ did not alter the robust association between socioeconomic circumstances and mortality risk, implying that SES was an independent predictor of mortality even when IQ was taken into account. This suggests that reducing socioeconomic inequalities should reduce the mortality differentials associated with IQ differences.
In conclusion, our study of early mortality in the United States suggests that IQ may be one of the factors contributing to early death via its predictive association with lifetime socioeconomic circumstances. SES, in turn, is associated with mortality risk in a manner not confounded by IQ differences associated with SES.
Acknowledgements: ASM was supported by a ‘EURYI’ award from the European
Science Foundation and a ‘Chaire d'excellence’ award from the French Ministry of Research. MK was supported by the Academy of Finland (grants 124322 and 117604).
References
1. Deary IJ, Whiteman MC, Starr JM, Whalley LJ, Fox HC. The impact of childhood intelligence on later life: following up the Scottish mental surveys of 1932 and 1947. J Pers Soc Psychol. 2004;86:130-147.
2. Plomin R, Spinath FM. Genetics and general cognitive ability (g). Trends Cogn Sci. 2002;6:169-176.
3. Gottfredson LS. Why g matters: The complexity of everyday life. Intelligence. 1997;24:79-132.
4. Hart CL, Taylor MD, Davey Smith G, Whalley LJ, Starr JM, Hole DJ, Wilson V, Deary IJ. Childhood IQ, social class, deprivation, and their relationships with mortality and morbidity risk in later life: prospective observational study linking the Scottish Mental Survey 1932 and the Midspan studies. Psychosom Med. 2003;65:877-883.
5. Whalley LJ, Deary IJ. Longitudinal cohort study of childhood IQ and survival up to age 76. BMJ. 2001;322:819.
6. Pearce MS, Deary IJ, Young AH, Parker L. Childhood IQ and deaths up to middle age: The Newcastle Thousand Families Study. Public Health. 2006;120:1020-1026.
7. Batty GD, Wennerstad KM, Smith GD, Gunnell D, Deary IJ, Tynelius P, Rasmussen F. IQ in early adulthood and later cancer risk: cohort study of one million Swedish men. Ann
8. Hemmingsson T, Essen JV, Melin B, Allebeck P, Lundberg I. The association between cognitive ability measured at ages 18-20 and coronary heart disease in middle age among men: A prospective study using the Swedish 1969 conscription cohort. Soc Sci Med. 2007;65:1410-1419.
9. Kuh D, Richards M, Hardy R, Butterworth S, Wadsworth ME. Childhood cognitive ability and deaths up until middle age: a post-war birth cohort study. Int J Epidemiol. 2004;33:408-413.
10. Martin LT, Kubzansky LD. Childhood cognitive performance and risk of mortality: a prospective cohort study of gifted individuals. Am J Epidemiol. 2005;162:887-890. 11. Hart CL, Taylor MD, Smith GD, Whalley LJ, Starr JM, Hole DJ, Wilson V, Deary IJ.
Childhood IQ and cardiovascular disease in adulthood: prospective observational study linking the Scottish Mental Survey 1932 and the Midspan studies. Soc Sci Med.
2004;59:2131-2138.
12. Batty GD, Der G, Macintyre S, Deary IJ. Does IQ explain socioeconomic inequalities in health? Evidence from a population based cohort study in the west of Scotland. BMJ. 2006;332:580-584.
13. Deary IJ, Batty GD. Cognitive epidemiology. J Epidemiol Community Health. 2007;61:378-384.
14. Batty GD, Deary IJ, Gottfredson LS. Premorbid (early life) IQ and later mortality risk: systematic review. Ann Epidemiol. 2007;17:278-288.
15. Gottfredson LS, Deary IJ. Intelligence predicts health and longevity, but why? Curr Dir Psychol Sci. 2004; 13: 1-4.
16. Rowe D, Vesterdal W, Rodgers J. Herrnstein's syllogism: Genetic and shared
environmental influences on IQ, education, and income. Intelligence. 1999;26:405-423. 17. Strenze T. Intelligence and socioeconomic success: A meta-analytic review of
longitudinal research. Intelligence. 2007; 35:401-426.
18. Smith GD, Hart C, Blane D, Gillis C, Hawthorne V. Lifetime socioeconomic position and mortality: prospective observational study. BMJ. 1997; 314:547-552.
19. Mustard CA, Etches J. Gender differences in socioeconomic inequality in mortality. J Epidemiol Community Health. 2003;57:974-980.
20. Gottfredson LS. Intelligence: is it the epidemiologists' elusive "fundamental cause" of social class inequalities in health? J Pers Soc Psychol. 2004;86:174-199.
21. Singh-Manoux A, Ferrie JE, Lynch JW, Marmot M. The role of cognitive ability (intelligence) in explaining the association between socioeconomic position and health: Evidence from the Whitehall II prospective cohort study. Am J Epidemiol.
2005;161:831-839.
22. Center for Human Resource Research. NLSY79 User’s guide: A Guide to the 1979-2004 National Longitudinal Survey of Youth data. Available at
http://www.bls.gov/nls/nlsy79.htm, accessed 13.1.2006.
23. Seeman TE, Kaplan GA, Knudsen L, Cohen R, Guralnik J. Social network ties and mortality among the elderly in the Alameda County Study. Am J Epidemiol.
1987;126:714-723.
24. Singer JB, Willett JB. Applied longitudinal data analysis: modeling change and event occurrence. Oxford, Oxford University Press (2003)
25. Centers for Disease Control and Prevention. Web-based Injury Statistics Query and Reporting System. Available at http://www.cdc.gov/ncipc/wisqars, accessed 1/2008. 26. Osler M, Andersen AM, Laursen B, Lawlor DA. Cognitive function in childhood and
early adulthood and injuries later in life: the Metropolit 1953 male birth cohort. Int J Epidemiol. 2007;36:212-219.
27. Lawlor DA, Clark H, Leon DA. Associations between childhood intelligence and hospital admissions for unintentional injuries in adulthood: the Aberdeen Children of the 1950s cohort study. Am J Public Health. 2007;97:291-297.
28. Gunnell D, Harbord R, Singleton N, Jenkins R, Lewis G. Is low IQ associated with an increased risk of developing suicidal thoughts? : A cohort study based on an 18-month follow-up of the national psychiatric morbidity survey. Soc Psychiatry Psychiatr Epidemiol. In press.
29. Batty GD, Mortensen LH, Gale CR, Deary IJ. Is low IQ related to risk of death by homicide? Testing a hypothesis using data from the Vietnam Experience Study. Psychiatry Res. In press.
30. Turner JV, Spallek M, Najman JM, Bain C, Purdie DM, Nixon J, Scott D, McClure R. Socio-economic distribution of environmental risk factors for childhood injury. Aust N Z J Public Health. 2006;30:514-518.
31. Cubbin C, LeClere FB, Smith GS. Socioeconomic status and injury mortality: individual and neighbourhood determinants. J Epidemiol Community Health. 2000;54:517-524.
32. Whitlock G, Norton R, Clark T, Pledger M, Jackson R, MacMahon S. Motor vehicle driver injury and socioeconomic status: a cohort study with prospective and
retrospective driver injuries. J Epidemiol Community Health. 2003;57:512-516. 33. Gottfredson LS. Innovation, fatal accidents, and the evolution of general intelligence.
In M. J. Roberts (Ed.), Integrating the mind: Domain general versus domain specific processes in higher cognition (pp. 387-425). Hove, UK: Psychology Press, 2007. 34. Hemmingsson T, Kriebel D, Melin B, Allebeck P, Lundberg I. How does IQ affect
onset of smoking and cessation of smoking–Linking the Swedish 1969 Conscription Cohort to the Swedish Survey of Living Conditions. Psychosom Med. In press.
35. Batty GD, Deary IJ, Schoon I, Gale CR. Mental ability across childhood in relation to risk factors for premature mortality in adult life: the 1970 British Cohort Study. J Epidemiol Community Health. 2007;61:997-1003.
36. Batty GD, Deary IJ, Macintyre S. Childhood IQ in relation to risk factors for premature mortality in middle-aged persons: the Aberdeen Children of the 1950s study. J
Epidemiol Community Health. 2007;61:241-247.
37. Adler NE, Boyce T, Chesney MA, Cohen S, Folkman S, Kahn RL, Syme SL. Socioeconomic status and health. The challenge of the gradient. Am Psychol. 1994;49:15-24.
38. Anderson NB, Armstead CA. Toward understanding the association of socioeconomic status and health: a new challenge for the biopsychosocial approach. Psychosom Med. 1995;57:213-225.
39. Hanson MD, Chen E. Socioeconomic status and health behaviors in adolescence: a review of the literature. J Behav Med. 2007;30:263-285.
40. Rowe DC, Jacobson KC, Van den Oord EJ. Genetic and environmental influences on vocabulary IQ: parental education level as moderator. Child Dev. 1999;70:1151-1162. 41. Turkheimer E, Haley A, Waldron M, D'Onofrio B, Gottesman II. Socioeconomic status
modifies heritability of IQ in young children. Psychol Sci. 2003;14:623-628. 42. Harden KP, Turkheimer E, Loehlin JC. Genotype by environment interaction in
adolescents' cognitive aptitude. Behav Genet. 2007;37:273-283.
43. Davey Smith G, Hart C, Hole D, MacKinnon P, Gillis C, Watt G, Blane D, Hawthorne V. Education and occupational social class: which is the more important indicator of mortality risk? J Epidemiol Community Health. 1998;52:153-160.
Table 1. Life table of the sample by study years.
Risk set Deaths Censored Year 1980 11321 0 0 1981 11321 10 0 1982 11301 13 18 1983 11270 13 62 1984 11195 9 951 1985 10235 12 39 1986 10184 14 32 1987 10138 13 41 1988 10084 16 52 1989 10016 12 67 1990 9937 9 1382 1991 8546 12 44 1992 8490 11 39 1993 8440 17 68 1994 8355 23 90 1996 8242 35 118 1998 8089 28 276 2000 7785 35 300 2002 7450 31 371 2004 7048 47 7001
Note: Risk set includes participants who were alive and for whom data on mortality status were available. Participants were censored due to study drop-out and funding constraints limiting the number of
Table 2. Predicting mortality risk by IQ and sociodemographic covariates. Odds ratios (95% confidence intervals) from nested discrete-time survival analyses (n=11321).
Model 1 Model 2 Model 3 Model 4
OR 95% CI OR 95% CI OR 95% CI OR 95% CI Gender 0.44*** 0.33, 0.58 0.46*** 0.35, 0.61 0.44*** 0.33, 0.58 0.46*** 0.35, 0.61 Birth year 1.08* 1.01, 1.15 1.04 0.98, 1.12 1.03 0.96, 1.10 1.04 0.97, 1.12 Race/ethnicity Black 1.62*** 1.25, 2.09 0.99 0.75, 1.31 1.28 0.96, 1.71 0.98 0.72, 1.33 Hispanic 0.93 0.63, 1.39 0.82 0.55, 1.22 0.84 0.57, 1.25 0.81 0.54, 1.21 White/other 1.00 1.00 1.00 1.00 Parent’s education 0.93*** 0.89, 0.96 0.96* 0.92, 1.01 0.96* 0.91, 1.00 0.96 0.92, 1.01 Baseline health limitation 1.80* 1.07, 3.04 1.61 0.94, 2.74 1.74* 1.03, 2.94 1.61 0.94, 2.73 Marital status Never married 1.00 1.00 Married 0.36*** 0.25, 0.53 0.36*** 0.25, 0.53 Divorced/Widowed 0.67* 0.47, 0.98 0.68* 0.47, 0.98 Own education 0.95 0.89, 1.02 0.95 0.88, 1.03 Household incomez 0.66*** 0.55, 0.78 0.66*** 0.55, 0.79 IQz 0.78** 0.66, 0.91 0.99 0.81, 1.20
Note: *** p<0.001, ** p<0.01, * p<0.05;z standardized ORs (Mean=0, SD=1) All models adjust for Age and Age2 for the passage of time
Table 3. The probability of death (%) by the age of 47 by IQ level. Predictions from discrete-time survival analysis models (n=11321).
IQ -2 SD -1 SD Mean +1 SD +2 SD OR Step 1 9.0 7.1 5.5 4.3 3.4 0.78 Step 2 5.7 5.2 4.8 4.4 4.0 0.91 Step 3 4.7 4.6 4.5 4.5 4.4 0.99
Note: Given the relatively low absolute percentage points, the OR:s also provide an approximate relative risk of death by the age of 47 associated with 1 standard deviation change in IQ, i.e., RR p(+1 SD)/ p(Mean).
Step 1 adjusts for sex, birth year, race/ethnicity, baseline health, and parental education Step 2 adjusts for step 1 + marital status and own education
Step 3 adjusts for step 2 + household income See table 2 for statistical details
FIGURES 0 0.1 0.2 0.3 0.4 0.5 0.6 0.7 0.8 1981 1984 1987 1990 1993 1998 2004 Follow-up Year S tandardi z ed c oeff ic ient of IQ Education Household income Dependent variable
Figure 1. Predicting participants’ education level and household income over the follow-up period by IQ assessed in 1980. The figure plots the standardized regression coefficients of IQ in linear regression analyses predicting education and household income separately at each follow-up phase.
0.00 0.02 0.04 0.06 0.08 0.10 17 22 27 32 37 42 47 Age C um ula tiv e m or ta lity Low IQ Average IQ High IQ
Figure 2. Sample mortality functions, i.e., cumulative probability of dying by a given age, by IQ group (low=below 1 SD of mean, average=within 1 SD of mean, high=above 1 SD of mean). For clarity, the 95% confidence intervals are shown only for the high and low groups.