The Influence of Product Aesthetics and Usability over the Course of
Time: A Longitudinal Field Experiment
Andreas Sonderegger
a, Gerold Zbinden
a, Andreas Uebelbacher
a, and
Juergen Sauer
a aDepartment of Psychology, University of Fribourg, Fribourg, Switzerland
Corresponding Author’s Contact Informationa: [email protected]
University of Fribourg, Department of Psychology Rue de Faucigny 2
1700 Fribourg, Switzerland Phone: +41-26-300-7630 Fax: +41-26-300-9712
Abstract
A longitudinal field experiment was carried out over a period of two weeks to examine the influence of product aesthetics and inherent product usability. A 2 x 2 x 3 mixed design was used in the study, with product aesthetics (high / low) and usability (high / low) being manipulated as between-subjects variables and exposure time as a repeated-measures variable (3 levels). A sample of 60 mobile phone users was tested during a multiple-session usability test. A range of outcome variables was measured, including performance, perceived usability, perceived aesthetics, and emotion. A major finding was that the positive effect of an aesthetically appealing product on perceived usability, reported in many previous studies, began to wane with increasing exposure time. The data
provided similar evidence for emotion, which also showed changes as a function of exposure time. The study has methodological implications for the future design of usability tests, notably suggesting the need for longitudinal approaches in usability research.
Practitioner Summary
This study indicates that product aesthetics influences perceived usability considerably in one-off usability tests but this influence wanes over time. When completing a usability test it is therefore advisable to adopt a longitudinal multiple-session approach to reduce the possibly undesirable influence of aesthetics on usability ratings.
1. Introduction
Usability tests are an essential tool in the domain of human-centred development of interactive products. Their aim is to ensure the development of products that are efficient, effective, satisfactory, and pleasurable to use. To verify to what extent these multiple goals have been achieved, a range of measures are taken during a usability test. These do not only include objective parameters like user error and task completion time but also subjective ones, such as perceived usability and user emotion. While the main goal of a usability test is to determine whether the product is usable in the context that it has been designed for, there is increasing evidence that the outcome measures of
usability tests may be affected by factors other than the inherent (or objective) usability of the product (Nielsen and Levy, 1994, Frøkjær et al., 2000). A set of such factors that are thought to have an undesired impact on outcome measures has been identified, including expertise of the test facilitator (Herztum and Jacobsen, 2001), aesthetics (Tractinsky et al., 2000), and observer presence (Sonderegger and Sauer, 2009). For example, such empirical work revealed that observers being present in a usability laboratory may increase participant stress and may even affect participant performance.
The demonstrated impact of such factors raises the important question to what extent the reported influences may be due to methodological artefacts. Most usability research made use of one-off tests that took measures in a very early phase of user-product interaction. Such single-session testing may not be appropriate because they may not model real user-product interaction sufficiently well, which may in turn affect test outcomes. In contrast, a longitudinal study involving multiple-session testing is expected to represent a more valid modelling of real usage scenarios. This
methodological issue will be addressed in the present article by examining the impact of two factors on the outcomes of usability testing as a function of extended testing:
inherent usability and product aesthetics.
1.1. A Longitudinal Approach to Usability Testing
It has been argued that stronger temporal aspects need to be considered in usability testing (e.g. Forlizzi and Battarbee, 2004). In a usability test, participants are typically unfamiliar with the evaluated product, that is, the results of usability tests provide information about the first phase of user-product interaction but do not take into account how user-product interaction changes over time.
There is some work that suggests that user-product interaction and user
experience are subject to change during product use. Based on a qualitative study using retrospective interviews, Karapanos et al. (2009) identified three different phases of product use that lasted between one and three weeks: orientation (user’s first experience with the product), incorporation (integration of the product into the user’s daily life), and identification (product becomes part of the user’s self-identity). In each of the three phases, particular product qualities are appreciated by users. In the orientation phase, important product characteristics are learnability and aesthetic stimulation (e.g. ‘my first impression when I saw the box was WOW, very nice’). In the incorporation phase, aspects such as long-term usability (e.g. ‘when I wear gloves, I am not able to work with the product’) and usefulness (e.g. ‘I could not believe it but it had no zoom!’) become more important to users. In the identification phase, personal and social aspects
of the product experience gain in importance (e.g. ‘I felt good about having a better device than my colleagues’). To our knowledge, this model is the only stage model that has been proposed in the context of interactive product usage, distinguishing between several phases.
There are a small number of studies in the literature that examined the effects of operating a product during various phases of product use. For example, a study (N = 10) showed that during the first week of operating an interactive TV set-top box, aspects of the product such as perceived utility and ease of use mainly influenced the overall evaluation of the product, whereas after four weeks, the users’ identification with the product became the primary predictor of its perceived usability (Karapanos et al., 2008). Another study (N = 8), examined change in user-product relationship among expert users of mobile phones, using a post-usage interview technique (von Wilamowitz-Moellendorff et al., 2006). This work showed considerable differences between users in the perception of product quality over time, in that some users reported improvements, others perceived deteriorations, and a third group of users found product quality to be stable. In a study (N = 10) lasting five days, a mouse pointer operated by acoustic gestures was evaluated (Sporka et al., 2007). It emerged that performance, satisfaction and confidence increased over time whereas frustration and fatigue decreased. Similar results were obtained by a study (N = 7) that evaluated an electronic patient record system for a hospital at system launch and 15 months later (Kjeldskov et al., 2010). While user performance increased over time, level of frustration and overall task load decreased after 15 months of usage experience. However, the number and severity of usability problems reported did not differ between the two times of measurement. In a diary study over eight weeks (N = 32), teachers using a webpage design software reported more user errors and higher levels of frustration in the first two weeks
compared to the last six weeks of usage (Mendoza and Novick, 2005). On the basis of their findings, the authors of that study have questioned the utility of the traditional single-session approach to usability testing.
Further (though more indirect) support for time-based changes during user-product interaction stems from work on the effect of using novices or experts in usability testing (i.e. using novices is analogue to single-session usability testing while using experts is analogue to a later-phase of longitudinal usability testing). The work suggests that such differences in user expertise may not be without effect. For example, Dillon and Song (1997) reported for a database search task that experts performed faster and with fewer errors than novices. Other work showed that experts reported a larger number of usability problems than novices when using a floor scrubber (Sauer et al., 2010). These studies suggest that with increasing experience during product usage user behaviour may be subject to changes, which reiterates the need to examine changes in the process of product usage over time.
Overall, there is considerable evidence in the work reviewed that over the course of time there are changes in user behaviour, perceived usability and emotion. However, these studies are characterized by an absence of objective performance measures, and many of them only used a rather small sample size. Furthermore, there has been a lack of experimental research, with most work representing correlational studies using questionnaires for retrospective data collection. This point is important since lack of sound experimental work, makes it difficult to establish causal links. Finally, the low usage of long-term research methods in the field of human factors was demonstrated in a review article by Hornbæk (2005). It revealed that out of 180 studies examined, only in about 7% of them, the duration of human-machine interaction exceeded 5 hours while the average duration was a modest 30 minutes.
1.2 Product Aesthetics
In contrast to the methodological issues addressed in the previous section, the influence of a product’s aesthetic appeal on the results of a usability test has been rather well researched. This applies in particular to the effects of aesthetic appeal on perceived usability, providing considerable support for a positive effect in that more attractive products are also considered to be more usable (e.g. Ben-Bassat et al., 2006,
Sonderegger and Sauer, 2010). Several explanations have been put forward to address the influence of aesthetics on measures of usability, such as the common method bias (Podsakoff et al., 2003) or the processing fluency theory (Reber et al., 2004, c.f. Thielsch and Hirschfeld (in press) for an elaborate discussion). The halo effect is however the explanation most often referred to when discussing the correlation of design aesthetics and usability ratings (e.g. Sutcliffe et al., 2008, Tractinsky et al. 2000). It describes the phenomenon that specific salient characteristics of a product (or a person) bias the perception of other less salient characteristics. In usability tests, design aesthetics represents an obvious and highly accessible product characteristic that is usually very rapidly discerned during user-product interaction (i.e. in about 50 ms according to Lindgaard et al., 2006). In contrast, aspects of inherent product usability are less salient and the user may require some experience of operating the product to identify them.
Concerning the effects of aesthetic appeal on performance, the literature provides a rather inconsistent picture. The studies can be assigned to three categories: those that found a performance increase when a product was aesthetically appealing (Moshagen, et al., 2009, Sonderegger and Sauer, 2010), those that found a performance decrease when a product was aesthetically appealing (Ben-Bassat et al., 2006, Sauer and Sonderegger, 2009), and those that found no effect on performance at all (Chawda et al., 2005, Hartmann et al., 2007, Thüring and Mahlke, 2007). As it can be seen, there are a similar number of studies appearing in each category. Since very little is known about the processes that lead to the reported findings, it is not clear yet how aesthetics influence user performance and what the factors are that moderate such an influence. It has been suggested that user emotion may moderate the association between aesthetics and performance (Moshagen et al., 2009, Thüring and Mahlke, 2007). Despite the considerable amount of work having examined the influence of aesthetics, all studies referred to share the features of having adopted a single-session measurement of
usability rather than a longitudinal approach. This raises the important question to what extent the observed effects will remain stable over time. The influence of aesthetics may wane over time as other features of the product become more prominent (e.g. hidden features such as inherent usability may gain in relative importance over immediately visible features such as aesthetics).
1.3. Inherent Usability
Similar to product aesthetics, inherent usability also represents a product feature of which the effects in usability tests may change over time. As one of the less accessible product features, inherent usability may gain in importance over time as users only become gradually aware of the product’s functionalities. While inherent usability can be defined as an intrinsic characteristic of a product in terms of features and attributes that make a product usable, the term usability refers to the context, in which a product is used (users, tasks and environment) and the characteristics of a product itself (Bevan, 2001). This means that inherent usability represents a product-centred view of usability,
which differs from the general definition of usability that adopts an interactionist perspective and can be described as the ‘the extent to which a product can be used by specified users to achieve specified goals with effectiveness, efficiency and satisfaction in a specified context of use’ (International Organization for Standardization [ISO] 9241-11, 1998, p. 8). To assess the inherent usability of a product in a specific usage context represents the actual purpose of a usability test. Inherent usability is to be considered a multi-facetted concept since it refers to a large number of different aspects (e.g., system response time, error tolerance, consistency). There are a number of
classification systems in the research literature that endeavour to list and categorize these different aspects of usability. For example, the International Standardization Organization defines seven ergonomic principles that are also relevant to the design of interactive products: suitability for the task, suitability for learning, suitability for individualization, conformity with user expectations, self-descriptiveness,
controllability, and error tolerance (ISO 9241-10, 2003). In another, more elaborate classification system, a distinction between 48 usability dimensions (grouped into six higher-level dimensions) is made (Han et al., 2001). These include dimensions such as consistency, controllability, adaptability, and efficiency.
There is considerable research that addressed the effects of the many dimensions of inherent usability, primarily using performance measures and subjective ratings of usability to assess the impact of deficiencies in inherent usability. For example, studies showed decrements of user performance with increasingly poor inherent usability (e.g., Shneiderman, 1998, Szameitat et al., 2009). Negative effects of inadequate inherent usability were not limited to objective performance measures but also extended to reduced user satisfaction (Ben-Bassat et al., 2006, Moshagen et al., 2009), negative emotion (Thüring and Mahlke, 2007), and even resulted in psychophysiological stress responses (Thüring and Mahlke, 2007).
Concerning the effects of poor inherent usability, the findings reported above largely stem from studies using single-session usability testing. At the beginning of this section, it has been suggested that the magnitude of the effects of inherent usability may increase over time because users gain more experience with the different functionalities of the product. However, it is also possible that the magnitude of these effects decreases over time because users find ways of working around poor inherent usability by using compensatory strategies (e.g. users may compensate for a poor menu structure by using shortcut buttons). Such observations have been made in work environments (e.g., Hockey, 1997) and they may also occur during the operation of interactive consumer products. Therefore, the direction the effect will take needs to be empirically examined. 1.4. Present Study
The goal of this longitudinal field experiment was to determine the influence of two important factors in usability testing (i.e. aesthetic appeal and inherent usability of a product) under highly realistic usage conditions. These realistic usage conditions involve (a) the modelling of a usage phase that goes beyond a one-off usability test limited to a single day, (b) the setting of the usability test in the user’s natural usage environment, and (c) the measurement of performance on standardized tasks rather than relying on perceived usability indices that are largely based on self-selected tasks.
These goals were achieved by providing study participants with a mobile phone that they were expected to use as their only mobile communication device during the course of the study. They received instruction by text message to complete certain tasks at regular intervals, which allowed for a standardized measure of performance. In
addition, they were also allowed to employ the mobile phone for their personal use. Furthermore, they were reminded by text message to complete questionnaires at pre-defined intervals to measure perceived usability, attractiveness and emotion. This experimental set-up aimed to obtain a comprehensive measure of user response to the artefact while, at the same time, to maximize experimental control within the user’s natural usage environment. The methodological approach described is based on the method of ambulatory assessment, originally developed for use in clinical psychology (e.g. Fahrenberg et al., 2007). It aims to avoid the methodological problems associated with a retrospective approach by using mobile technology to collect data in a person’s environment. It shares some elements with the (electronic) diary method which also measures self-report data in a person’s natural environment. The ambulatory assessment method is however not limited to self-report data but also includes psychophysiological and behavioural data and may involve psychological testing. The use of standardized tasks for performance testing was also a critical aspect of the methodological approach used in the present study, supplemented by a range of self-report data.
Of the many usability dimensions proposed in the literature, readability was manipulated in the present study. This refers to the ease with which the information presented on the mobile phone could be read by the user. This was manipulated together with aesthetics. Aesthetic appeal was varied with regard to the colour design of casing and display background of the mobile phone.
The following hypotheses were put forward. (a) It was predicted that a higher aesthetic appeal of the device would lead to higher usability ratings and more positive emotions than a less aesthetically appealing device but with increasing exposure time, the influence of aesthetics on perceived usability and emotions would diminish in magnitude (i.e. interaction aesthetics x exposure time). (b) It was predicted that aesthetic appeal of the device would also affect performance (but it was not specified whether positively or negatively), though with increasing exposure time, the size of the effect would become smaller. (c) It was predicted that reduced inherent usability would impair performance, lead to decreased usability ratings and negatively affect user emotion but with increasing exposure time, any such influences would wane. 2. Method
2.1. Participants
Sixty participants (52% female), between the ages of 17 and 43 yrs (M = 24.2, SD = 4.35) took part in this study. All participants were students, recruited at University of Fribourg, with all of them being regular users of mobile phones. A strict selection criterion was that participants were not familiar with the mobile phone used in the study. Participants received CHF 30 (about € 25) for taking part, which was also meant to cover the phone charges that incurred during the study (about CHF 10).
2.2. Experimental Design
A 2 x 2 x 3 mixed design was employed in the study. Design aesthetics of the appliance was manipulated as a between-subjects variable at two levels: highly appealing vs. moderately appealing (see 2.4.1). The second independent variable, inherent usability of the appliance, was varied between subjects at two levels: highly usable vs. moderately usable (see 2.4.1). The third independent variable, exposure time, was varied within subjects at three levels. The three measurement points refer to the beginning of the
study (t0), the first week (t1), and the second week (t2).
2.3. Measures and Instruments 2.3.1. User Performance
Two measures of user performance were recorded: (a) Task completion rate refers to the percentage of participants that were able to complete the task within 5 min. (b) Task completion time (s) indicated the time needed to complete the task successfully. User performance was measured at the first evaluation session and seven times during the product evaluation period (i.e. every other day, test participants were asked to complete one task).
2.3.2. Perceived Usability
Several measures of perceived usability were taken during the two-week period of product evaluation. The instruments were chosen with regard to their match to the theoretical concepts to be measured as well as their brevity. Questionnaires used in diary studies need to be rather short to ensure that participant motivation is maintained during a prolonged evaluation period (Bolger, Davis & Rafaeli, 2003).
Since no short questionnaire measuring perceived usability for diary studies was available, the authors developed their own instrument covering the concepts of
satisfaction, fun of use and user-friendliness with one item each. The questionnaire (which is named hereafter ‘usability diary) contains the following items: (a) ’I am satisfied with the mobile phone’, (b) ‘It is fun to use the mobile phone’, and (c) ‘The operation of the mobile phone is user-friendly’. The items had a 7-point Likert scale as a response format (strongly agree, agree, partly agree, neither agree nor disagree, partly disagree, disagree, strongly disagree). The usability diary was administered twice a day during the two-week period of product evaluation.
Perceived usability was also measured three times during the evaluation period (at day 1, day 6 and day 13) with a German version of the Post Study System Usability Questionnaire (PSSUQ; Lewis, 2002). The PSSUQ represents a standard instrument to measure perceived usability in usability tests, comprised of three subscales with 6 items each: (a) system usefulness (item example: ‘It was simple to use this mobile phone’), (b) information quality (item example: ‘The information provided by this mobile phone was clear’), and (c) interface quality (item example: ‘The interface of this mobile phone was pleasant’). The questionnaire items are rated on a seven-point Likert scale (0 = strongly disagree; 6 = strongly agree). To improve comprehensibility, items were adapted to the appliance it was used for (e.g., ‘system’ was replaced by ‘mobile phone’). The psychometric properties of the PSSUQ are very good, with the following reported coefficients for the different subscales: system usefulness (α = .96), and information quality (α = .91), interface quality (α = .91; Lewis, 2002). In addition, different studies addressing the validity of the PSSUQ showed high correlations with other measures of user satisfaction as well as with objective measures of usability such as task completion rate (Lewis, 2002). In the present study, the three subscales are analysed separately to reflect the different aspects of perceived usability that each of them measures.
2.3.3. Perceived Aesthetics
To measure perceived aesthetics, two subscales of the ‘User Experience Scale’ developed by Lavie and Tractinsky (2004) were translated into German: classic aesthetics (item example: ‘Clean design’) and expressive aesthetics (item example: ‘Creative design’). They were administered three times during the evaluation period (day 1, day 7, day 14). The other subscales of the questionnaire, usability (item example: ‘Easy to use’), pleasurable interaction (item example: ‘Feel joyful’), and service quality (item example: ‘Can count on mobile phone’), were not included here since they do not measure perceived aesthetics but rather aspects of perceived usability, which was already covered by the PSSUQ. Each subscale contains 5 items that had to be rated on a 7-point Likert scale (0 = strongly disagree; 6 = strongly agree). Each item consists of an adjective describing the design of the product. Originally developed for the evaluation of web sites, the items were slightly modified to make them sound more relevant to the model product (e.g., ‘web page’ was replaced by ‘mobile phone’). The psychometric properties of the instrument are good, with a high internal consistency reported for both subscales: classic aesthetics (α = .85) and expressive aesthetics (α = .87; Lavie and Tractinsky, 2004). Investigations into scale validity indicated the two factor structure as well as high correlations to a measure of pleasure as an indicator for convergent validity and moderate correlations to usability-measures as indicators for divergent validity.
2.3.4. Emotion
User emotions were measured twice a day by a short scale (named hereafter ‘emotion diary’), which was developed for diary studies (Wilhelm and Schoebi, 2007). While the original instrument was described as a mood scale, it is now referred to as an emotion diary because it is conceptually based on a three-dimensional model of emotion and it relies on a self-assessment of affective state at a specific moment in time (e.g. directly following task completion). The scale assesses distinct dimensions of emotions with two bipolar items each, based on a theoretical model in which valence (ranging from unpleasant to pleasant), tension (ranging from relaxed to restless), and energetic arousal (ranging from tired to awake) form the three basic dimensions of emotion (see also Russel and Mehrabian, 1977 as an example of a three-dimensional emotion model). Please note that the term ‘tension’ was used in the present article instead of the term ‘calmness’, originally proposed by Wilhelm and Schoebi (2007). This involved a reversal of the scale. Participants were asked to rate six items that were presented in the following order: ‘At this moment, I feel …’ tired-awake (arousal), content-discontent (valence), agitated-calm (tension), full of energy-without energy (arousal), unwell-well (valence), and relaxed-tense (tension). Each item was rated on a 7-point bipolar Likert scale. The authors of the instrument reported satisfactory coefficients for internal
consistency (α = .76 for valence and calmness, and α = .80 for energetic arousal), but no validity coefficient are yet available (Wilhelm and Schoebi, 2007).
2.4. Experimental Manipulation of Mobile Phone
A mobile phone (SonyEricssonTM C702 Speed Black) was used as a model product for the usability test. At the time of completing the study, this appliance was new on the market and therefore hardly known among prospective participants.
2.4.1. Inherent Usability
The inherent usability of the mobile phone was manipulated by changing the colour of the display and by removing the text labels of the menu icons. Both measures aimed to reduce the usability of the device.
Changing the colour of the display (i.e. text and icons) affected the readability of the display since it modified the contrast between display background and the presented information. Contrast can be defined as the difference in luminance (ΔY) between two colours (e.g. luminance of background – luminance of text; Bailey, 1993). The
background of the display used in the present study comprised three horizontal bands of different colours with a luminance of Y = 0.58 for the upper band, Y = 0.39 for the middle band, and Y = 0.44 for the lower band. For the highly readable display, text and icons were designed in white colour (Y = 0), whereas they were designed in grey colour (Y = 0.48) for the poorly readable display. Contrasts of the highly readable display were therefore between ΔY = 0.39 and ΔY = 0.58 (i.e. luminance for upper band minus luminance for white colour). For the poorly readable display, contrasts were much lower and ranged from ΔY = 0.09 to ΔY = 0.10 (i.e. luminance for upper band minus luminance for grey colour). These contrasts were well beneath the threshold of ΔY = 0.25, below which contrasts are to be considered as poor (Bailey, 1993).
As a second means to reduce the mobile phone’s inherent usability, the text labels of the icons in the main menu were removed. Users of the moderately usable phone therefore had to navigate through the menu receiving only information in graphical form whereas users of the highly usable phone also received descriptive text (e.g. icon of an envelope was complemented by the text label ‘messages’).
2.4.2. Design Aesthetics
Empirical research found that the aesthetic appeal of a user interface is influenced by factors such as clearness, symmetry and colour setting influence (e.g., de Angeli et al., 2006). To manipulate aesthetics in the present study, we chose to vary the colour of the display background and of the casing, drawing upon a model of colour harmony
proposed by Liedl (1994).
In order to manipulate the display background, the three horizontal bands (see also 2.4.1) were changed such that they differed in aesthetic appeal but not in luminance (as this would have affected the readability of the display). A disharmonious colour combination consisting of magenta, amber and green was chosen for the product with moderate aesthetic appeal. For the display of the highly aesthetic product, a harmonious colour combination was chosen, comprising the colours turquoise, cyan and blue. The two display designs are shown in figure 1. The contrast between text and background was the same for the aesthetic and the unaesthetic version (i.e. ΔY = 0.58 for both magenta and turquoise, ΔY = 0.39 for amber and cyan, and ΔY = 0.44 for green and blue).
The design of the casing was manipulated by adding a masking tape. For the version with moderate aesthetic appeal, the three disharmonious colours (i.e. magenta, amber and green) were printed on the masking tape whereas for the aesthetic version, the masking tape was printed in black. The designs of the two casings are displayed in figure 1.
Figure 1:Two versions of mobile phone: (a) aesthetically unappealing design and (b) aesthetically appealing design.
2.5. User Tasks
The tasks were formulated as questions that had to be answered by the test participants by using the mobile phone. Altogether, test participants completed the following nine tasks:
(1) Please enter the correct date.
(2) Please change the signal for incoming text messages to melody #5.
(3) In the calendar function, every day of week is represented by a different colour. What is the colour for Sunday?
(4) If you travelled to Almaty today, by how many hours would you need to adjust your clock?
(5) How many emergency phone numbers are already stored in your phonebook? (6) Which standard for photographs can be chosen besides the standards VGA, 1
MP and 3 MP?
(7) How much of your mobile’s memory is taken up by the video ‘Space’? (8) How many clipart images can you choose from in the folder ‘entertainment’? (9) How long did your last phone call last?
The selection of tasks was guided by a number of criteria. First, we chose tasks that covered a broad range of the device’s menu structure to ensure that many of its different functions would be evaluated. Second, a task should not be one of the typical high frequency tasks (e.g. sending a text message, making a phone call), which participants would usually complete when using a mobile phone. Third, task difficulty was chosen such that extreme levels were avoided (e.g., participants should normally not take more than 5 min to perform the task). Fourth, it should not be possible to carry out the task by using a shortcut to ensure that all participants completed the task in the same way. 2.6. Procedure
The first part of the study was conducted in a usability laboratory at the University of Fribourg. Each participant was randomly assigned to one of the four experimental conditions. The experimenter welcomed the participants and explained to them that the
purpose of the study was to determine the usability of a mobile phone during a two-week evaluation phase. Participants were told that during those two two-weeks they should only use the mobile phone that was to be evaluated. They were then asked to install their subscriber identity module (SIM) card on the new mobile phone and to set up the Wireless Application Protocol (WAP) internet connection. If necessary, the
experimenter assisted the participants in these tasks. The experimenter then explained the detailed experimental procedure to the participants. Special emphasis was placed on using the built-in stop watch of the mobile phone for measuring task completion time when carrying out the tasks. Furthermore, it was stressed that the different
questionnaires should be completed with care, using the internet browser of the mobile phone via WAP. After ensuring that participants had a good understanding of these applications, they were asked to complete the first two user tasks. For each task, they should enter the solution and completion time into a WAP page. Then, they were asked to complete the PSSUQ and the perceived aesthetics scale, using again the WAP browser of the mobile phone. At the end, the experimenter assisted the test participants with the transfer of all their personnel settings and contacts to the new phone and reminded them that they were not allowed to personalize the settings of the mobile phone (e.g. changing the background image). Test participants then had the possibility to ask questions and they were reminded that they could always contact the
experimenter by text message or a phone call if needed (the experimenter’s phone number was stored in the directory of the mobile phone). Finally, further equipment (i.e. charging unit, USB cable, and earphones) was handed out to the test participants who then left the usability laboratory. An overview of the different activities carried out by participants is provided in table 1.
Table 1: Overview of procedure (Please note that tasks 3 to 9 were allocated to each participant in a different order; PSSUQ: Post-study system usability questionnaire). Time
Activity
Day 1 Task 1, task 2, usability diary (2x), emotion diary (2x), PSSUQ, aesthetics scale Day 2 Task 3, usability diary (2x), emotion diary (2x)
Day 3 Usability diary (2x), emotion diary (2x) Day 4 Task 4, usability diary (2x), emotion diary (2x) Day 5 Usability diary (2x), emotion diary (2x) Day 6 Task 5, usability diary (2x), emotion diary(2x) Day 7 Usability diary (2x), emotion diary (2x), PSSUQ
Day 8 Task 6, usability diary (2x), emotion diary (2x), aesthetics scale Day 9 Usability diary (2x), emotion diary (2x)
Day 10 Task 7, usability diary (2x), emotion diary (2x) Day 11 Usability diary (2x), emotion diary (2x) Day 12 Task 8, usability diary (2x), emotion diary (2x) Day 13 Usability diary (2x), emotion diary (2x), PSSUQ
Day 14 Task 9, usability diary (2x), emotion diary (2x), aesthetics scale
In the second part of the study, test participants received a text message during the two-week field evaluation phase every morning at 10 am and every evening at 7 pm, containing instructions about what they were expected to do (e.g. completing a
questionnaire, carrying out a task). Furthermore, test participants had the possibility of reporting problems that they encountered during use of the mobile phone. Additionally, every other day test participants received a text message, containing the request to complete a certain task. They were asked to enter the solution of each task on a WAP
page, together with the time they needed for task completion. The tasks (see also 2.5) have been presented to each user in a different order to ensure that differences in task difficulty are balanced out. After task completion, they filled in the emotion diary. On two occasions during field testing, test participants were asked to complete the PSSUQ (days 6 and 13) and the perceived aesthetics scale (days 7 and 14).
After the two-week field evaluation phase, test participants returned the mobile. Finally, the mobile phone was reset to delete all personal data.
2.7. Data Analysis
The data of the repeated-measures variable exposure time were analysed at three levels, that is, at the beginning of the study (t0), during the first week of field testing (t1), and
during the second week (t2). User performance and user emotion were measured more
than three times during the course of the study. The data points of these variables were aggregated and a summary score was calculated for each of the three testing periods. Furthermore, age and gender were entered as covariates into the data analysis. Age showed a significant main effect on all usability subscales as well as on the two
subscales of perceived aesthetics whereas no effect was observed for gender. However, the results of the covariates are not reported in detail because the influence of age and gender in usability tests was no central question for this piece of research. The
experimental groups did not differ with regard to mean of age (M U+ A+ = 24.3; M U+ A- =
23.0; M U- A+ = 27.1; M U- A- = 24.5; F < 1). The gender distribution across experimental
groups was as follows: M U+ A+ = 53% female; M U+ A- = 60% female; M U- A+ = 40%
female; M U- A- = 53% female.
When the assumption of sphericity was violated in the analysis of variance, the Greenhouse-Geisser correction was used. The alpha level was set to 5%.
3. Results
3.1. Perceived Usability
3.1.1. Post-Study Usability Questionnaire
A MANCOVA was carried out, entering time, inherent usability and design aesthetics as independent variables and the three subscales of the PSSUQ as dependent variables. The analysis revealed an interaction between time and aesthetics to be significant (F= 2.40; df = 6, 49; p < .05) and a marginally significant effect for the influence of
aesthetics (F= 2.43; df = 3, 52; p = .075). Since none of the other effects were found to be significant, only these two effects were subsequently tested by separate ANCOVAs for each of the three PSSUQ subscales.
3.1.2. Information quality
The manipulation of inherent usability led to higher ratings for the highly usable device than for the less usable device (MU+ = 3.92, MU- = 3.09). This difference was
statistically highly significant (F = 11.7; df = 1, 54; p < .001) and denotes a successful manipulation of inherent usability. Furthermore, the influence persists over the course of time (i.e. no interaction of time and usability on information quality). This was not expected according to our third hypothesis, suggesting that the influence of usability on
subjective usability measures does change over time. The analysis also revealed that design aesthetics had a strong influence on perceived information quality at the beginning of the study. However, this influence became smaller with increasing exposure time and had even disappeared in the second week, as the data in figure 2 clearly demonstrate. This observation was confirmed by a significant interaction between aesthetics and time (F = 6.44; df = 2, 108; p < .01), which confirms the assumptions made in our first hypothesis.
Figure 2: The effect of design aesthetics on perceived usability over time. 3.1.3. System usefulness and interface quality
The second subscale of the PSSUQ, system usefulness, showed somewhat higher ratings than interface quality as the third subscale (MSU = 3.9, MIQ = 2.7). However, for
both subscales analysis of variance did not find any significant effects, neither a main effect of design aesthetics, nor an interaction between aesthetics and time.
3.1.4. Usability Diary
Measures of the usability diary were recorded twice a day and summarized for week one and week two. Ratings on the usability diary did neither differ as a function of exposure time (Mt0 = 3.26; Mt1 = 3.29; Mt2 = 3.33; F < 1) nor inherent usability (MU+ =
MA- = 3.21; F < 1). Finally, no significant interaction between any of the independent
variables has been observed (all Fs < 1).
In a further analysis, using again the aggregated data for week 1 and 2, only the ratings of usability were included when a task was completed prior to it (see figure 2). At the descriptive level, the analysis revealed a similar pattern as the PSSUQ data, with figure 3 displaying the data as a function of design aesthetics and exposure time.
However, in contrast to the PSSUQ data, analysis of variance did not show a significant effect of design aesthetics for the present data set (F < 1). Similarly, the diminishing effect of aesthetics over time, as proposed in our first hypothesis and suggested by visual inspection of figure 3, was not confirmed by analysis of variance (F < 1). None of the other effects were found to be significant.
Figure 3: The effect of design aesthetics on usability rating over time. 3.2. Perceived Aesthetics
As for the previous measure of perceived usability, a MANCOVA was carried out. Time, inherent usability and design aesthetics were entered as independent variables and the two subscales of the aesthetics questionnaire as dependent variables. The analysis revealed a main effect of design aesthetics (F= 6.41; df = 2, 53; p < .005). None of the other independent variables emerged as a factor of significant influence, which indicates that our second hypothesis was not confirmed. Only the main effect of design aesthetics was tested by separate ANCOVAs for each of the two subscales.
3.2.1. Perceived classic aesthetics
Ratings of this perceived visual aesthetics scale were higher for the aesthetically
appealing device (M = 3.61, SD = 0.93) than for the aesthetically unappealing one (M = 3.21; SD = 0.98). This effect was significant (F = 7.94; df = 1, 54; p < .01) and is to be considered a successful manipulation check.
3.2.2. Perceived expressive aesthetics
The grand mean for the second dimension of perceived aesthetics was M = 2.4, which was considerably lower than the user rating of perceived classic aesthetics (M = 3.4). Analysis of variance did not find any significant effects of design aesthetics (MA+ =
2.40; MA- = 2.43; F < 1).
3.3. Emotion Diary
Like the usability diary, the emotion diary was completed twice a day. A first analysis, with all data aggregated for week 1 and 2, revealed no significant effects for any of the independent variables. In a second analysis (again with all data aggregated for week 1 and 2), only the ratings of emotion were included when a task was completed prior to it (see figure 2). The pattern of results was very different. On this data set, a MANCOVA was carried out, using time, inherent usability and design aesthetics as independent variables and the three dimensions of emotion as dependent variables. The analysis revealed a significant main effect of aesthetics (F= 5.43; df = 3, 54; p < .01) and of time (F = 3.25; df = 6, 51; p < .01) and two significant interactions: time x aesthetics (F= 2.35 df = 6, 51; p < .05) and time x usability (F= 3.19; df = 6, 51; p < .01). Only these four effects were subsequently tested by separate ANCOVAs for each of the three dimensions.
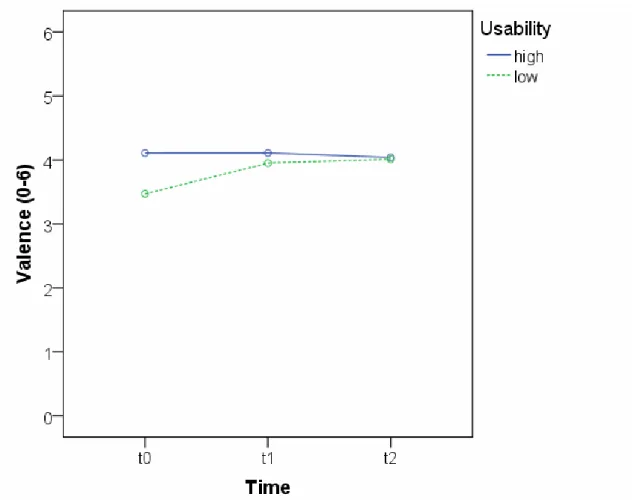
3.3.1. Valence
With regard to inherent usability, test participants reported at t0 more positive emotions
when using the highly usable mobile phone compared to the less usable device (see figure 4). However, with increasing usage experience, the difference between the two versions of the mobile phones disappeared. This was confirmed by a significant interaction between exposure time and inherent usability (F = 4.26; df = 1.8, 98.7; p < .05). This confirms our third hypothesis. Furthermore, it emerged that ratings of valence showed a moderate but significant linear increase over the course of time (Mt0 = 3.8, Mt1
= 4.0, Mt2 = 4.1; F = 3.29; df = 1.7, 98.7; p < .05). No other significant effects were
found.
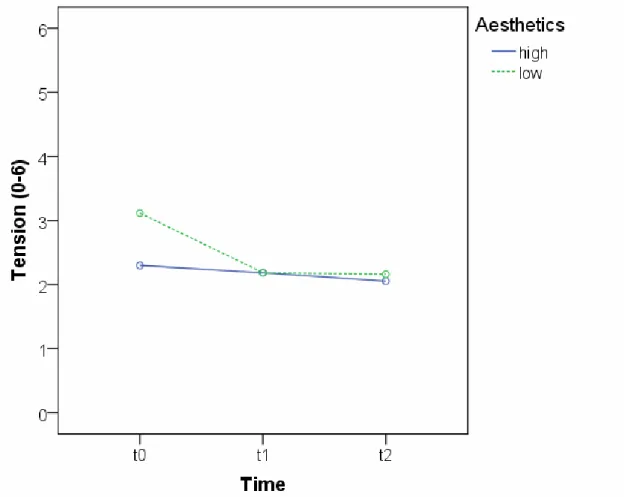
3.3.2. Tension
This dimension of emotion showed a very similar pattern to valence. Test participants reported less tension at t0 when using the highly usable mobile phone than when
operating the less usable one (see figure 5). Again, this effect disappeared with increasing usage experience, as demonstrated by a highly significant interaction between time and inherent usability (F = 9.64; df = 1.60, 96.7; p < .001). A similar interaction was observed for the influence of design aesthetics and time. At t0, product
using the more appealing device (see figure 6). However, as proposed in our first hypothesis, this effect disappeared again with increasing usage experience at t1 and t2.
This was confirmed by a significant interaction between time and design aesthetics (F = 3.27; df = 1.7, 96.7; p < .05). It also emerged that participants were tenser at the
beginning of the study (M = 2.73) than at later testing sessions (Mt1 = 2.3; Mt2 = 2.0).
This main effect of time on tension was overall significant (F = 8.15; df = 1.7, 96.7; p < .001), with planned comparisons also indicating a significant linear trend (F = 11.10; df = 1, 56; p < .01). Finally, the analysis revealed that participants using the more
attractive device reported lower ratings of tension (M = 2.2) than participants using the unattractive device (M = 2.5; F = 4.38; df = 1, 56; p < .05). No other significant effects were found.
3.3.3. Arousal
Participants using the attractive mobile phone reported higher arousal (M = 3.2) compared to participants using the unattractive one (M = 2.7, F = 4.38; df = 1, 56; p < .05). It also emerged that arousal levels increased from t0 (M = 2.7) to t1 (M = 3.1) and
decreased again slightly at t2 (M = 2.9). The main effect of time was overall significant
(F = 3.43; df = 1.8, 100.9; p < .05), but planned comparisons only revealed the increase from t0 to t1 to be significant (F = 5.51, df = 1,56; p < .05). No other significant effects
were found.
Figure 6: Effect of design aesthetics on tension over time.
3.4. User Performance
For an analysis of user performance over time a transformation of the data was required. This was because the order of the presentation of the different tasks was randomized and there were differences between tasks with regard to their difficulty (e.g. some participants may have had more difficult tasks in the first week than in the second). To control for this order effect, task difficulty (here defined in terms of task completion time) was corrected by setting the difficulty of each task to the same level (i.e. as would be done by a z-transformation for each task). The transformed data were used in the analysis of variance. However, for better comprehensibility, the means reported represent the uncorrected data.
3.4.1. Task completion time
While the analysis appeared to reveal better performance during the lab-based testing session than during the two weeks of the field experiment Mt0 = 80.6 s; Mt1 = 129.8 s;
Mt2 = 121.3 s), this difference did not reach significance (F = 2.42; df = 2, 108.4; ns).
Inherent usability did not show a significant difference either (MU+ = 110.82, MU-
=110.26, F < 1). No effect of aesthetics was found (MA+ = 116.79; MA- = 104.30; F =
2.38; df = 1, 54; ns). No significant interaction was observed. These findings do not support our second hypothesis in which it was assumed that aesthetics would have an influence on measures of user behaviour.
3.4.2. Task completion rate
An analysis of the number of participants that successfully completed the task revealed an average rate of about 89,7 % across conditions. This rate appeared to be higher during the first testing phase than during the last two (Mt0 = 98.0 %; Mt1 = 83.1; Mt2 =
88.0 %) but statistical tests did not confirm this to be a significant difference (F = 2.23; df = 2, 108.4; ns). An analysis of the main effects of inherent usability and aesthetics revealed that neither independent variable had a significant influence (inherent usability: F = 1.52; df = 1, 54; ns; aesthetics: F = 3.86; df = 1, 54; ns). None of the interactions showed a significant effect.
3.5. Comparison of Multiple-Session Testing with Single-Session Testing
In this section, the findings of the present study using a longitudinal multiple-session testing approach are compared with a (hypothetical) single-session testing approach, assuming that usability testing had only taken place on the first day. Table 2
summarizes the findings previously reported (based on a three-factorial ANCOVA model) and compares these with the results of a two-factorial model (excluding the factor ‘exposure time’ since only the testing session at t0 was taken into account).
The comparative analysis revealed that design aesthetics showed a considerable influence on perceived usability. However, as suggested in our first hypothesis, after having gained some product experience (at t1 and t2), this effect disappeared. This
indicates that without multiple-session testing, the influence of aesthetics in usability tests would have been grossly overestimated.
Table 2. Comparison of differences between the use of a 2-factorial model (single-session testing) and a 3-factorial model (multiple-(single-session testing).
Independent variable
Dependent variable
Effects of 2-factorial model Effects of 3-factorial model Information
quality
Significant main effect (F = 4.63; df = 1, 54; p < .05)
- No main effect
Effect wanes over time (aesthetics x time)
Classic aesthetics
Significant main effect (F = 9.36; df = 1, 54; p < .01)
- Significant main effect No change of effect over time Tension Significant main effect (F =
6.47; df = 1, 54; p < .05)
- Significant main effect
Effect wanes over time (aesthetics x time)
Design aesthetics
Arousal Significant main effect (F = 5.52; df = 1, 54; p < .05)
- Significant main effect
No interaction between aesthetics and time
Inherent usability
Information quality
Significant main effect (F = 16.84; df = 1, 54; p < .001)
- Significant main effect No change of effect over time Classic
aesthetics
Significant main effect (F = 6.19; df = 1, 54; p < .05)
- No main effect
No interaction between aesthetics and time
Tension Significant main effect (F = 6.76; df = 1, 54; p < .05)
- No main effect
Effect wanes over time (usability x time)
Valence Significant main effect (F = 6.99; df = 1, 54; p < .05)
- No main effect
- Effect wanes over time (aesthetics x time)
4. Discussion
A central question of the study was to determine whether a longitudinal multiple-session approach to usability testing would provide different results compared to single-session usability testing typically used. The results provide some evidence for such differences, which suggests the existence of a methodological artefact that affected the findings of previous research making use of single-session testing. Furthermore, the use of the diary method appeared to be more promising if it is applied in connection with the completion of a standardized task. In addition to these methodological implications, the results of the study indicated that design aesthetics influenced emotion and
perceived usability.
The influence of exposure time in usability testing
An important finding of the present study was that most previous research findings surrounding the influence of aesthetics on perceived usability may have been due to a methodological artefact. The influence of aesthetics on perceived usability, strongly visible at t0, had disappeared at t1 and t2. Numerous studies in the research
literature have claimed the existence of such a positive influence of aesthetics (e.g. Tractinsky, 2000; Ben-Bassat et al., 2006; Sonderegger & Sauer, 2010). Although this claim was based on strong empirical evidence, previous work fell short of considering the effects of exposure time since it was based on single-session testing. The time-based changes observed suggest that salient characteristics (e.g. visual aesthetic features) lose in importance over time while the influence of more hidden characteristics (e.g. certain features of inherent usability) may be on the increase.
In addition to the time-based effects just described, there was further evidence for time-mediated changes that would have gone unnoticed if a single-session approach to usability testing had been used. Inherent usability showed an impact on two
dimensions of emotion at t0, with low inherent usability leading to negative valence of
emotion and also to increased tension. This was observed at t0 but both effects already
disappeared during the first week of testing, displaying a similar pattern to the one observed for the influence of aesthetics on perceived usability. It suggests that the differences in inherent usability were already noticed at a very early stage of testing. This does not contradict the argument that inherent usability is to be considered a hidden factor because the features making up poor usability were already fully
noticeable at the completion of the very first task (i.e. unavailability of text labels and deteriorated legibility due to inappropriate background colours). It is conceivable that with increasing product familiarity participants adapted well to poor usability, that is, even without text labels the icons were correctly interpreted and this also required less accuracy in reading. Text labels have the purpose of providing meaning to unknown or ambivalent icons but they lose in importance over time (Wiedenbeck, 1999). This may have caused the effect to disappear during the course of the study.
Time-mediated effects on emotion were not only observed as a function of inherent usability but also of design aesthetics. A less appealing design increased user tension (in the same way as poor inherent usability did) but again this was a rather short-lived effect, already disappearing at t1. These time-mediated effects observed for
inherent usability and design aesthetics suggest that user emotion resulting from user-product interaction are rather ephemeral and do not persist over longer periods of time, as product aesthetics only influenced user emotion at an early stage of user-product interaction. With respect to system usability, these findings are consistent with previous research, which found negative usage experience to become less relevant for user
satisfaction with increasing product usage (Karapanos et al., 2009). Furthermore, frustration levels were shown to decrease over extended product usage (Mendoza & Novick, 2005). An explanation may be that the frustration a user experiences when encountering a usability problem (e.g. a specific function cannot be found in the menu structure) might disappear as soon as the problem is solved. For the aesthetic appeal of a product, our longitudinal data indicates that users may somehow get used to the
aesthetic appeal of a product and hence do not show a specific emotional reaction every time they interact with it. The analysis also revealed main effects of time on all three dimensions of emotion, resulting in more positive emotion, less tension, and (perhaps most surprisingly) increased arousal. These provide further evidence for general adjustments that take place over time, which are independent of the specific characteristics of the artefact.
While the present study showed ample evidence of time-based changes in subjective measures, it is important to note that no time-based effects were observed for any of the performance measures. This is astonishing because it was expected that tasks would be completed more efficiently and effectively with increasing experience of using a product. An effect of time was especially expected for the participants using the device of poor usability since it was assumed that with increasing experience,
participants would be better at working around usability flaws such as missing icon text descriptions. However, measures on user performance indicate that there was no
significant effect of inherent usability on performance (the effect did not even occur at t0). While visual inspection of the data suggests such an effect, the statistical analysis
did not confirm this to be significant. This may be due to a number of reasons. First, the manipulation used (i.e. reduced contrast and removing icon labels) was weaker than other typical manipulations of inherent usability, for which such effects on performance were found (e.g. changing the menu structure; Jacko & Salvendy, 1996). Second, the allocation of tasks to each participant in a different order also increased variance and therefore reduced the power of the manipulation. Third, self-report measures such as perceived usability and emotion may be more sensitive to usability manipulations than performance (e.g., similar effects were found for the effects of aesthetics; Tractinsky et al., 2000). If future studies were to confirm that performance measures are not
influenced by exposure time, it would imply for usability practitioners that the adoption of a longitudinal multi-session approach to usability testing may be less relevant if objective measures of usability are of primary interest but it becomes highly relevant if subjective indicators (notably perceived usability and emotion) are the main concern. The ambulatory assessment method in usability testing
Apart from the questions surrounding multiple-session testing, another important methodological issue emerged in the present study. The analysis of the emotion diary revealed that the data are much more meaningful if they are collected directly after task completion. If emotion is measured at a time when no standardized tasks are allocated, it is likely to be under the influence of too many uncontrollable factors (e.g., some users have used the device during the preceding hour while others have not). The reduced effectiveness of diary scales, when unrelated to task completion, was also indicated by the usability diary. The F-values reported were lower when the data analysis was carried out on the complete data set rather than the subset containing only the data points that were collected immediately following task completion. Overall, it emerged that ambulatory assessment is a promising method, which is also applicable in the field of ergonomics. This corroborates the call of Klumb, Elfering and Herre (2009) for the ambulatory assessment method to be applied in the field of ergonomics.
The influence of aesthetics on emotions in usability testing
The aesthetic manipulation of the artefact was successful, as the user ratings on the scale of classic aesthetics have confirmed. Furthermore, operating an aesthetically unappealing device also led to decreases in users’ energetic arousal and to increased tension while valence of emotion was unaffected. This corresponds to the now widely accepted view that aesthetic experience has an influence on an individual’s emotion, though there is still no consensus yet about the underlying processes (Leder, Belke, Oeberst & Augustin, 2004; Hekkert et al, 2003). Empirical work in the domain of usability research has found evidence for such a relationship between aesthetics and emotion (e.g. Thüring & Mahlke, 2007; Sonderegger & Sauer, 2010). It is important to note that some of the emotional reactions observed in our study have vanished with increasing exposure time, whereas the effect of aesthetics on arousal has remained stable over time and represents one of the very few effects in this study that was not subject to time-induced fading.
Limitations
A limitation of the study relates to the possibly confounding effect of the testing environment (i.e. lab-based testing phase was followed by field-based testing) on the observed time-based changes. It cannot be excluded that the change from lab to field testing also contributed to some of the effects observed. However, there is some
evidence in the data that may discount this concern to some extent. This is related to the fact that most dimensions of emotion (i.e. valence and tension) have shown a clear linear trend across all three measurement points (i.e. trend even continued from t1 to t2).
A further issue to be addressed concerns the instrument chosen to measure perceived aesthetics in this study. The ‘User Experience Scale’ does not explicitly address aspects of colour design of a product. However, colour is a very important factor influencing the evaluation of product aesthetics (c.f. Moshagen and Thielsch, 2010; Cyr et al., 2010). Hence, the use of an instrument considering colour design (such as the Visual Aesthetics of Website Inventory, Moshagen & Thielsch, 2010) might have led to even stronger effects of the aesthetics manipulation compared to the instrument used in this study.
Implications for future research and practice
The present study has a number of implications for research and practice alike. First, if the traditional approach of single-session usability evaluation had also been applied in the present study, the findings of our study would have been very different, as the comparative analysis in the results section demonstrated. Second, the present study largely represented a field experiment, using standardized tasks and collecting
quantitative data at several levels. This is in contrast to most previous longitudinal studies in usability research, which are characterized by the absence of performance measures, a rather small sample size, and the use of subjective data that were collected retrospectively. In particular, the use of standardized tasks emerged to be important for increasing the effectiveness of the diary scales. The combination of dairy scales and performance measurement represent the key elements of the ambulatory assessment method in usability testing, which produced more accurate assessment of user’s perception of usability and their affective state than a retrospective approach would have done. Finally, if the goal of the evaluation is solely the detection of usability problems, the use of longitudinal designs for usability evaluation may be dispensable since there may only be little interest in discovering how users learn to work around
usability issues over the course of time. On the other hand, against the background of the increasing importance of experiential aspects of the user-product interaction, longitudinal designs may be needed to gain a better understanding of such time-dependent effects of product usage.
References
Bailey, J. E. and Pearson, S. W., 1983. Development of a tool for measuring and analyzing computer user satisfaction. Management Science, 29, 530-545. Ben-Bassat, T., Meyer, J. and Tractinsky, N., 2006. Economic and subjective measures
of the perceived value of aesthetics and usability. ACM Transactions on Computer-Human Interaction (TOCHI), 13, 210-234.
Bevan, N., 2001. International standards for HCI and usability. International Journal of Human-Computer Studies, 55, 533-552.
Bolger, N., Davis, A. and Rafaeli, E., 2003. Diary methods: capturing life as it is lived. Annual Review of Psychology, 54, 579-616.
Chawda, B., Craft, B., Cairns, P., Rüger, S. and Heesch, D., 2005. Do attractive things work better? An exploration of search tool visualisations. In: L. McKinnon, O. Bertelsen, and N. Bryan-Kinns, eds. Proceedings of ‘05 British HCI Group Annual Conference (HCI2005), September 2005, Edinburgh, UK.
Cyr, D., Head, M. and Larios, H., 2010. Colour appeal in website design within and across cultures: A multi-method evaluation. International Journal of Human-Computer Studies, 68 (1), 1-21.
De Angeli, A., Sutcliffe, A. and Hartmann, J., 2006. Interaction, usability and aesthetics: what influences users’ preferences? Proceedings of the ’06 Conference on Designing Interactive Systems. New York: ACM, 271-280. Dillon, A. and Song, M. (1990). An empirical comparison of the usability for novice
and expert searchers of a textual and a graphic interface to an art-resource database. Journal of Digital Information, 1, 9-26.
Fahrenberg, J., Myrtek, M., Pawlik, K. and Perrez, M., 2007. Ambulatory assessment – monitoring behavior in daily life settings. European Journal of Psychological Assessment, 23, 206-213.
Forlizzi, J. and Battarbee, K., 2004. Understanding experience in interactive systems. Proceedings of the ’04Conference on Designing Interactive Systems: Processes, Practices, Methods, and Techniques. Cambridge, MA: ACM, 261–268.
Frøkjær, E., Hertzum, M. and Hornbæk, K., 2000. Measuring usability: are
effectiveness, efficiency, and satisfaction really correlated? Proceedings of the ACM CHI ‘00 Conference on Human Factors in Computing Systems. The Hague, Netherlands: ACM, 345-352.
Gerken, J., Bak, P. and Reiterer, H., 2007. Longitudinal evaluation methods in human-computer studies and visual analytics. Metrics for the Evaluation of Visual Analytics (an InfoVIS 2007 Workshop).
Han, S. H., Yun, M. H., Kwahk, J. and Hong, S. W., 2001. Usability of consumer electronic products. International Journal of Industrial Ergonomics, 28, 143-151.
Hartmann, J., Sutcliffe, A. and de Angeli, A., 2007. Investigating attractiveness in web user interfaces. Proceedings on the CHI ’07 Conference of Human Factors in Computing Systems. New York: ACM, 387-396.
Hekkert, P., Snelders, D. and van Wieringen, P.C.W., 2003. ‘Most advanced, yet acceptable’: Typicality and novelty as joint predictors of aesthetic preference in industrial design. British Journal of Psychology, 94, 111–124.
Hertzum, M. and Jacobsen, N. E., 2001. The evaluator effect: a chilling fact about usability evaluation methods. International Journal of Human-Computer Interaction, 13, 421 - 443.
Hockey, G. R. J., 1997. Compensatory control in the regulation of human performance under stress and high workload: A cognitive-energetical framework. Biological Psychology, 45, 73–93.
Hornbaek, K., 2006. Current practice in measuring usability: Challenges to usability studies and research. International Journal of Human-Computer Studies, 64, 79-102.
Hunt, R. W. G., 2004. The reproduction of color. 6th ed. Chichester UK: Wiley-IS&T Series in Imaging Science and Technology.
ISO 9241-11, 1998. Ergonomic requirements for office work with visual display
terminals (VDTs)-Part 11, Guidance on usability. International Organization for Standardization.
ISO 9241-10, 2003. Ergonomics of Human-System Interaction-Part 10, Dialogue principles. International Organization for Standardization.
Karapanos, E., Hassenzahl, M. and Martens, J.-B., 2008. User experience over time. Proceeding of the ’08 CHI Conference Extended Abstracts on Human Factors in Computing Systems. New York: ACM, 3561-3566.
Karapanos, E., Zimmerman, J., Forlizzi, J. and Martens, J.-B., 2009. User experience over time: an initial framework. Proceedings of ’09 Conference on Computing Systems. Boston, MA: ACM, 729-738.
Kjeldskov, J., Skov, M. B. and Stage, J., 2010. A longitudinal study of usability in health care: does time heal? International Journal of Medical Informatics, 79, 135-143.
Klumb, P., Elfering, A. and Herre, C., 2009. Ambulatory assessment in
industrial/organizational psychology: fruitful examples and methodological issues. European Psychologist, 14, 120-131.
Lavie, T. and Tractinsky, N. (2004). Assessing dimensions of perceived visual
aesthetics of websites. International Journal of Human-Computer Studies, 60, 269-298.
Leder, H., Belke, B., Oeberst, A. and Augustin, D., 2004. A model of aesthetic appreciation and aesthetic judgments. British Journal of Psychology, 95, 489– 508.
Lewis, J., 2002. Psychometric evaluation of the PSSUQ using data from five years of usability studies. International Journal of Human-Computer Interaction, 14, 463-488.
Liedl, R. (1994). Die Pracht der Farben: eine Harmonielehre. Mannheim: Bibliographisches Institut.
Lindgaard, G., Fernandes, G., Dudek, C. and Brown, J. (2006). Attention web
designers: you have 50 milliseconds to make a good first impression! Behaviour & Information Technology, 25, 115-126.
Russell, J.A. and Mehrabian, A., 1977. Evidence for a three-factor theory of emotions. Journal of Research in Personality, 11, 273-294.
Mendoza, V. and Novick, D., 2005. Usability over time. Proceedings of the SIGDOC ‘05, Coventry, UK. New York: ACM, 151-158.
Minge, M., 2008. Dynamics of user experience. Proceedings of the NordiCHI ’08 Conference. Lund, Sweden.
Moshagen, M., Musch, J. and Göritz, A. S., 2009. A blessing, not a curse: Experimental evidence for beneficial effects of visual aesthetics on performance. Ergonomics, 52, 1311-1320.
Moshagen, M. and Thielsch, M. T., 2010. Facets of visual aesthetics. International Journal of Human-Computer Studies, 68, 689-709.
Nichols, T.S., Rogers, W.A. and Fisk, A.D., 2006. Designing for aging. In: G.
Salvendy, ed. Handbook of Human Factors and Ergonomics (pp. 1418-1445). Hoboken, NJ: Wiley.
Nielsen, J. and Levy, J., 1994. Measuring usability: preference vs. performance. Communications of the ACM, 37, 66―75.
Podsakoff, P. M., MacKenzie, S. B., Lee, J. Y., and Podsakoff, N. P., 2003. Common method biases in behavioral research: a critical review of the literature and recommended remedies. Journal of Applied Psychology, 88(5), 879-903. Reber, R., Schwarz, N., and Winkielman, P., 2004. Processing fluency and aesthetic
pleasure: is beauty in the perceiver’s processing experience? Personality and Social Psychology Review, 8(4), 364–382.
Sauer, J, Seibel, K. and Rüttinger, B., 2010. The influence of user expertise and prototype fidelity in usability tests. Applied Ergonomics, 41, 130-40.
Shneiderman, B., 1998. Designing the user interface: Strategies for effective human-computer interaction. 3rd ed.. Reading: Addison Wesley.
Sonderegger, A. and Sauer, J., 2009. The influence of laboratory set-up in usability tests: effects on user performance, subjective ratings and physiological measures. Ergonomics, 52, 1350-61.
Sonderegger, A. and Sauer, J., 2010. The influence of design aesthetics in usability testing: effects on user performance and perceived usability. Applied Ergonomics, 41, 403-10.
Sporka, A. J., Kurniawan, S. H., Mahmud, M. and Slavik, P., 2007. Longitudinal study of continuous non-speech operated mouse pointer. Proceedings of the CHI ’07 Extended Abstracts on Human Factors in Computing Systems. New York: ACM.
Sutcliffe, A., de Angeli, A. and Hartmann, J., 2008. Towards a theory of user judgment of aesthetics and user interface quality. ACM Transactions on Computer-Human Interaction (TOCHI), 15, 1-30.
Szameitat, A.J., Rummel, J., Szameitat, D.P. and Sterr, A., 2009. Behavioural and emotional consequences of brief delays in human-computer interaction. International Journal of Human-Computer Studies, 67, 561-570.
Thielsch, M.T. and Hirschfeld, G., in press. High and low spatial frequencies in website evaluations. Ergonomics.
Thüring, M. and Mahlke, S., 2007. Usability, aesthetics and emotions in human– technology interaction. International Journal of Psychology, 42, 253–264. Tractinsky, N., 2000. What is beautiful is usable. Interacting with Computers, 13,
127-145.
von Wilamowitz-Moellendorff, M., Hassenzahl, M. and Platz, A., 2006. Dynamics of user experience: How the perceived quality of mobile phones changes over time. In User Experience - Towards a unified view, Workshop at the 4th Nordic Conference on Human-Computer Interaction (NordiCHI). New York: ACM , 74-78.
Wiedenbeck, S., 1999. The use of icons and labels in an end user application program: An empirical study of learning and retention. Behaviour & Information
Wilhelm, P. and Schoebi, D., 2007. Assessing Mood in daily Life. European Journal of Psychological Assessment, 23, 258-267.