HAL Id: hal-00295183
https://hal.archives-ouvertes.fr/hal-00295183
Submitted on 5 Feb 2002
HAL is a multi-disciplinary open access
archive for the deposit and dissemination of
sci-entific research documents, whether they are
pub-lished or not. The documents may come from
teaching and research institutions in France or
abroad, or from public or private research centers.
L’archive ouverte pluridisciplinaire HAL, est
destinée au dépôt et à la diffusion de documents
scientifiques de niveau recherche, publiés ou non,
émanant des établissements d’enseignement et de
recherche français ou étrangers, des laboratoires
publics ou privés.
the moderately polluted marine boundary layer: a 1-D
modelling study
J. E. Williams, F. J. Dentener, A. R. van den Berg
To cite this version:
J. E. Williams, F. J. Dentener, A. R. van den Berg. The influence of cloud chemistry on HOx and NOx
in the moderately polluted marine boundary layer: a 1-D modelling study. Atmospheric Chemistry
and Physics, European Geosciences Union, 2002, 2 (1), pp.39-54. �hal-00295183�
www.atmos-chem-phys.org/acp/2/39/
Atmospheric
Chemistry
and Physics
The influence of cloud chemistry on HO
x
and NO
x
in the moderately
polluted marine boundary layer: a 1-D modelling study
J. E. Williams1,2, F. J. Dentener3, and A. R. van den Berg1
1IMAU, University of Utrecht, Utrecht, The Netherlands
2Current Address: FOM-AMOLF, Kruislaan 107, Amsterdam, The Netherlands 3Joint Research Center, Environment Institute, Ispra(Va), Italy
Received: 6 July 2001 – Published in Atmos. Chem. Phys. Discuss.: 25 October 2001 Revised: 16 January 2002 – Accepted: 22 January 2002 – Published: 5 February 2002
Abstract. A 1-D marine stratocumulus cloud model has been supplemented with a comprehensive and up-to-date aqueous phase chemical mechanism for the purpose of as-sessing the impact that the presence of clouds has on gas phase HOx, NOx and O3 budgets in the marine boundary
layer. The simulations presented here indicate that cloud may act as a heterogeneous source of HONOg. The conversion of
HNO4(g)at moderate pH (∼ 4.5) is responsible for this, and,
to a lesser extent, the photolysis of nitrate (NO−3). The effect of introducing deliquescent aerosol on the simulated increase of HONOgis negligible. The most important consequences
of this elevation in HONOgare that, in the presence of cloud,
gas phase concentrations of NOxspecies increase by a
fac-tor of 2, which minimises the simulated decrease in O3(g),
and results in a regeneration of OHg. This partly
compen-sates for the removal of OHgby direct phase transfer into the
cloud and may have important implications regarding the ox-idising capacity of the marine boundary layer.
1 Introduction
The Marine Boundary Layer (MBL) may, under many me-teorological conditions, be described as a three phase chem-ical system where species have the potential to interchange between each phase (gas, deliquescent aerosol and cloud) e.g. van den Berg et al. (2000). Aerosol particles are ubiq-uitous throughout the MBL where they originate from sea spray droplets, which are produced via the mechanical agi-tation of the ocean’s surface by wind and e.g. non-sea-salt sulfate produced from anthropogenic and biogenic DMS and SO2. Many of these particles, which reside above the ocean,
are hygroscopic in nature and become deliquescent at rela-tive humidities above 60–70%. Turbulent mixing above the ocean results in the diffusion of the smallest size fraction of
Correspondence to: J. E. Williams (williams@amolf.nl)
these particles (< 10µm) throughout the entire MBL. Once such particles enter supersaturated air (RH > 100%) they may become activated into cloud droplets, thus serving as cloud condensation nuclei (CCN). Although the volume frac-tion of the aqueous phase is relatively small compared to that of the gas phase, the rates of chemical processes which oc-cur on and in deliquescent aerosol and in cloud droplets can be much faster than the corresponding gas phase processes. Thus, heterogeneous production and loss of key gas phase oxidants may have an appreciable effect on the gas phase composition of the MBL, as demonstrated by a host of previ-ous modelling studies (e.g. Sander and Crutzen, 1996; Liang and Jacobsen, 1999). The magnitude of such influences is principally governed by the extent to which species become partitioned between different phases and their lifetime once incorporated. This, in turn, is determined by physical and chemical characteristics such as the total surface area of par-ticles/droplets, solubility, acidity, reactivity and temperature. The budget of NOx(= NO + NO2) in the MBL is
impor-tant in determining the concentration of tropospheric pollu-tants such as O3. This arises from the complex interactions
which exist in the gas phase between HOxand NOxspecies.
The most important gas phase reactions are described by re-actions (1)–(8) NO + O3→NO2+O2 (1) NO2+O3→NO3+O2 (2) NO + OH → HONO (3) OH + HONO → H2O + NO2 (4) OH + NO2→HNO3 (5) NO + HO2→OH + NO2 (6) NO2+HO2⇔HNO4 (7)
NO2+NO3⇔N2O5 (8)
Moreover, NO2, NO3, HONO and HNO4 all
photo-dissociate efficiently during daytime, the latter three pro-cesses resulting in a regeneration of NOx.
Both NO and NO2 are themselves relatively insoluble
(KH =1.2 × 10⁻²M atm−1for both) meaning that removal of NOxby phase transfer on both deliquescent aerosol and
cloud droplets is rather limited. However, the loss of NOx
reservoir species (e.g. HNO3, NO−3 and N2O5)by
heteroge-neous removal routes has been the subject of a host of recent laboratory studies (e.g. Fenter et al., 1996; Behnke et al., 1997; Schweitzer et al., 1998; Davies and Cox, 1998) which have concluded that the heterogeneous conversion of NOxto
NO−3 is relatively efficient under typical atmospheric condi-tions. Moreover, global modelling studies also suggest that such heterogeneous loss processes are fairly efficient path-ways for removing NOx from the atmosphere via
aggrega-tion/deposition (e.g. Dentener and Crutzen, 1993; Lawrence and Crutzen, 1998). Once formed in the aqueous phase, NO−3 is fairly stable and for it to be re-activated into NOxwould
require the presence of an extremely strong oxidising agent such as fluorine (Ravishankara and Longfellow, 1999). How-ever, laboratory measurements suggest that the photolysis of NO−3 in solution may also occur, resulting in a substantial regeneration of NO2(Zellner et al., 1990), R9, which could
either react further or escape back into the gas phase:
NO−3 +hν (+H+) →NO2+OH (9)
One of the major uncertainties in the current knowledge re-lated to nitrogen containing species in the troposphere is the mechanism by which the accumulation of HONOg(nitrous
acid) occurs during the night (Jacob, 2000). The photolysis of HONOgis relatively efficient, and is considered to be an
important early morning source of OHgin high NOx
environ-ments, such as urban centres (Harrison et al., 1996), where typical mixing ratios for HONOgcan reach several nmol/mol
by the end of the night (Calvert et al., 1994). Recently, mea-surements performed at both a coastal site (Grenfell et al., 1999) and in the free troposphere (Jaegle et al., 1999) also suggest that the photo-dissociation of HONOgproduces
sig-nificant amounts of [OHg] at sunrise. However, the gas phase
production of HONO, R3, is small during the night and the existence of an additional source of HONOgis needed which
is efficient at this time. Certain authors have suggested that heterogeneous surfaces may act as sites for NOxconversion
(Bambauer et al., 1994; Harrison and Collins, 1998; Kleff-mann et al., 1999), vis;
NO2+H2O → NO2.H2Osurface (10)
NO2.H2Osurface+NO2→HONO + HNO3 (11)
However, the reaction probability (γ ) of NO2 is rather
un-certain (with values ranging between 10−3–10−6). Thus, in
the latter case this route may not be of any significant impor-tance to the overall NOxbudget. The lack of any
substan-tiated heterogeneous conversion pathway has provided the impetus for the recent intensity in laboratory investigations concerned with the effects that surfaces, (e.g. soot) may have on the conversion of NO2 to HONO (e.g. Gerecke et al.,
1998; Longfellow et al., 1999; Kalberer et al., 1999). How-ever, in most cases in the MBL, the concentrations of such particles are thought to be relatively low (e.g. Cooke et al., 1997). Therefore, for heterogeneous HONO formation to oc-cur in marine locations another pathway would be needed.
In this paper we focus on the effect that the in situ produc-tion of HONOaq within cloud droplets may have on levels
of HONOg present in the MBL. This paper was partly
mo-tivated by the work of Dentener et al. (2001) and Warneck (1999) who have suggested that the aqueous phase reaction of HNO4exerts a significant influence on tropospheric
chem-istry. The mechanism by which such a conversion could oc-cur involves the uptake and subsequent dissociation of HNO4
(pKa = 5), an important reservoir species for NO2in the gas
phase (equilibrium 7). The KH (HNO4) is relatively high
(∼ 104M atm−1at 298 K), with the uptake, equilibrium (12), being enhanced due to the dissociation of HNO4to its
asso-ciated anion, NO−4, once incorporated into solution, equilib-rium (13);
HNO4(g)⇔HNO4(aq) (12)
HNO4(aq)⇔H++NO−4 (13)
Moreover HNO4(aq) may be formed in situ via
equilib-rium (14), although this route may only be important if there is an efficient in situ source of NO2(aq),i.e. the reaction is not
limited by the low value of KH(NO2);
HO2(aq)+NO2(aq)⇔HNO4(aq) (14)
Furthermore, NO−4 undergoes a relatively slow (0.8 s−1)
uni-molecular decomposition to form the NO−2 anion, R15:
NO−4 →NO−2 +O2 (15)
If the solution is sufficiently acidic (pH < 4) protonation of NO−2 occurs forming HONO (pKa = 3.3), equilibrium (16), which may then be transferred back into the gas phase, equi-librium (17), where it has the potential to regenerate NOg:
HONO(aq)⇔H++NO−2 (16)
HONO(aq)⇔HONO(g) (17)
This reaction sequence is important since it provides a path-way for the net reduction of NO2(g)to NOg. However, due to
the overall cycle being pH limited, this mechanism will only be important in dilute solution, i.e. the low pH commonly associated with deliquescent aerosol will hinder the dissocia-tion of HNO4(aq). Therefore, under the conditions which are
important implications to the budget of NOx, which also
af-fects the budget of O3(g), the photolytic precursor for OHg.
In clear air the major production route for O3(g)is R6,
fol-lowed by the photo-dissociation of NO2(g), R18.
NO2+hν(+O2) →NO + O3 (18)
However, in the presence of cloud, the depletion of HO2(g)
by phase transfer suppresses R6 therefore reducing the over-all rate of O3(g)formation. By introducing a heterogeneous
feedback mechanism that elevates [NOg] in interstitial air,
such as that suggested here, this reduction could be offset to a certain extent. Moreover, the release of HONOg, via R17,
could also offset the depletion of OHgin cloud. This could
also exert an additional influence on the O3(g)budget by
in-creasing both [HO2(g)] and [RO2(g)] via the oxidation of COg
and CH4(g), respectively. Once present, RO2(g)may produce
NO2(g)via R19:
RO2+NO → RO + NO2 (19)
As explained earlier, previous modelling studies have fo-cused on the role clouds and aerosol play with respect to sulphur chemistry (Warneck, 1999; O’Dowd et al., 2000), halon chemistry (Sander and Crutzen, 1996), ozone and free-radicals (Lelieveld and Crutzen, 1991; Walcek et al., 1997; Herrmann et al., 2000b). Here we expand on these earlier studies and present the results of a 1-D modelling study whose aim is to investigate whether the presence of cloud substantially modifies the resident concentrations of HOx (= OH + HO2) and NOx (= NO + NO2) in the
ma-rine boundary layer when accounting for the heterogeneous reduction of HNO4 to HONO. In the following section we
briefly describe the 1-D stratocumulus cloud model used for performing the simulations presented here. Thereafter, we discuss the results of a heterogeneous (gas and cloud) run and compare them to a base simulation that neglects heterogeneous interactions. Then we present the results of some sensitivity runs whose purpose is to differentiate which processes in the proposed conversion mechanism have the largest impact on the simulated effects on HOx and NOx.
Finally, we discuss the uncertainties present in the model and then summarise with conclusions related to the effect of cloud on the HOxand NOxbudget.
2 Model description 2.1 Details of the model
The 1-D chemistry transport model used in this study has re-cently been published by van den Berg et al. (2000), where the focus was on the sulphur cycle in the MBL. Therefore only a short summary will be given here. The model is a 21-layer one-dimensional (column) model and consists of a me-terological, microphysical and a chemistry-transport module.
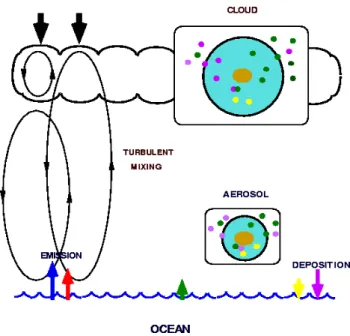
Fig. 1. Schematic representation of the 1-D stratocumulus cloud model of van den Berg et al. (2000) for the simulation of the chem-ical and physchem-ical processes which occur in the Marine Boundary Layer.
An existing meteorological model for the marine bound-ary layer of Duynkerke and Driedonks (1987) was used which includes prognostic equations for the horizontal ve-locities, the wet equivalent potential temperature and total water content. Together with the prescribed boundary con-ditions (e.g. roughness length, surface temperature) these equations determine the temperature and humidity, turbu-lent mixing, condensation/evaporation of cloud water, radia-tive heating/cooling and sensible heat fluxes in the boundary layer.
The microphysical module describes the number and mass distribution functions of aerosol particles and cloud droplets and the change in these size distributions due to microphysi-cal processes. The aerosol population is represented by sev-eral different types of particle (e.g. NH4HSO4, (NH4)2SO4
and NaCl), where each type is represented by one, two or three (overlapping) log-normal modes. By assuming that aerosol particles are in equilibrium with the ambient rela-tive humidity, the size of the wet aerosol particles is related to their dry size by the empirical relationship of Fitzger-ald (1975). At a relative humidity > 80% all aerosol particles are deliquescent and have an associated water content. Cloud liquid water is distributed over droplet sizes according to a 0distribution (Roger and Yau, 1994). The parameters for
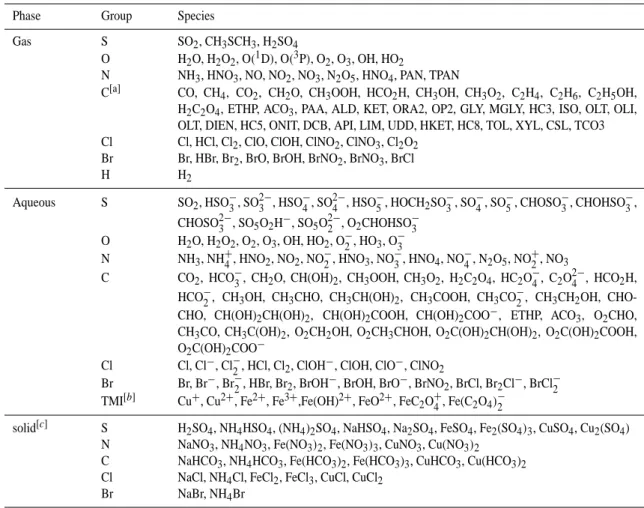
Table 1. List of chemical species considered in the 1-D model. For definitions of the abbreviations concerning the lumped species the reader is referred to Stockwell et al. (1997)
Phase Group Species
Gas S SO2, CH3SCH3, H2SO4
O H2O, H2O2, O(1D), O(3P), O2, O3, OH, HO2
N NH3, HNO3, NO, NO2, NO3, N2O5, HNO4, PAN, TPAN
C[a] CO, CH4, CO2, CH2O, CH3OOH, HCO2H, CH3OH, CH3O2, C2H4, C2H6, C2H5OH, H2C2O4, ETHP, ACO3, PAA, ALD, KET, ORA2, OP2, GLY, MGLY, HC3, ISO, OLT, OLI,
OLT, DIEN, HC5, ONIT, DCB, API, LIM, UDD, HKET, HC8, TOL, XYL, CSL, TCO3 Cl Cl, HCl, Cl2, ClO, ClOH, ClNO2, ClNO3, Cl2O2
Br Br, HBr, Br2, BrO, BrOH, BrNO2, BrNO3, BrCl
H H2
Aqueous S SO2, HSO−3, SO2−3 , HSO−4, SO2−4 , HSO5−, HOCH2SO−3, SO−4, SO−5, CHOSO−3, CHOHSO−3,
CHOSO2−3 , SO5O2H−, SO5O2−2 , O2CHOHSO−3
O H2O, H2O2, O2, O3, OH, HO2, O−2, HO3, O−3
N NH3, NH+4, HNO2, NO2, NO−2, HNO3, NO−3, HNO4, NO−4, N2O5, NO+2, NO3
C CO2, HCO−3, CH2O, CH(OH)2, CH3OOH, CH3O2, H2C2O4, HC2O4−, C2O2−4 , HCO2H,
HCO−2, CH3OH, CH3CHO, CH3CH(OH)2, CH3COOH, CH3CO−2, CH3CH2OH,
CHO-CHO, CH(OH)2CH(OH)2, CH(OH)2COOH, CH(OH)2COO−, ETHP, ACO3, O2CHO, CH3CO, CH3C(OH)2, O2CH2OH, O2CH3CHOH, O2C(OH)2CH(OH)2, O2C(OH)2COOH,
O2C(OH)2COO−
Cl Cl, Cl−, Cl−2, HCl, Cl2, ClOH−, ClOH, ClO−, ClNO2
Br Br, Br−, Br−2, HBr, Br2, BrOH−, BrOH, BrO−, BrNO2, BrCl, Br2Cl−, BrCl−2 TMI[b] Cu+, Cu2+, Fe2+, Fe3+,Fe(OH)2+, FeO2+, FeC2O+4, Fe(C2O4)−2
solid[c] S H2SO4, NH4HSO4, (NH4)2SO4, NaHSO4, Na2SO4, FeSO4, Fe2(SO4)3, CuSO4, Cu2(SO4)
N NaNO3, NH4NO3, Fe(NO3)2, Fe(NO3)3, CuNO3, Cu(NO3)2
C NaHCO3, NH4HCO3, Fe(HCO3)2, Fe(HCO3)3, CuHCO3, Cu(HCO3)2
Cl NaCl, NH4Cl, FeCl2, FeCl3, CuCl, CuCl2 Br NaBr, NH4Br
[a] For the intermediates formed in the gas-phase which do not participate in heterogeneous reactions are omitted. [b] Transition Metal Ions. [c] Species fixed into aerosol upon evaporation of a cloud droplet.
this function are determined by the cloud liquid water con-tent and the amount of activated aerosol particles, where the liquid water content is calculated by the meteorological mod-ule. The amount of activated aerosol particles is calculated following the parameterization of Flossmann et al. (1985). A schematic representation of the overall model is shown in Fig. 1. It is important to note that cloud droplets nucleated on, e.g. sea-salt or sulphate, retain their chemical identity, therefore allowing for size resolved chemistry.
The chemistry-transport module describes the emis-sion/dry deposition fluxes, vertical transport by turbulence, exchange between the gas and aqueous phase, the chemi-cal processes in each phase and the chemichemi-cal processes at the surface of the aqueous and solid phases. Sea-salt emis-sions are calculated following Monahan et al. (1986) and are a strong function of the wind speed. Adjustments to this ap-proach were made to account for the generation of fine sea-salt particles and are based on the log-linear regression fits for sea salt particles as a function of wind speed according to
O’Dowd and Smith (1993). Vertical turbulent transport is pa-rameterized using the turbulent diffusion coefficient for heat and water vapour taken from the meteorological model and the concentration gradient. Aqueous phase chemical species are only allowed to be transported in cloud layers or layers where the relative humidity > 80%. Upon being transported into a layer which has a relative humidity < 80% the volatile species are released back into the gas phase. In this work we used first-order deposition velocities to describe all dry deposition fluxes of gaseous species, since for most species the parameters needed to calculate the resistance fluxes were not available and a more detailed approach does not seem necessary for this particular model study.
The formation of stratocumulus clouds requires both sta-ble stratification in the free troposphere above the boundary layer (i.e. no deep convection) and a sufficient supply of moisture into the boundary layer. Such conditions are com-monly found in the MBL at mid-latitudes during the summer-time. Once formed, stratocumulus cloud decks persist for a
long time providing an ideal scenario under which to inves-tigate the impact of clouds on the regional climate. For this reason we chose our meteorological conditions to be repre-sentative of such a location, i.e. the Atlantic Ocean off the coast of Spain (45◦N). Moreover, our main focus was to in-vestigate the effect of cloud over a number of consecutive days rather than just a few hours, which requires relatively stable boundary conditions to prevent cloud dissipation.
The numerical method used for solving the differen-tial equations in the model uses a third-order Rosenbruck scheme where the solution is performed using a time-splitting method with a time step of 4 s.
2.2 Chemistry of the model 2.2.1 Gas phase chemistry
A complete listing of the chemical species included within the gas-, aerosol- and aqueous-phases in the 1-D model is given in Table 1. Here, the most important sulphur, nitro-gen, carbon, HOx, chlorine and bromine compounds are all
accounted for making the overall chemistry fairly compre-hensive.
The gas-phase chemistry is described by using the RACM chemical mechanism of Stockwell et al. (1997) and was chosen since it is a versatile yet condensed mechanism which includes a detailed description of the most important organic reactions as well as a realistic production of NOx.
As RACM does not contain any gas phase chemistry of reactive halogen species, nor the oxidation of dimethyl sulphide (DMS), the existing scheme was supplemented with 11 additional photolysis reactions and 46 gas-phase reactions, which are listed in the electronic supplement
(www.atmos-chem-phys.org/acp/2/39/
acp-2-39_supp.pdf), respectively. The
photoly-sis rates are parameterised following the approach of Krol and van Weele (1997) and Landgraf and Crutzen (1998). For the lumped species used by RACM, which account for the behaviour of higher hydrocarbons, this approach is not directly applicable (e.g. DIEN or HKET) so the photolysis rates for such species were scaled to other species exhibiting similar photolysis absorption spectra. Irreversible heterogeneous uptake on aerosol particles and cloud droplets was included for ClNO3, BrNO3 and H2SO4 following
the approach of Sander and Crutzen (1996). The phase transfer of chemical species between the gas phase and the wet aerosol/cloud droplets was calculated using the method of Schwartz (1986). The values for the Henry’s constants (KH), gas phase diffusion coefficients (Dg) and accommo-dation coefficients (α) were taken directly from Herrmann et al. (2000b), except for the organic peroxy-radicals. For certain lumped species used in RACM simplifications were made regarding their chemical state once transferred into the liquid phase, e.g. ORA2 is transferred in solution as CH3COOH.
2.2.2 Aqueous phase chemistry
The aqueous phase chemistry was described by using a re-action mechanism (CAPRAM 2.4) that incorporates a full description of C1 and C2 chemistry. The mechanism was
constructed in collaboration with several groups (Herrmann et al., 2000b). It evaluates and utilises the most recent labora-tory data to produce an up-to-date reaction mechanism suited for describing the chemistry which occurs on deliquescent aerosol and in cloud droplets. Due to the size of this mech-anism (86 species, 178 reactions) it is not reproduced here, although it is available as an electronic supplement to this paper. In this study the mechanism was used for the reac-tions which occur both in aerosol associated water and cloud droplets. However, due to the limited data available concern-ing activity coefficients for the chemical species declared in CAPRAM 2.4, no corrections were made to the rates of re-action used in the deliquescent aerosol compared to those used for dilute solution. As CAPRAM 2.4 was designed for a more general application than simulating the chemistry that occurs in the MBL, several modifications were made. These modifications were mainly made to improve both numerical stability and expand the number of reactions involving reac-tive halogen species. The modifications are: (i) no explicit formation of peroxy radicals, i.e. the reaction of free-radical species with O2(aq)was considered to be so fast as to be
in-stantaneous on the time scale of the simulations, (ii) phase exchange was included for HBr, BrOH, ClOH, and H2C2O4,
(iii) 26 additional aqueous phase reactions were included to account for the formation of volatile halogen species in solu-tion, (iv) the Henry’s constants for CH3O2and CH3CH2O2
were scaled to those of CH3OOH and CH3CH2OOH,
respec-tively, using the ratio KH(HO2)/KH(H2O2), as suggested
by Liang and Jacob (1997), (v) the uptake of H2C2O4,
for-mation of hydroxymethanesulphonate (HMS−) and the re-actions of copper were not incorporated into the aerosol chemistry due to computational limitations, (vi) the equilib-rium constant for CO2was described using a single
equilib-rium step (Lelieveld and Crutzen, 1991) (vii) the reaction of HNO4 with HSO−3 replaced the reaction of HONOaq with
OHaq and (viii) the rate of R14 and the mechanism for the
formation of HMS−in dilute solution were taken from War-neck (1999). For further information regarding points (ii), (iii), and (vii) the reader is referred to the electronic supple-ment. Model runs were performed for a mid-latitude of 45◦N over a period of five days, starting at midnight on 21 June, since we expect the maximum effect on photochemistry to occur under these conditions. Although other locations and seasons may also be interesting, the number of simulations is limited for computational reasons, i.e. a 5 day coupled gas-cloud-aerosol run takes over 48 hours processor time on a UNIX workstation. The initial conditions were chosen to be representative of an air-mass that is influenced by conti-nental emissions and subsequently advected over the ocean, see Table 2. These conditions are similar to those chosen for
Table 2. Initial trace gas concentrations used for 1-D model simulations. For definitions of the abbreviations for chemical species the reader is referred to Stockwell et al. (1997)
Species Coppbv reference Species Coppbv reference
NO2 0.1 (E) ORA2 0 (E)
HNO3 0.15 J86 OLT 0 (E)
CH4 1700 ZP96 ISO 0 (E)
H2O2 1 Z98 TOL 0 ZP96
H2 500 (E) CSL 0 ZP96
NH3 0.5 (E) XYL 0 ZP96
CO 140 (E) ALD 0.01 ZP96
O3 30 (E) Ketones 0.1 (E)
HCl 0.5 Z98 GLY 0.01 ZP96
CO2 3.3e5 GW81 MGLY 0.01 ZP96
SO2 0.1 K00 PAN 0 (E)
HCHO 0.5 (E) OP1 1 (E)
ETH 0.5 ZP96 OP2 0.1 (E)
HC3 1 ZP96 PAA 0.001 ZP96
HC5 0 ZP96 CH3OH 0.5 (E)
HC8 0 ZP96 EtOH 0 (E)
C2H4 0.1 ZP96 API 0 (E)
ORA1 0.25 B00 LIM 0 (E)
DMS 0.11 (E)
(E) symbolises an estimated value B00: Barboukas, 2000; GW81: Graedel and Weschler, 1981; J86: Jacob, 1986; K00: Krische et al., 2000; Z98 : Zhang et al., 1998; ZP Zimmerman and Poppe, 1996.
Fig. 2. Development of the cloud layer in the 1-D stratocumulus cloud model over a 5-day simulation. The cloud layer is symbolised by the shaded region.
the marine scenario during the construction of the CAPRAM 2.4 mechanism (Herrmann et al., 2000b). At the start of each simulation all gas phase species were assumed to be homoge-neously distributed across the entire height of the 1-D model, i.e. the first 2 km. The emission fluxes and deposition veloc-ities used throughout the simulations were prescribed using the values given in the electronic supplement, respectively, and represent the release/loss of gaseous species from/to the oceans surface.
3 Model results
In Fig. 2 we show the development of the cloud layer during a typical simulation using our 1-D model. The term UTC
indicates that the time is identical to Greenwich winter time. The cloud layer forms during the first two hours of the sim-ulation and persists for the entire duration of the run, over which time it develops according to changes in the meteoro-logical conditions, e.g leading to increases in the boundary layer height. It can be clearly seen that the depth of the cloud layer increases to approximately 500 m by the fifth day whilst the cloud base increases from 400 to 600 m. The average liq-uid water content within the cloud layer was 0.4 g cm−3and the mean radius of the droplets was 7 µm, which is thought to be representative of non-precipitating conditions.
In the following sections we present the results obtained when introducing cloud interactions into the model and com-pare them with a reference simulation which accounts for gas phase processes only. Comparisons are made for the fifth day of each simulation over a 12 hour period (between 6 am and 6 pm). After 5 days the simulation is not influenced by the initial conditions whereas the chemical regime remains rather similar. Each comparison is segregated into three dis-tinct height regimes which were chosen to emphasise the dif-ferences that occur below the cloud (< 600 m), in the cloud (600–1520 m) and above the cloud (> 1520 m) being rep-resentative of the lower free troposphere. All the different cases considered in this study are defined in Table 3. Ref-erence case (I) is simply a clear sky gas phase simulation. Case (II) is similar to case (I) except that the attenuation of photolysing light by the cloud layer is accounted for to allow differentiation between radiative and chemical effects
Table 3. Key to 1-D simulations performed to investigate the effect of cloud on gas phase species Simulation No. Details of the simulation
I Clear Sky gas phase run only II Attenuated gas phase run only III Gas and Cloud chemistry only IV Gas, Cloud and Aerosol run
V As for III except HNO4and HONO phase transfer is ignored and eqbm (14) inactive
VI As for III except NO−3 photolysis turned off VII As for III except halogen reactions turned off
Table 4. Ratios between simulations (III) / (I) (in parenthesis) and (III) / (II) Gaseous
Species
Overall average Height Height Above Boundary Layer 0–2000 m <600 m 600–1520 m >1520 m O3 (0.96) 0.98 (0.97) 0.98 (0.96) 0.98 (0.96) 1.00 H2O2 (0.75) 0.71 (0.90) 0.91 (0.44) 0.41 (1.23) 1.00 OH (0.87) 0.98 (0.38) 1.10 (0.90) 0.85 (2.23) 1.00 HO2 (0.64) 0.76 (0.55) 1.02 (0.42) 0.42 (1.54) 1.00 NO (1.49) 1.74 (0.76) 1.50 (2.21) 2.22 (1.51) 1.00 NO2 (1.89) 1.61 (2.03) 1.47 (2.11) 1.94 (0.79) 1.00 HONO (67.10) 61.89 (73.61) 74.45 (82.45) 69.64 (1.52) 1.00 HNO4 (1.07) 1.19 (1.24) 1.65 (0.85) 0.79 (1.21) 1.00 PAN (0.92) 1.02 (0.96) 1.05 (0.91) 0.99 (0.81) 1.00
introduced due to the presence of cloud. All other cases in-clude heterogeneous interactions, including the attenuation of photolysis rates by cloud, where case (III) considers a bi-nary phase chemical system (gas and cloud only) and case (IV) considers a tertiary phase chemical system (gas, aerosol and cloud) using the CAPRAM 2.4 scheme described above. For the binary phase chemical system a number of sensitiv-ity runs were performed to establish the importance of cer-tain chemical processes to the overall effect of cloud simu-lated by the model. Case (V) ignores the phase transfer of both HONOgand HNO4(g)and also the in situ formation of
HNO4(aq)by equilibrium (14). Case (VI) ignores NO−3
pho-tolysis in the aqueous phase, so as to limit in situ NO2(aq)
production, and investigates the contribution of this process to HONO formation. Finally, case (VII) investigates the im-portance of the additional halogen chemistry to the simulated perturbation in O3(g)at this summer mid-latitude location.
3.1 Influence of cloud
The effect of introducing cloud into our model simulations (i.e. case III) on the gas phase concentrations of O3, HOxand
NOxspecies is summarised in Table 4. Here ratios are given
relative to reference case (I), as well as case (II), with the lat-ter emphasising the effects of chemistry only. By comparing
the ratios for a chosen species and height regime it can be seen that the ‘clear sky’ ratios are quite different to the cor-responding ‘attenuated’ ratios for case (III). Figures 3a and b show that during the first 3 days, at a height of ∼ 1060 m, i.e. just above the cloud top, the [HO2]g level increases by
more than a factor of 2 due to the significant back-scattering of the photolytic radiation (after the third day the air is within the cloud). Under the moderately polluted conditions of our simulations this increase during the first days is principally due to the enhanced photo-dissociation of O3(g). This
sub-sequently increases the rate of OHgproduction and leads to
associated increases in [HO2]gby R20, which is considered
to be the major gas phase sink for OHg;
OH + CO(+O2) →HO2+CO2 (20)
Moreover, there is also a positive feedback effect due to an increase in the rate of R6, which recycles OHg. This is
confirmed by the profiles of HOx(g)below the cloud layer at
∼ 540 m (Figs. 4a and b). At this height, diffusion of the light through the cloud deck subdues the photochemical for-mation of OHgwhich subsequently suppresses HO2(g)
pro-duction and the efficiency of R6, i.e. less OHgis recycled.
The second most important gas phase sink for OHg is the
oxidation of CH4(g), R21;
Fig. 3. Comparison of [HOx]gand [NOx]gspecies at 1060 m above
sea-level over a 5-day simulation to show the differences introduced by cloud and aerosol/cloud interactions. The reader is referred to diagram 2 regarding development of the cloud layer. (—) case (I), (- - -) case (III), and (....) case (IV).
This results in a ∼ 40% increase in the resident [CH3O2]g
at ∼ 1060 m compared to case (I) (not shown). The pre-dominant removal pathway for CH3O2(g)here is its
termina-tion involving HO2(g), R22, which results in a 0.1 nmol/mol
increase in CH3OOH(g) by the third day at ∼ 1060 m (not
shown);
CH3O2+HO2→CH3OOH + O2 (22)
After the third day, at our chosen height of analysis of 1060 m, the cloud layer develops to such an extent that during the fourth and fifth day the air resides ‘in-cloud’ (Fig. 2). Once this transition occurs a rapid de-pletion of [HO2]g is observed. This is due to the
effi-cient uptake of HOx within the cloud droplets, where the
fast destruction of OHaq by the reaction with solutes, such
as the formate ion (HCOO−) and hydrated formaldehyde (CH2(OH)2), means that the droplets act as an efficient
Fig. 4. Comparison of [HOx]gand [NOx]gspecies at 540 m above
sea-level over a 5-day simulation to show the differences introduced by cloud and aerosol/cloud interactions. The reader is referred to diagram 2 regarding development of the cloud layer. (—) case (I), (- - -) case (III), and (....) case (IV).
sink for OHg. The uptake of HO2(g) is even more
ef-ficient than for OHg, due to its relatively high solubility
(KH = 9 × 10³M atm−1at 298 K) and its dissociation in mildly acidic solution (pH > 4), equilibrium (23), which ef-fectively increases the amount transferred into solution;
HO2⇔H++O−2 (23)
Both of these findings agree with of a host of previous box-modelling studies conducted to investigate the effect of clouds on HOx and O3 formation (e.g. Lelieveld and
Crutzen, 1991; Matthijsen et al., 1995; Walcek et al., 1997) and have been discussed at length in these articles. There-fore, since our work confirms previous studies, no further discussion concerning the fate of these radicals in the con-densed phase is included here.
The situation for NOxis somewhat more complicated as
transfer is limited by low solubility (Schwartz and White, 1983). Figure 3d shows that there is a decrease in [NO2]g
above the cloud top by 20% during the first three days of the simulation. There is also a corresponding increase for [NO]gwhich is principally due to an increase in the
photoly-sis rate of NO2(g), R18. Therefore, even though recycling of
NO2(g)(via R6) will increase due to the simultaneous
eleva-tion in [HO2]g(Fig. 3b) this process does not compensate for
the enhanced photochemical destruction of NO2(g)via R18.
Once the air moves into the cloud layer the [NO2]gincreases
by ∼ 30% during the fifth day, which rises to ∼ 50% during the fifth night (Fig. 3d). For NOgthere is also a simultaneous
increase at 1060 m, as a result of heterogeneous conversion of NO2(Fig. 3c). The reason why NOxincreases in the
pres-ence of cloud is that HONOgseems to be released from the
droplets. This is shown in Figure 5a which compares the [HONO]gprofiles at 1060 m for cases (II) and (III). Here it
can be clearly seen that between 2–10 nmol/mol of HONOg
accumulates at this level over the course of a night, which subsequently photolysies at dawn. The reaction sequence, which is thought to be the dominant pathway for this reduc-tion of NO2(g)to NOg, is R7–R12–R13–R15–R16–R17 (see
sensitivity studies below). The efficiency of this mechanism depends critically on the pH of the cloud due to equilibria (13) and (16) being protonation steps. In our simulations the pH inside the droplets is ∼ 4.5 (not shown), which is typical of moderately polluted conditions, such as those chosen for these model runs, and is mainly governed by the availability of inorganic acids, namely H2SO4(g), HNO3(g) and HCl(g).
This pH value is fortuitous in that the HNO4(aq): NO−4 and
HONO(aq): NO−2 ratios are (0.60 : 0.40) and (0.05 : 0.95),
respectively, which allows the formation of HONO(aq)to
oc-cur, a certain fraction of which then escapes back into the gas phase. Below the cloud deck, at ∼ 540 m (Figs. 4c and d), the [NO2]gincreases from between 10–30 pmol/mol on the
fifth day due to a reduction in the intensity of photolysing light. An associated decrease in [NOg] also occurs at this
level although the regeneration of NOg via heterogeneous
routes limits this decrease to between 1–2 pmol/mol. The fluctuation of gas phase [HOx] and [NOx] due to
heterogeneous effects means that the chemical lifetime of [HNO4]gis also affected by the presence of cloud (Table 10).
Thus, a concentration ratio of 1.65 is obtained at ∼ 500 m which is directly associated with the increase in [NO2]g
(the [HO2]gratio being almost unity). However, it must be
noted that the magnitude of these increases are quite different ([HNO4]g ∼ 0.5 pmol/mol, [NO2]g ∼ 5 pmol/mol). In the
cloud layer HNO4decreases of ∼ 20% are predicted due to
both direct phase transfer, equilibrium (12), and the depletion of [HO2]g, which alters the equilibrium position of (7), (see
discussion below for case V). Above the cloud (> 1520 m) no differences in [HNO4]goccur, when using case (II) as the
reference case, due to the fact that no substantial detrainment of NOx from the cloud layer occurs. An additional
reser-Fig. 5. Comparison of [HONO]gat 1060 m above sea-level for a 5
day simulation.The reader is referred to diagram 2 regarding devel-opment of the cloud layer.(—) [HONO]gprofile for case (II) (- - -)
[HONO]gprofile for (a) case (III), (b) case (V) and (c) case (VI)
voir species for NO2(g)which is accounted for in the RACM
mechanism is peroxyacetylnitrate (PAN), equilibrium (24);
CH3C(O)O2+NO2⇔PAN (24)
For cases (I) and (III) typical concentrations of PAN formed during the first day of the simulation range from between 30– 40 nmol/mol (not shown), which persists for the entire simu-lation. However, PANgsimply acts as a reservoir for NO2(g)
(McFadyen and Cape, 1999) and no heterogeneous removal of nitrogen occurs by the phase transfer of this species within CAPRAM 2.4 (Herrmann et al., 2000b). For this reason no further analysis of PANgis performed in this paper.
3.2 Influence of aerosol
Due to the fact that our chemical model does not account for the influence of activity coefficients in the aerosol associated water we simply use the gas-aerosol-cloud simulation (case IV) to investigate whether increasing the reactive surface area under the cloud layer influences the simulated effects due to cloud. Figures 3 and 4 also show profiles for the cloud plus aerosol run (case IV) at 1060 m and ∼ 540 m, respectively. From these profiles it can be seen that the general trends for HOx and NOx are very similar to the cloud only runs (case
Fig. 6. Comparison of [NO]gat 1060 m above sea-level for a 5 day
simulation.The reader is referred to diagram 2 regarding develop-ment of the cloud layer.(—) [NO]gprofile for case (II) (- - -) [NO]g
profile for (a) case (III), (b) case (V) and (c) case (VI)
HNO2(g)are also nearly identical due to the limited uptake of
HNO4(g)by deliquescent aerosol due to the low aerosol water
pH . Therefore, for brevity, we do not discuss the results of case (IV) in any further depth here.
4 Sensitivity studies
In Figs. 5 to 7 we present the concentration profiles at 1060 m for HONOg, NOg and NO2(g), respectively, for cases (III),
(V) and (VI) (Table 3). All comparisons used case (II) as the reference case to highlight the chemical effects of the system and exclude photolytic effects. Three sensitivity runs are dis-cussed here and were specifically chosen to investigate some aspect of the conversion of NO2to NO in cloud droplets via
the HNO4(g) reaction sequence. As shown above, aerosol
chemistry, as described in our model, does not seem to have any significant role in the production of HONO via the reduc-tion of HNO4and is not discussed in these sensitivity studies.
4.1 The effect of HNO4(g)and HONO(g)uptake on HOx(g)
and NOx(g)
Case (V), which neglects the uptake of HNO4(g), is presented
to substantiate that R12 is the principle route responsible for the simulated release of HONOgas predicted by our model.
Fig. 7. Comparison of [NO2]gat 1060 m above sea-level for a 5
day simulation. The reader is referred to diagram 2 regarding de-velopment of the cloud layer.(—) [NO2]gprofile for case (II) (- - -)
[NO2]gprofile for (a) case (III), (b) case (V) and (c) case (VI).
In addition to neglecting the uptake of HNO4(g), the in situ
formation of HNO4(aq), equilibrium (14), was also set to
zero. The ratios for the gas phase HOx and NOx species,
compared with reference case (I), are summarised in Ta-ble 5. By comparing the ratios for HONOgwith those
pre-sented for a standard cloud run (case (III), Table 4) it can be clearly seen that no significant increase in HONOg
oc-curs for case (V). This corroborates the hypothesis that the heterogeneous reduction of HNO4(aq) is a key step in the
production of HONOg. The most important consequence of
this is that both [NOg] and [NO2(g)] decrease by ∼ 50% and
∼ 35%, respectively, for case (V) compared to case (III). This has significant implications regarding the net produc-tion of O3(g), which is principally governed by the NOg
mix-ing ratio (Crutzen, 1995). Moreover, the depletion of [OHg]
simulated for case (V), due to both phase transfer into the cloud and the lower effective rate of R6 seems to be some-what compensated for in case (III) by the increase in the pho-tolysis of the HONOg, and the elevated [NOg], respectively.
This suggests that using an aqueous phase mechanism which ignores the reduction of HNO4(aq)could lead to an
overesti-mation of the effects of cloud on both their efficiency as an OHg sink and their influence on the overall O3 budget, as
can be seen by comparison of the ratios in Tables 4 and 5. A further interesting result is that, even when R12 is neglected,
Table 5. Ratios between run V/I to highlight the effect of that heterogeneous conversion of NO2to NO has on [HOx]g.and [NOx]g
Species Overall average Height Height Above Boundary Layer
<600 m 600–1520 m >1520 m O3 0.95 0.95 0.94 0.96 H2O2 0.74 0.89 0.43 1.23 OH 0.77 0.34 0.72 2.23 HO2 0.61 0.51 0.39 1.54 NO 0.91 0.49 1.13 1.51 NO2 1.21 1.30 1.25 0.79 HONO 0.99 0.78 1.02 1.52 HNO4 0.64 0.66 0.43 1.21 PAN 0.65 0.65 0.58 0.81
[HNO4(g)] still decreases by ∼ 55% (Table 5). This is due
to the efficiency with which HO2(g)is depleted from the gas
phase, which forces equilibrium (7) towards the left, i.e pre-cipitates the decomposition of HNO4(g). Comparing the ratio
of HNO4(g)for case (III) with case (II) (∼ 21% depletion,
Ta-ble 4) reveals that the increase in NO2(g)simulated for case
(III) hinders the decomposition of HNO4(g) compared with
a run which ignores the aqueous phase chemistry of HNO4
(case V).
In the aqueous phase the resident concentrations of both HO2(aq) and NO2(aq) decrease by ∼ 4% and ∼ 20%,
re-spectively, comparing case (V) to case (III) (not shown) as a result of the changes in the resident concentrations for the associated species in the gas phase. One further difference which occurs in the absence of HNO4(aq)is a small decrease
in [O3(aq)] and [H2O2(aq)] due to the oxidation of S(IV) by
HNO4(aq) , R25, being a significant pathway for sulphate
production under moderately polluted conditions (Warneck, 1999). Unfortunately our model does not calculate chemical fluxes, therefore we cannot quantify the importance of this reaction under conditions where there are low SO2(g)
emis-sions.
HNO4+HSO−3 →HSO4−+NO−3 +H+ (25)
In summary, the net aqueous phase conversion of NO2 to
NO seems to have little effect on the overall chemistry which occurs in solution since the reaction cycle R12–R13–R15– R16–R17 is relatively independent of other oxidants. This point is discussed in more detail below in the section con-cerned with uncertainties.
4.2 The effect of NO−3 photolysis on HONO(g)production
Case (VI) is presented to investigate whether the photoly-sis of NO−3, R9, contributes significantly to the release of HONOgas a result of the in situ production of NO2(aq). This
is interesting in that R9 provides a means of re-activating
NO−3 into NOx, i.e. it does not simply act as a sink for NOx,
which previous modelling studies have tended to ignore. Moreover, typical [NO−3] obtained in our simulations are in the range of 2 × 10⁻⁵ mol dm−3 meaning that, although the rate of R9 is rather small (Jmax =4.3 × 10⁻⁷s−1), the
production of NO2(aq) could still be relatively efficient
dur-ing summer at mid-latitudes. Consequently the efficiency of equilibrium (14) is not limited by KH(NO2). Once formed in
situ, NO2(aq)can either react with HO2(aq)to form HNO4(aq),
equilibrium (14), or escape back into the gas phase, with the branching ratio being pH dependent, i.e. the speciation of HO2(aq). For brevity only differences in concentrations of
>2% between cases (III) (cloud only) and case (VI) will be discussed here. The most important effect of neglecting R9 is that the simulated increase in [HONOg], due to the
pres-ence of cloud, decreases by ∼ 5% (Fig. 5a), which, in turn, causes associated decreases in [OHg], [NOg] and [NO2(g)].
This effect can be explained by considering the correspond-ing decrease in [HNO4(aq)] and [HONO(aq)] by ∼ 5% (not
shown) suggesting that R9 does make a slight contribution to the release of HONOg. Another interesting feature is that
the ratio for NO2(g)between cases (III) (cloud only) and (VI)
decreases by ∼ 13% compared to Table 4. This is most prob-ably a cumulative effect of the direct release of NO2 from
the cloud and the differences introduced by the decrease in HONOg, i.e. lower (OHg).
4.3 The effect of halogen chemistry on HONO(g)
produc-tion
Case (VII) investigates whether aqueous phase halogen chemistry has any significant influence on the release of HONOg, e.g by altering the acidity of the cloud droplets
or by introducing a competing reaction pathway, which al-ters the efficiency in the formation of [HONO(aq)]. The
re-lease of reactive halogen species from sea-salt aerosol in the polluted MBL has been the subject of a host of
mod-Table 6. Differences in the ratios of (NO/(NO+ NO2)) for cases (I – VI) to show the effect of aqueous phase HNO4chemistry on NOx(g)
Case No. Overall average Height Height Above Boundary Layer
<600 m 600–1520 m >1520 m (I) 0.331 0.309 0.344 0.353 (II) 0.262 0.144 0.300 0.504 (III) 0.277 0.146 0.332 0.504 (IV) 0.278 0.147 0.332 0.504 (V) 0.275 0.149 0.326 0.504 (VI) 0.275 0.149 0.326 0.504
eling studies (Sander and Crutzen, 1996; Vogt et al., 1996; Sander et al., 1999), which have concluded that such species have the potential to significantly deplete O3(g)via an
auto-catalytic chain reaction. Under the moderately polluted sce-nario chosen here, comparing the ratios between case (VII) (not shown) and case (III) reveals that, in the absence of del-iquescent aerosol, the simulated change in [O3]gin a cloud
only simulation is a result of a change in NOxchemistry and
not due to reactive halogen chemistry. This may be explained by considering the mechanism by which the halogen species are released, which relies on the conversion of BrOH to BrCl (Vogt et al., 1996), equilibrium (26);
HOBr + Cl−+H+⇔BrCl + H2O (26)
In dilute solution both [H+] and [Cl−] are much lower than that found in aerosol associated water therefore the effective formation rate of BrCl is also much lower, which seems to limit the importance of this equilibrium in cloud droplets. As a result the ratios obtained for cases (III) (cloud only) and (VII) (cloud only – no halogen chemistry) are very similar, i.e. differences in [O3(g)] and [NOx(g)] are < 1%.
5 Discussion
5.1 Other model studies
From the sensitivity studies presented in the preceding sec-tions it can be seen that introducing the HNO4(aq) reaction
sequence (R7–R12–R13–R15–R16–R17) into the aqueous phase chemistry substantially modifies the resident concen-trations of many of the most important gas phase oxidants. Recently a host of modelling studies have been performed to assess the impact of cloud on interstitial gas phase concen-trations (i.e. Lui et al., 1997; Warneck, 1999; Herrmann et al., 2000; Leriche et al., 2000, 2001) . However, direct com-parisons between the findings presented here and these for-mer investigations is complicated by the fact that a range of scenarios, simulation times, chemical mechanisms and mi-crophysical parameters are used. Even more recently, Den-tener et al. (2001) included the uptake and heterogeneous
re-actions of HNO4(g)in a 3D global CTM, where substantial
changes were simulated for [O3(g)] (−2 to 10%), [SO2(g)] (10
to 20%) and [H2O2(g)] (−2 to 20%) in the boundary layer as
a result. However, due to the computational limitations as-sociated with such a study the heterogeneous uptake of HOx
species was ignored meaning that the formation of HNO4(g)
and the consequent heterogeneous uptake of HNO4(g) may
have been somewhat overestimated. Therefore, it is difficult draw similarities between our findings and those from the 3D global study.
5.2 Effect on ozone
Table 6 summarises the variation in the NO/NOx ratio for
cases (I)–(VI), where the comparisons are segregated into the same height regimes as those used in Tables 4 and 5. Although, the differences in the NO/NOx ratio between
the cases presented here are quite small, it can be seen by comparing Figs. 6a and b that [NOg] increases by up to
5 nmol/mol as a result of heterogeneous conversion of NO2.
This, in conjunction with the associated increase in NO2(g),
Fig. 7a, results in the production of O3(g)for case (III) to be
more efficient than case (V) as a result of R6 and R18. How-ever, it must be noted that there is still a ∼ 2% decrease in O3(g)by the fifth day, due to the large depletion of [HO2(g)].
This implies that using an aqueous phase chemical mecha-nism, which neglects the heterogeneous HNO4reaction cycle
discussed here, may result in an over-estimation of the effects of cloud on the tropospheric O3(g)budget in the MBL. A
fur-ther effect of the elevation of HONOgis the regeneration of
OHgwhen clouds are present (compare Tables 4 and 5).
5.3 Uncertainties in reaction rates
The simulated conversion of NO2 to NO due to the
pres-ence of cloud, as presented in this study, relies heavily on the validity of a number of assumptions made regarding the reactivity of nitrogen species in both the gas phase and in aqueous solution. The uncertainty in the equilibrium con-stant for HNO4(g) is listed as a factor of 5 (DeMore et al.,
per-formed under clear sky conditions in the free troposphere have suggested that [HNO4(g)] is lower than expected (Brune
et al., 1999). If indeed the equilibrium constant for HNO4(g)
is lower than that described in RACM (as suggested by Brune et al., 1999) then the amount of HNO4transferred into
solu-tion would decrease according to the change in the partial pressure. Moreover, some uncertainty also exists regarding the pKa value for HNO4(g)(c.f. Lammel et al., 1990;
Lo-gager and Sehested, 1993) . Therefore, we acknowledge that if future studies determine more accurate values for the key steps involved in the mechanism discussed here, the hetero-geneous conversion of HNO4 via this route could become
rather trivial. In terms of the uncertainties concerning the re-activity of NOxin solution, the reaction cycle R7–R12–R13–
R15–R16–R17 does not depend on radicals or other species. However, this is, in part, due to insufficient knowledge and a scarcity of data available for processes which occur in the liquid phase. For instance, the most important free-radical oxidant in the atmospheric aqueous phase is considered to be the OH radical, where many of its reactions occur at, or near, the diffusion-controlled limit (i.e. 1010M−1s−1). Therefore, it seems most likely that interactions between OH and NOx
reservoir species could occur, such as reactions (27) to (29); OHaq+HNO4(aq)→NO2+H2O + O2 (27)
OHaq+HONOaq→NO2+H2O (28)
OHaq+NO−2(aq)→NO2+OH− (29)
The consequence of such reactions would be to hinder the release of HONOg by allowing a competing pathway for
the indirect oxidation of NO to NO2whilst consuming two
radicals. However, for these reactions to be significant the resident concentrations of these NOxreservoir species must
be of a similar magnitude as the other solutes which are thought to be efficient scavengers for OHaq(e.g. HCOO−),
assuming similar rate constants. Comparing typical concen-trations for case (III) reveals that this is not the case, with [HCOO−]/([HNO2] + [HONO]) ≈ 103. Therefore, the
in-fluence of OHaqon the conversion of NO2is probably small.
One further omission is the oxidation of HONOaqby H2O2,
R30. However, due the reaction rate for this process being relatively slow (k28=6.3 × 10³M−1s−1)and dependent on
(H+), the influence on [HONOaq] is considered to be
negli-gible;
H2O2+HONO(+H+) →NO−3 +2H++H2O (30)
In terms of the existing data, the rate constant concerned with the aqueous phase NOxchemistry, which has the most
asso-ciated uncertainty is that for the unimolecular dissociation of NO−4, (R15). The value used here (0.8 s−1) is taken from the modelling study of Warneck (1999) which is an average of the two available literature values of Lammel et al. (1990) and Logager and Sehested (1993). In their study Logager and Sehested (1993) suggest that the rate for this process could
be up to 200 s−1, which would increase the overall
conver-sion rate of NO2 significantly. Therefore, in view of this
fact, this study could be a lower limit in terms of the produc-tion efficiency of HONOg. Moreover, this highlights the need
for further experimental studies concerning the behaviour of such species in solution.
In a recent study concerned with the photolytic produc-tion of OHaqin fog waters during winter, Anastasio and
Mc-Gregor (2001) claim that between 47–100% of photoformed OHaq originates from the photolysis of NO−2/HONO,
reac-tion (31), with the photolysis of nitrate, R9, being a relatively minor source;
HONO/NO−2 +hν(+H+) →NO + OH (31) However, using a photolysis rate calculated from the data of Zellner et al. (1990), this reaction was found to be relatively insignificant during the construction of CAPRAM 2.4 (Her-rmann et al., 2000b). Nevertheless, if this reaction is more important than previously thought the most significant effect would be to reduce the regeneration of OHg. The NO(aq)
formed would escape back into the gas phase due to its low solubility, so that any net decrease in the NOgwould result
as an indirect effect of the fluctuation of OHg.
Due to the fact that the chemical environments found in/on deliquescent aerosol and in cloud droplets are quite different (e.g. pH, ionic strength) one of the largest assumptions made here is that a generic reaction mechanism can adequately ac-count for the chemistry, which occurs in both phases. The results presented for case (VII) suggest that certain pro-cesses, which have been found to be important on deliques-cent aerosol become less important in cloud droplets, and the opposite will also be true. The CAPRAM 2.4. mechanism was condensed using a standard cloud box-model (Herrmann et al., 2000b) therefore certain reactions may have been omit-ted from the mechanism which could have important effects when trying to simulate gas-aerosol chemistry. This is the reason why we supplemented the aqueous phase reaction scheme with the extra reaction set given in the electronic supplement. Moreover, generic KH and α values for both phases have been implemented which may also be an over simplification. For example, laboratory investigations have recently found that the KH(HONO) may differ by an order of magnitude depending on the concentration of ammonium sulphate solutions (Becker et al., 1998) which would have implications regarding the uptake by deliquescent aerosol. Unfortunately, to the authors knowledge, no corresponding measurements have been made for other important HOxand
NOxspecies.
5.4 Other uncertainties
The results presented in this paper focus on the effects of aqueous phase HNO4 chemistry during daytime but it is
also pertinent to discuss the effect during nighttime. In the absence of photolysing light, the resident [HO2(g)] falls
substantially (Fig. 3b) causing a corresponding decrease in [HNO4(g)] via R7 (not shown). However, the release of
HONOg still occurs over the first few hours of a night
as shown in Fig. 5a. This infers that there is sufficient HNO4/NO−4 retained in solution to ensure the production of
NO−2, via R15, even when the [HNO4(g)] decreases. During
wintertime at mid-latitudes the production rate of HNO4(g)
will be reduced due to the lower concentration of HO2(g)
(less intense sunlight) and long nights. On the other hand the lower temperatures would prolong the gas phase lifetime of HNO4. Indeed the results of Dentener et al. (2001)
sug-gested a rather constant effect on photo-oxidants throughout the seasons, with somewhat larger effects during the SH sum-mer and NH winter. As indicated before, computational limi-tations meant that we did not attempt to simulate such a range of locations and seasons in this study.
Although the chemical reaction mechanism discussed here could produce a significant amount of HONOg in
moder-ately polluted locations it is likely to become relatively in-efficient in more polluted scenarios. This is principally due to the high anthropogenic emissions which are asso-ciated with such areas, which usually result in typical pH values for atmospheric aerosol droplets to be much lower than in our simulations (∼ pH 3–4) which alters the ratio of HNO4 : NO−4. Therefore, even though there will be the
higher level of NOx present in such scenarios, which will
result in a subsequent elevation in [HNO4(g)], the uptake will
be dictated by KH(HNO4) and R25 rather than equilibrium
(13). Moreover, the soluble organic fraction will be much more diverse in a polluted scenario compared to that found in the MBL, which introduces uncertainties as to whether the NOx reservoir species would not be oxidised by other
pro-cesses in such an environment. Furthermore, the only CCN considered in our model are ammonium sulphate and sea-salt particles, which originate from the sea surface. However, in more polluted air masses continental dust particles would also contribute significantly to the CCN, which could intro-duce inhomogeneity between cloud droplets. In view of these points, we suggest that the reduction of HNO4(g) in cloud
will simply be one of a number of heterogeneous pathways which could contribute to the production of HONOgover the
continent, e.g. conversion on anthropogenic aerosol. Finally, we acknowledge that the 1-D model used here fo-cuses on the effects introduced by a non-precipitating marine stratocumulus cloud whereas, under certain meteorological conditions, both drizzle and rain maybe important sinks for the fraction of NOx reservoir species which are dissolved.
For example, in the aforementioned study by Anastasio and McGregor (2001) measured [NIII] ≈ µM levels from size-segregated cloud water samples near Tenerife. Thus, loss of NO−2 via precipitation would mean that the regeneration of HOxand NOxfrom the cloud would be less efficient than
that simulated here, which would have consequences for both the lifetime of trace gases in the MBL and the production of
O3(g). However, our study is more representative of most
dominant non-precipitating clouds.
6 Conclusions
In this study we have included a comprehensive aqueous phase chemical mechanism into a 1-D stratocumulus cloud model for the purpose of simulating the heterogeneous ef-fects of cloud on gas phase concentrations of HOxand NOx.
We have found that, during summertime at mid-latitudes (45◦N), the heterogeneous reduction of HNO4(g) by cloud
can act as a source of HONOg in the moderately polluted
MBL. The reaction sequence which leads to this is criti-cally dependent on the pH of the cloud-water. Therefore, it is most likely to be important only in remote and unpol-luted locations away from strong anthropogenic emissions. Furthermore, we have shown that the photolysis of NO−3 in solution contributes by ∼ 5% to this simulated increase in HONOgand therefore may also be a minor source of NO2(g).
As a result of both reaction sequences, both OHgand NOx
concentrations are found to increase compared to a simula-tion that neglects the aqueous phase chemistry of HNO4(aq)
and the photolysis of NO−3. This elevation in NOx results
in a reduction in the simulated perturbation of O3(g)due to
cloud. It has been speculated previously that clouds, in ad-dition to their radiative effects, exert a strong influence on OHg. However, as we have shown in this paper, the
regen-eration of OHgprovides a strong feedback mechanism and
reduces the influence of clouds on the overall oxidising ca-pacity of the marine boundary layer. The effect of introduc-ing deliquescent aerosol below the cloud layer into the sim-ulations, using the approach of our model, is rather insignif-icant due to the limited uptake of HNO4(g)in the aerosol
as-sociated water. We therefore suggest that future modelling studies concerned with the heterogeneous effects of cloud on gas phase oxidants include the HNO4(g) reaction sequence
as presented here. However, considering the large uncertain-ties involved with the aqueous phase chemistry, mechanism, the computational limitations of including such chemistry, and the moderate effects on photo-chemistry of including the aqueous phase mechanism relative to other uncertainties cur-rently associated with 3D global CTMs, we do not feel that the aqueous phase chemistry of HNO4(g) should be
imple-mented until a more sophisticated and less uncertain under-standing of heterogeneous uptake becomes available. Fur-thermore, we suggest that more laboratory work should be conducted concerning the rate of uptake of HOx and NOx
species by concentrated salt solution.
Acknowledgements. J. E. W. gratefully acknowledges financial support from the COACH funding program and the Foundation for Fundamental Research on Matter (FOM).
References
Anastasio, C. and McGregor, K. G.: Chemistry of fog waters in Cal-ifornia’s Central Valley: 1. In situ photoformation of hydroxyl radical and singlet molecular oxygen, Atmos. Enviro., 35, 1079– 1089, 2001.
Baboukas, B. D., Kanakidou, M., and Milhalopolous, N.: Car-boxylic acids in gas and particulate phase above the Atlantic Ocean, J. Geophys. Res., 105, 14 459–14 471, 2000.
Bambauer, A., Brantner, B., Paige, M., and Novakov, T.: Labora-tory study of NO2reaction with dispersed and bulk liquid water, Atmos. Environ, 20, 3225–3332, 1994.
Becker, K. H., Kleffmann, J., Negri, R. M., and Wiesen, P.: Solu-bility of nitrous acid (HONO) in ammonium sulphate solutions, J. Chem. Soc. Faraday. Trans., 94, 1583–1586, 1998.
Behnke, W., George, C., Scheer, V., and Zetzsch, C.: Production and decay of ClNO2from the reaction of gaseous N2O5with
NaCl solution: Bulk and aerosol experiments, J. Geophys. Res., 102, 3795–3804, 1997.
Brune, W. H., et al.: OH and HO2chemistry in the North Atlantic free troposphere, Geophys. Res. Lett., 26, 3077–3080, 1999. Calvert, J. G., Yarwood, G., and Dunker, A. M.: An evaluation
of the mechanism of nitrous acid formation in the urban atmo-sphere, Research on Chem. Interm., 20, 463–502, 1994. Chameides, W. L. and Davis, D. D.: The free radical chemistry of
cloud droplets and its impact upon the composition of rain, J. Geophys. Res., 87, 4863–4877, 1982.
Cooke, W. F., Jennings, S. G., and Spain, T. G.: Black carbon measurements at Mace Head 1989–1996, J. Geophys. Res., 102, 25 339–25 346, 1997.
Crutzen, P. J.: Ozone in the troposphere, in Composition, Chemistry and climate of the Atmosphere, (Ed) Singh, H. B., pp 349–393, Van Nostrand Reinhold, New York, 1995.
Davies, J. A. and Cox, R. A.: Kinetics of the heterogeneous reaction of HNO3with NaCl: Effect of water vapour, J. Phys. Chem., 102,
7631–7642, 1998.
DeMore, W. B., Sander, S. P., Golden, G. M., Hampson, R. F., Kurylo, M. J., Howard, C. J., Ravishankara, A. R., Kolb, C. E., and Molinda, M. J.: Chemical kinetics and Photochemical data for use in stratospheric modeling, Jet Propulsion Labora-tory, Pasadena, CA, JPL publication, 92–94, 1997.
Dentener, F. J. and Crutzen, P. J.: Reaction of N2O5on tropospheric
aerosols: impact on the global distributions of NOx, O3and OH,
J. Geophys. Res., 98, 7149–7162, 1993.
Dentener, F. J., Williams, J. E., and Metzer, S. M.: The Aqueous Phase reaction of HNO4: the impact on tropospheric chemistry,
J. Atmos. Chem., accepted for publication, 2001.
Duynkerke, P. G. and Driedonks, A. G. M.: A model for the turbu-lent structure of the Stratocumulus-topped atmospheric boundary layer, J. Atmos. Sci., 44, 43–64, 1987.
Fenter, F. F., Caloz, F., and Rossi, M. J.: Heterogeneous kinetics of N2O5uptake on salt, with a systematic study of the role of surface presentation (for N2O5and HNO3), J. Phys. Chem., 100,
1008–1019, 1996.
Fitzgerald, J. W.: Approximation formulas for the equilibrium size of an aerosol particle as a function of its dry size and composition and the ambient relative humidity, J. Appl. Meteorol., 14, 1044– 1049, 1975.
Flossmann, A. I., Hall, W. D., and Pruppacher, H. R.: A theo-retical study of the wet removal of atmospheric pollutants, In:
The redistribution of aerosol particles captured through nucle-ation and impactnucle-ation scavenging by growing cloud droplets, J. Atmos. Sci., 42, 583–606, 1985.
Gerecke, A., Theilman, A., Gutzwiller, A., and Rossi, M. J.: The chemical kinetics of HONO formation resulting from heteroge-neous interaction of NO2with flame soot, Geophys. Res. Lett.,
25, 2453–2456, 1998.
Greadel, T. E. and Weschler, C. J.: Chemistry within aqueous atmo-spheric aerosols and raindrops, Rev. Geophys. Space. Phys., 19, 505–539, 1981.
Grenfell, J. L., et al.: Tropospheric box-modelling and analytical studies of the hydroxyl (OH) radical and related species: Com-parison with observations, J. Atmos. Chem., 33, 183–214, 1999. Harrison, R. M., Peak, J. D., and Collins, G. M.: Tropospheric cycle
of nitrous acid, J. Geophys. Res., 101, 14 429–14 439, 1996. Harrison, R. M. and Collins, G. M.: Measurements of reaction
coefficients of NO2and HONO on aerosol particles, J. Atmos.
Chem., 30, 397–406, 1998.
Heikes, B. G., Lee, M., Jacob, D. J., Talbot, R. W., Bradshaw, J. D., Singh, H. B., Blake, D. R., Anderson, B. E., Fuelberg, H. E., and Thompson, A. M.: Ozone, hydroperoxides, oxides of nitrogen, and hydrocarbon budgets in the marine boundary layer over the South Atlantic, J. Geophys. Res., 101, 24 221–24 234, 1996. Herrmann, H., Ervens, B., Jacobi, H.-W., Wolke, R., Nowacki, P.,
and Zellner, R.: CAPRAM 2.3: A chemical aqueous phase radi-cal mechanism for tropospheric Chemistry, J. Atmos. Chem, 36, 231–284, 2000a.
Herrmann, H., Buxton, G. V., Salmon, G. A., Mirabel, P., George, C., Lelieveld, J., and Dentener, F.: Model Development for Tro-pospheric Aerosol and Cloud Chemistry (MODAC), final report, EU contract No. ENV4-CT97-0388, 2000b.
Houghton, J. T., Filho, M., Callander, B. A., Harris, N., Katenberg, A., and Maskell, K. (Eds): Intergovernmental Panel on Climate Change (IPCC), Climate Change 1995, The science of climate change, Cambridge University Press, Cambridge, UK, 1995. Jacob, D. J.: The chemistry of OH in remote clouds and its role in
the production of formic acid and peroxymonosulphate, J. Geo-phys. Res., 91, 9807–9826, 1986.
Jacob, D. J.: Heterogeneous chemistry and tropospheric ozone, At-mos. Environ., 34, 2131–2159, 2000.
Jaegle, W., et al.: Photochemistry of HOxin the upper troposphere
at northern mid-latitudes, J. Geophys. Res., 105, 3877–3892, 2000.
Kalberer, M., Ammann, M., Arens, F., Gaggeler, H. W., and Baltensperger, U.: Heterogeneous formation of nitrous acid (HONO) on soot aerosol particles, J. Geophys. Res., 104, 13 825–13 832, 1999.
Kleffmann, J., Becker, K. H., Lackoff, M., and Wiesen, P.: Het-erogeneous conversion of NO2on Carbonaceous surfaces, Phys.
Chem. Chem. Phys., 24, 5443–5450, 1999.
Krischke, U., Staubes, R., Brauers, T., Gautrois, M., Burkert, J., Stobener, D., and Jaeschke, W.: Removal of SO2from the marine
boundary layer over the Atlantic Ocean: a case study on the ki-netics of the heterogeneous S(IV) oxidation on marine aerosols, J. Geophys. Res., 105, 14 413–14 422, 2000.
Lammel, G., Perner, D., and Warneck, P.: Decomposition of Perni-tric Acid in Aqueous solution, J. Phys. Chem., 6141–6144, 1990. Landgraf, J. and Crutzen, P. J.: An efficient method for ‘On-Line’ calculations of photolysis and heating rates, J. Atmos. Sci., 55,


![Fig. 4. Comparison of [HO x ] g and [NO x ] g species at 540 m above sea-level over a 5-day simulation to show the differences introduced by cloud and aerosol/cloud interactions](https://thumb-eu.123doks.com/thumbv2/123doknet/14657763.553320/9.892.72.431.91.621/comparison-species-level-simulation-differences-introduced-aerosol-interactions.webp)
![Fig. 5. Comparison of [HONO] g at 1060 m above sea-level for a 5 day simulation.The reader is referred to diagram 2 regarding devel-opment of the cloud layer.(—) [HONO] g profile for case (II) (- - -) [HONO] g profile for (a) case (III), (b) case (V) and](https://thumb-eu.123doks.com/thumbv2/123doknet/14657763.553320/10.892.463.820.90.493/comparison-simulation-reader-referred-diagram-regarding-profile-profile.webp)
![Fig. 6. Comparison of [NO] g at 1060 m above sea-level for a 5 day simulation.The reader is referred to diagram 2 regarding develop-ment of the cloud layer.(—) [NO] g profile for case (II) (- - -) [NO] g profile for (a) case (III), (b) case (V) and (c) ca](https://thumb-eu.123doks.com/thumbv2/123doknet/14657763.553320/11.892.461.821.95.492/comparison-simulation-referred-diagram-regarding-develop-profile-profile.webp)
![Table 5. Ratios between run V/I to highlight the effect of that heterogeneous conversion of NO 2 to NO has on [HO x ] g .and [NO x ] g](https://thumb-eu.123doks.com/thumbv2/123doknet/14657763.553320/12.892.92.803.133.376/table-ratios-run-highlight-effect-heterogeneous-conversion-ho.webp)

