HAL Id: inserm-00143810
https://www.hal.inserm.fr/inserm-00143810
Submitted on 27 Apr 2007
HAL is a multi-disciplinary open access archive for the deposit and dissemination of sci-entific research documents, whether they are pub-lished or not. The documents may come from teaching and research institutions in France or abroad, or from public or private research centers.
L’archive ouverte pluridisciplinaire HAL, est destinée au dépôt et à la diffusion de documents scientifiques de niveau recherche, publiés ou non, émanant des établissements d’enseignement et de recherche français ou étrangers, des laboratoires publics ou privés.
cytokine content.
Carine Chavey, Frédéric Bibeau, Sophie Gourgou-Bourgade, Sandrine
Burlinchon, Florence Boissière, Daniel Laune, Sylvie Roques, Gwendal
Lazennec
To cite this version:
Carine Chavey, Frédéric Bibeau, Sophie Gourgou-Bourgade, Sandrine Burlinchon, Florence Boissière, et al.. Oestrogen receptor negative breast cancers exhibit high cytokine content.. Breast Cancer Research, BioMed Central, 2007, 9 (1), pp.R15. �10.1186/bcr1648�. �inserm-00143810�
Estrogen-receptor negative breast cancers exhibit a high cytokine content
Carine Chavey1*, Frédéric Bibeau2*, Sophie Gourgou-Bourgade3, Sandrine Burlinchon1, Florence
Boissière2, Daniel Laune4, Sylvie Roques2and Gwendal Lazennec1 
1
INSERM, U844, Hôpital Saint Eloi - Bâtiment INM - 80 rue Augustin Fliche - BP 74103 - 34091 Montpellier cedex 5, France
2
CRLC Val d'Aurelle, Pathology department, 208 rue des apothicaires, 34298 Montpellier Cedex, France
3
CRLC Val d'Aurelle, Biostatistics Unit, 208 rue des apothicaires, 34298 Montpellier Cedex, France
4
UMR 5160 CNRS, Centre de Pharmacologie et Biotechnologie pour la Sante, Faculte de Pharmacie, 15 avenue Charles Flahault, BP 14491, 34093 Montpellier Cedex 5, France
* These authors have equally contributed to this work
Corresponding Author:
Dr Gwendal Lazennec INSERM U844
Hôpital Saint Eloi Bâtiment INM, 80, rue Augustin Fliche BP 74103 -34091 Montpellier cedex 5, France
Tel: (33) 4 99 63 60 00; Fax: (33) 4 99 63 60 20 E-mail: [email protected]
HAL author manuscript inserm-00143810, version 1
ABSTRACT
Introduction
Emerging hypothesis suggest that cytokines could play an important role in cancer as potential
modulators of angiogenesis and leukocyte infiltration.
Methods
A novel multiplexed flow cytometry technology was used to measure the expression of 17 cytokines
(IL-1β, IL-2, IL-4, IL-5, IL-6, IL-7, IL-8, IL-10, IL-12 (p70), IL-13, IL-17, G-CSF, GM-CSF, IFN-γ,
MCP-1, MIP-1β, TNF-α) at the protein level in 105 breast carcinoma. B lymphocytes, T
lymphocytes and macrophages content was determined by immunohistochemistry.
Results
Fourteen of the 17 cytokines were expressed in breast carcinoma, whereas only 9 cytokines could be
detected in normal breast. Most cytokines were more abundant in breast carcinoma than in normal
breast, with 6, 8, G-CSF, IFN-γ, MCP-1 and MIP-1β being very abundant. 2, 6, 8,
IL-10, IFN-γ, MCP-1, MIP-1β, TNF-α and to a lower extent IL-1β and IL-13 exhibited an expression
inversely correlated to estrogen receptor (ER) and progesterone receptor status. Most cytokines were
not correlated to the age of cancer diagnosis, the tumor size, the histologic type or the lymph node
status. On the other hand, IL-1β, IL-6, IL-8, IL-10, IL-12, MCP-1, MIP-1β were more abundant in
high grade tumors compared to low grade tumors. In addition, IL-8 and MIP-1β were more
expressed in HER2-positive than in HER2-negative patients. The expression of most of the
studied-cytokines was correlated to AP-1 levels, which is known to regulate numerous studied-cytokines. MCP-1,
MIP-1β overexpression were linked to B lymphocyte, T lymphocyte and macrophage infiltration,
whereas high levels of IL-8 were correlated to a high macrophage content in tumor. Moreover, we
showed that IL-8 positive tumors displayed an increased vascularization.
Conclusions
We show here that multiple cytokines were overexpressed in ER-negative breast carcinoma and that
the three major cytokines were correlated to inflammatory cell component, which could account for
the aggressiveness of these tumors.
INTRODUCTION
Breast cancer represents the first leading cause of cancer death among women in developed countries
[1]. Among the different prognostic factors, lack of estrogen receptor has been consistently
associated with a poorer prognosis [2]. Most human breast cancers express ERα, and the presence of
this receptor is generally considered as an indication of hormone-dependence [3]. In addition to ERα,
cytokines are now emerging as potential factors involved in breast carcinogenesis [4, 5]. Cytokines
constitute a diverse group of proteins comprising hematopoietic growth factor, interferons,
lymphokines and chemokines [6].
Cytokines are produced by many cell populations, but the predominant suppliers are helper T cells
(Th) and macrophages. Helper T cells have two important functions: to stimulate cellular immunity
and inflammation, and to stimulate B cells to produce antibody. Two functionally distinct subsets of
T cells (Th1 and Th2) secrete cytokines which promote these different activities. Th1 cells produce
IL-2 and IFNγ, which activate cytotoxic lymphocytes (Tc) and macrophages to stimulate cellular
immunity and inflammation [7]. Th2 cells secrete IL-4 and IL-5 which stimulate antibody production
by B cells.
Moreover, it becomes evident that cancer tissues also produce cytokines [4, 8]. Numerous studies
have analyzed the expression of diverse cytokines independently in breast cancer but only few have
examined the profile of a group of different cytokines in the site of the tumor. In the present study,
we have screened 17 members of the cytokine family (Interleukin-1β/ IL-1β, IL-2, IL-4, IL-5, IL-6,
IL-7, IL-8, IL-10, IL-12 (p70), IL-13, IL-17, Granulocyte Colony-Stimulating Factor/ G-CSF,
Granulocyte Macrophage-Colony-Stimulating Factor / GM-CSF, IFN-γ, Monocyte Chemoattractant
Protein-1/ MCP-1, Macrophage Inflammatory Protein-1-β/ MIP-1β, TNF-α) in breast cancer tissues.
We found that most cytokines were overexpressed in breast cancer compared to normal tissues. IL-2,
IL-6, IL-8, IL-10, INF-γ, MCP-1, MIP-1β, TNF, IL-1β and IL-13 were inversely correlated with
estrogen and progesterone receptor status. Most of the cytokines were not correlated with the age of
patient, the tumor size, the histologic type or the lymph node status. IL-1β, IL-6, IL-8, IL-10, IL-12,
MCP-1 and MIP-1β were abundantly expressed in high grade tumors. Moreover, IL-8 and MIP-1β
were linked to HER2 expression. In addition, IL-8 positive tumors displayed a higher vascularization.
IL-8, MCP-1 and MIP-1β robust expression was correlated to a strong inflammatory cell component.
MATERIALS AND METHODS
Patients and samples.
Breast tumor surgical specimens were selected from the files of the Pathology Department tumor
bank. Breast biopsies were surgical waste, that did not compromise the legal sample for diagnosis
accuracy and which did not undergo genetic identification. The samples were selected by a
pathologist on fresh surgical specimens immediately after resection. Mirror paraffin blocks were
performed at the same time to ensure the tumoral nature of the tissue. When possible, normal breast
tissues were also collected in the vicinity of the tumor. All the patients met the following criteria:
primary unilateral, non-metastatic breast carcinoma, complete clinical, histological and biological
information available. Clinical and pathological characteristics of the patients are reported in
Supplemental Table S1. The tumors consisted of invasive carcinoma, mainly ductal and lobular and
rare other subtypes (mixed ductal and lobular carcinoma, medullary carcinoma, apocrine carcinoma).
The tumors were graded according to the modified Nottingham SBR grade [9] and categorized
according the AJCC sixth edition for the pTNM staging. Estrogen receptor (ER)-α, progesterone
receptor (PR) and HER2 status were determined at the protein level by immunohistochemistry. When
equivocal, HER2 results were confirmed by fluorescence in-situ hybridization (FISH).
Immunohistochemistry and FISH analysis
Representative tissue sections from cases of invasive breast carcinomas were fixed in 10% formalin
or in alcohol-formalin-acetic acid and embedded in paraffin. Sections from each case were
deparaffinized, rehydrated and subsequently subjected to heat-induced antigen retrieval by immersing
them, depending on the antibody, either in a water bath with a sodium citrate buffer (pH 6) or an
EDTA buffer (pH 8). Immunohistochemistry (IHC) was performed using the Dako autostainer
(Dako, Glostrup, Denmark). Then, the sections were incubated with the following primary
antibodies: ERα (Novocastra, Newcastle Upon Tyne, U.K, clone 6F11, monoclonal), PR
(DakoCytomation, clone PgR636, monoclonal) and HER 2 (DakoCytomation, A0485, polyclonal).
They were respectively used at 1: 50, 1:100 and 1:1500 dilution with an incubation time of 30 min.
Antibody was localized using the LSAB®2 Detection System (Dako). Diaminobenzidine (DAB,
Dako) was used as the chromogen and the sections were lightly counterstained with hematoxylin. ER
and PR expression was considered positive when at least 10 % of invasive tumoral cells showed a
nuclear staining, whatever the intensity. For HER2, the IHC score was given according to the
Herceptest®scoring system, i.e. 0, absence of membranous staining or < 10% positive cells; 1+, >
10% stained cells with a weak and incomplete membranous staining; 2+, >10% stained cells with a
weak or moderate complete membranous staining; 3+, >10% stained cells with a strong and
complete membranous staining. A case was considered to be HER2 over-expressed if it scored 3+. A
case scoring 2+ was considered HER2 over-expressed only if FISH analysis using the PathVysion
HER-2 Probe kit (Vysis, Downer’s grove, IL, USA) showed HER2 gene amplification.
Inflammatory cell component was evaluated on a subset of 10 tumors displaying high levels of IL8
and 10 tumors with low IL8 content using CD3 (T lymphocyte lineage), CD20 (B lymphocyte
lineage) and CD68 (macrophages) antibodies. The intensity of each pattern of inflammatory infiltrate
was graded as absent (0), minimal (1), moderated (2) or marked (3). The staining result for each
antibody was scored by two investigators blinded for the IL8 status of the patients. Vessels were
assessed within the invasive carcinoma in CD31-stained sections. The most vascular areas were
selected by examination at low power (x40 magnification). The number of clusters or single cells
stained for CD31 was recorded from the three most vascular x400 fields (0.18mm², each) and the
vascular density (number of vessels/mm²) was calculated.
Protein extract preparation
Biopsies were first crushed in liquid nitrogen. The powder was then resuspended in TEG (10 mM
Tris-HCl, pH 7.4, 1.5 mM EDTA, and 10% glycerol) containing protease inhibitors (5 µg/ml
aprotinin, leupeptin and pepstatin A and 0.1 mM phenylmethylsulfonyl fluoride). The mixture was
then sonicated and the cellular debris were pelleted by centrifugation at 13,000g for 20 minutes at
4°C in microfuge tubes.
Cytokine multiplexed Bioplex assay
A panel of 17 cytokines (IL-1β, IL-2, IL-4, IL-5, IL-6, IL-7, IL-8, IL-10, IL-12 (p70), IL-13, IL-17,
G-CSF, GM-CSF, IFN-γ, MCP-1, MIP-1β, TNF-α) was measured in duplicate using the bioplex
cytokine multiplexed assay (BioRad) according to the instructions of the manufacturer (see
supplemental Methods). This novel multiplexed, particle based, flow cytometric assay uses
anti-cytokine monoclonal antibodies linked to microspheres incorporating distinct proportions of two
fluorescent dyes. 500 µg of total protein extracts of breast biopsies was used to measure cytokine
concentration. For each cytokine, 8 standards ranging from 2 to 32,000 pg/ml were used, and the
minimum detectable dose was < 10 pg/ml. The validation of the assay was done by comparing the
results obtained by bioplex measure of IL-8 with a conventional ELISA measure of IL-8 (see Suppl.
Fig. 1).
Gel shift assays
Gel shift assays were performed as previously described [10]. Briefly, 30,000 cpm of the [32
P]-labeled double-strand oligonucleotides were combined with 1 µg poly (dI-dC) and 5 µg of total cell
extract. The reaction buffer contained 20 mM Hepes, pH 7.9; 1 mM DTT; 50 mM KCl; 10%
glycerol; 2.5 mM MgCl2. Protein-DNA complexes were separated from the free probe by
non-denaturating gel electrophoresis with 4% polyacrylamide gels in 0.5 X TBE. Oligonucleotides used
were: AP-1 cons: CGCTTGATGAGTCAGCCGGAA; The levels of shifted complexes were detected
and quantified by counting with a Fujix-Bas 1000.
Statistical analysis
Data was summarized by frequency for categorical variables and by median and range for continuous
variables. Correlation between variables (cytokines) was evaluated with the Spearman correlation
coefficient after LOG transformation. Associations between categorical variables were examined
using χ2 analysis.
The median values of analyzed interleukins expression were compared using Kruskal-Wallis test
according to the clinical data (Age, ER, PR, SBR, pT, pN) or analysis of variance (ANOVA) if
possible.
For all statistical analysis, a p-value of less than 0.05 was considered statistically significant.
RESULTS
Breast tumors overexpress cytokines
A total of 105 primary unilateral, non-metastatic breast carcinoma from patients (Supplemental Table
S1) and 13 healthy breast biopsies were analyzed for cytokine expression at the protein level (Table
1). This was made possible by the use of a novel technology coupling Elisa to FACS analysis, which
allows the detection in a single well of multiple proteins. We observed that healthy breast samples
expressed very low levels of cytokines, except for IFN-γ and MIP-1β (Table 1). On the contrary,
breast tumors displayed high levels of IL-6, G-CSF, IFN-γ and extremely high levels of IL-8, MCP-1
and MIP-1β. 5, 17, GM-CSF were not detected in both normal and tumor samples, whereas
IL-1β, IL-2, IL-4, G-CSF and IL-10, were only detected in breast carcinoma. IL-6, IL-8, IL-12, IL-13,
IFN-γ, MCP-1, MIP-1β and TNF-α were significantly more abundant in carcinoma compared to
normal breast. The greatest differences were obtained for IL-8, MCP-1, MIP-1β which were 60 fold
more abundant in carcinoma than in healthy breast, followed by IL-6 which about 14 fold
overexpression in carcinoma. In summary, we demonstrate that breast tumors express higher levels of
multiple cytokines compared to normal tissues.
Correlation between cytokines and Estrogen (ER) and Progesterone (PR) receptors
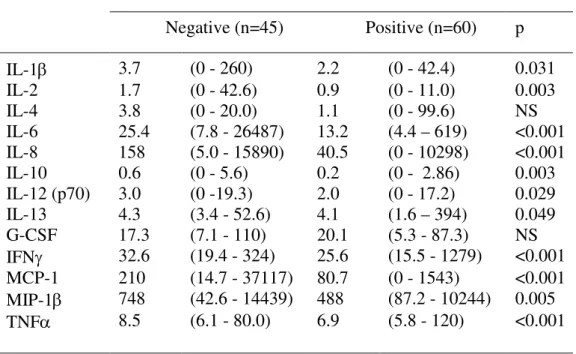
We next evaluated the possible correlation between cytokine expression and ER levels (Table 2). We
observed that IL-4 and G-CSF were not correlated to ER status. On the other hand, IL-2, IL-6, IL-8,
IL-10, IFN-γ, MCP-1, MIP-1β, TNF-α and to a lower extent IL-1β and IL-13 were significantly
overexpressed in ER-negative tumors compared to ER-positive tumors, with the greatest differences
observed for IL-8 and MCP-1.
We performed the same type of analysis to correlate cytokine levels with PR expression (Table 2).
IL-2 and IL-13 were not correlated to PR status, whereas IL-1β, IL-6, IL-8, IL-10, INF-γ, MCP-1,
MIP-1β, TNF-α and to a lower extent IL-4, IL-12 and G-CSF were more abundant in PR-negative
tumors compared to PR-positive tumors. The greatest differences were obtained for IL-8, IL-6 and
MCP-1.
The fact that some cytokines were correlated to either ER or PR, led us to analyze the distribution of
all cytokines by combining both factors (Supplemental data Table S2). Three categories were
designed, corresponding to true ER-negative (ER-/PR-) or ER-positive (ER+/PR+) compared to
intermediate status (ER-/PR+ or ER+/PR-). This showed that IL-1β, IL-2, IL-6, IL-8, IL-10, IL-12,
IFN-γ, MCP-1, MIP-1β and TNF-α were inversely correlated to true ER status. The most abundant
cytokines in true ER-negative breast carcinoma were IL-8, MCP-1 and MIP-1β.
Correlation with other clinical parameters
We then evaluated whether cytokine expression could be linked to clinical parameters such as tumor
size, lymph node status, histological grade or the age of the patients. Cytokine profile was not linked
to tumor size or to the histological type. We did not observe any correlation between the age of
patients at cancer diagnosis and cytokine expression, except for IL-1β, which was inversely
correlated to age: (≤ 50 years: 3.14 (0.2 194.2), 5065 years: 2.13 (0 42.4), >65 years: 1.9 (0
-260.6); p = 0.033). Lymph node status was not linked to any of the analyzed cytokine.
As ER-negative tumors are generally of higher grade than ER-positive tumors (which is confirmed in
our samples, data not shown), we determined whether cytokine levels could be correlated to the
grade. Most of the cytokines which were preferentially present in ER-negative tumors (IL-1β, IL-6,
IL-8, IL-10, IL-12, MCP-1, MIP-1β) were also more abundant in high grade tumors (Table 3).
Another factor which is frequently linked to the grade and to ER-status is the level of HER2. We
observed a correlation between HER2 levels and IL-8 and MIP-1β, which were more expressed in
HER2 positive patients (IL8: HER2negative: 50.8 (0 15,890); HER2positive: 192.6 (23.7
8,357); p= 0.014; MIP1β: HER2negative: 514.9 (42.6 14,439); HER2positive: 976.1 (44.6
4,978); p= 0.021). All these data suggest that high cytokine levels are associated with poor prognostic
factors such as high grade, ER-negative status, and HER2 positive tumors.
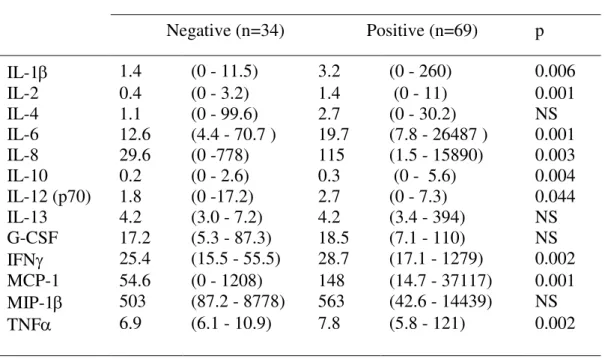
AP-1 transcription factors are known to regulate the expression of many cytokines. To evaluate this
issue, we performed gel shift assays measuring the global AP-1 binding to specific DNA binding
sites. As reported by others [11], AP-1 was more abundant in ER-negative tumor samples compared
to ER-positive tumors (p<0.001). There was also a higher HER2 level in AP-1-positive tumors
(p=0.025). On the other hand, AP-1 status was not correlated to PR expression, to the grade, the size
of the tumor and the lymph node status. Interestingly, high AP-1 levels correlated with high
expression of several cytokines, including IL-1β, IL-2, IL-6, IL-8, IL-10, IL-12, IFN-γ, MCP-1 and
TNF-α (Table 4). Among these cytokines, the greatest differences were observed for IL-8 and
MCP-1, which displayed respectively a 3.9 and 2.7 fold higher expression in AP-1-positive tumors
compared to AP-1-negative tumors (Table 4).
Tumors expressing high levels of IL-8 display a high vascularization
We next focused our attention on the possible association between the high expression of IL-8 and
vascularization. We analyzed 10 tumors displaying high levels of IL-8 and 10 tumors with a low IL-8
content. A microscopic analysis showed that tumors with a high expression of IL-8 were also more
vascularized (median of 125 vessels/mm2 compared to 48 vessels/ mm2 in low IL-8 tumors; p=
0.0002) (Table 5). Overall, these results suggest that IL-8 expression is associated with a high
neovascularization.
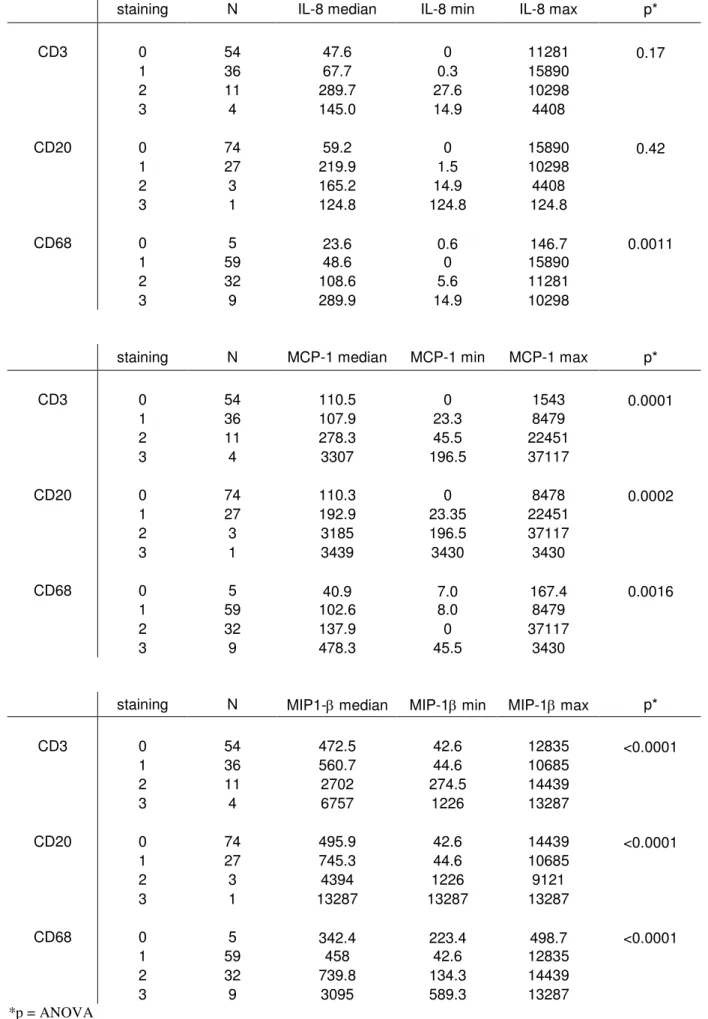
Leukocyte infiltration is correlated to high levels of cytokines
As IL-8, MCP-1 and MIP-1β, the most highly expressed chemokines in cancer tissues, are potent
chemotactic molecules, we investigated whether their expression could be correlated to tumoral
leukocyte infiltration. We performed a complete immunohistochemical analysis of our whole
collection of tumor using CD3 (B lymphocytes), CD20 (T lymphocytes) and CD68 (macrophages)
antibodies. A representative picture is shown on figure 1. Normal breast displayed no to low staining
whereas, breast cancer tissues exhibited a complete range of leukocyte infiltration from low to high
levels. Our results show that high IL-8 levels were correlated to high macrophage infiltration,
whereas strong expression of MCP-1 and MIP-1β was correlated to robust presence of B
lymphocytes, T lymphocytes and macrophages (Table 6).
DISCUSSION
It is well known that the interactions of tumor cells with their microenvironment may affect tumor
growth and metastasis formation. Among these, inflammatory cells and cytokines were recently
suggested to play a key role in breast carcinoma (for review, [4]).
A previous study of breast cancer patients had shown that IL-8 RNA was more abundant in the
neoplastic compared to normal population, whereas no difference could be seen for 1α, 1β,
IL-4, or IL-6 [12]. In addition, transcripts for IL-2, IL-IL-4, IL-5, IL-7, TNF-α and IFNγ were not detected
in either group [12, 13]. Increased seric levels of the IL-6, IL-8 and IL-10 have also been observed in
patients suffering from breast cancer compared to healthy women [14, 15]. Among the 17 cytokines
we analyzed, 8 were not detected in normal breast (IL-1β, IL-2, IL-4, IL-5, IL-10, IL-17, G-CSF,
GM-CSF) and 3 were absent from breast carcinoma (IL-5, IL-17, GM-CSF). With the exception of
IL-7, all cytokines which were present in both tissues, were significantly present at higher levels in
breast carcinoma.
To date, the correlation between cytokine expression and clinical parameters remains elusive. We
observed that IL-1β, IL-6, IL-8, IL-10, IL-12, MCP-1, MIP-1β correlated with the grade. In the same
line, IL-8 and MIP-1β were also linked to HER2 status, which is in agreement with reports
demonstrating that IL-8 is regulated by HER2 in breast cancer cell lines [16]. In addition, IL-1β was
inversely correlated to the age. IL-1β has been shown previously to be strongly expressed in high
grade invasive breast carcinoma compared to in situ ductal carcinoma or benign lesions [17]. In
contrast to these results, Green et al. did not observe any correlation between 1α, 1β, 4,
IL-6, IL-8, TNFα, TNFβ, IL-2, IL-5, IL-7 and IFNγ and tumor histological grade, patient age or lymph
node metastases in breast cancer patients, but this study analyzed only RNA levels [12].
Of particular note, our study shows an inverse correlation between the expression of ER and
cytokines, which is in agreement with other studies [8, 18]. An inverse correlation between IL-8 and
ER or PR in breast cancer biopsies has also been demonstrated [19]. Several studies have reported
that IL-1α, IL-1β or IL-6 levels correlated inversely with ER levels [20-22]. This inverse correlation
between cytokines and estrogen receptor status could not only reflect the higher aggressiveness of
this subtype of breast tumors but could also be the result of a direct regulation of cytokine expression
by ER. Several reports have demonstrated a direct down-regulation of cytokines by ER in different
organs. This is not only the case for IL-6 [23, 24] and IL-8 [8, 18], but also for IL1-β (for review,
[24]), IL-2 [25], IL-10 [26], IL-12 (for review, [27]), GM-CSF [24], IFN-γ [28, 29], MCP-1 [30, 31]
and TNF-α [24]. PR is also known to down-regulate the expression of a number of cytokines,
including IL-1β [32], IL-6 [30, 33], IL-8 [34], MCP-1 [32, 35] or TNF-α [32], which is in agreement
with our results.
According to our work, Th1 cytokines (IL-2, IFN-γ) or Th2 cytokines (such as IL-4, IL-5) are not the
major cytokines produced by the tumor. On the other hand, several cytokines produced by monocytes
(IL-1β, IL-6, MCP-1) or macrophages such as (IL-1β, IL-6, IL-8, MIP-1β, TNF-α) are highly
expressed by the tumor. We observed that tumors displaying high levels of IL-8 exhibited a
significantly higher vascularization. The role of IL-8 in breast cancer angiogenesis has also been
suggested by in vitro studies [18], but to our knowledge, our study is the first report of an association
between IL-8 levels and angiogenesis in breast cancer samples.
We showed here that tumors expressing high levels of MCP-1 and MIP-1β exhibited a higher content
in B lymphocytes, T lymphocytes and macrophages than tumors expressing low level of these
chemokines. In the same line, robust expression of IL-8 was correlated to a strong macrophage
infiltration. Our results are thus in agreement with previous studies which showed a correlation
between the number of tumor associated macrophages (TAM) and IL-6, IL-8 or MCP-1 levels in
breast and cervical cancers [36-38]. On the other hand, the correlation between MIP-1β and
macrophage infiltration has not been reported to date, nor the association of high levels o, MCP-1
and MIP-1β to B and T lymphocytes presence in breast carcinoma. The precise role of leukocytes in
tumors remains to be elucidated in larger studies to determine if they contribute or not to tumor
growth.
CONCLUSIONS
In conclusion, the pattern of expression of multiple cytokines in breast cancer tissues that we report is
the first step to understand the involvement of cytokines in breast cancer. Our data suggest that
cytokines could be involved in the aggressiveness of ER-negative breast tumors. In addition, the
robust expression of IL-8, MCP-1 and MIP-1β, the three major chemokines present in breast tumors,
is correlated to strong leukocyte infiltration. We thus believe that our work could be the basis to
study more precisely the role of these cytokines in breast cancer.
LIST OF ABBREVIATIONS
ER: Estrogen Receptor, G-CSF: Granulocyte Colony-Stimulating Factor, GM-CSF: Granulocyte
Macrophage-Colony-Stimulating Factor, IL-1β: 1β, IL-2: 2, IL-4:
4, IL-5: 5, IL-6: 6, IL-7: interleukin-7, IL-8: interleukin-8, IL-10:
Interleukin-10, IL-12: Interleukin-12, IL-13: Interleukin-13, IL-17: Interleukin-17, / IFN-γ: Interferon-γ, MCP-1:
Monocyte Chemoattractant Protein-1, MIP-1β: Macrophage Inflammatory Protein-1-β, PR:
Progesterone Receptor, TNF-α: Tumor-Necrosis-α
COMPETING INTERESTS
The authors declare that they have no competing interests.
AUTHORS' CONTRIBUTIONS
CC carried out the bioplex experiments and helped to draft the manuscript. FB interpreted the
immunhistochemistry slides and revised the manuscript. SGB performed all stastical analysis and
revised the manuscript. SB, SR and FB performed the immunohistochemistry experiments and FB
revised also the manuscript. DL was involved in the bioplex experiments. GL conceived the study,
supervised the work, drafted the manuscript, processed the biopsy samples, performed the Bioplex
and gel shift experiments.
ACKNOWLEDGEMENTS
This work was supported by grants from ARC (Association pour la Recherche contre le Cancer,
Grant No. 3582 (G.L.) and la Ligue Nationale contre le Cancer. C. Chavey was also supported by the
Ligue Nationale contre le cancer. S. Burlinchon was supported by ARTP. We are grateful to Dr. A.
Tsicopoulos for helpful discussions on the manuscript.
REFERENCES
1. Parkin DM, Bray F, Ferlay J, Pisani P: Global cancer statistics, 2002. CA Cancer J Clin 2005, 55(2):74-108.
2. Skoog L, Humla S, Axelsson M, Frost M, Norman A, Nordenskjold B, Wallgren A: Estrogen receptor levels
and survival of breast cancer patients. A study on patients participating in randomized trials of adjuvant therapy. Acta Oncol 1987, 26(2):95-100.
3. McGuire WL: Endocrine therapy of breast cancer. Annu Rev Med 1975, 26:353-363.
4. Wilson J, Balkwill F: The role of cytokines in the epithelial cancer microenvironment. Semin Cancer Biol 2002, 12(2):113-120.
5. Boon T, Van den Eynde B: Tumour immunology. Curr Opin Immunol 2003, 15(2):129-130.
6. Romagnani P, Lasagni L, Annunziato F, Serio M, Romagnani S: CXC chemokines: the regulatory link
between inflammation and angiogenesis. Trends Immunol 2004, 25(4):201-209.
7. Elenkov IJ, Chrousos GP: Stress Hormones, Th1/Th2 patterns, Pro/Anti-inflammatory Cytokines and
Susceptibility to Disease. Trends Endocrinol Metab 1999, 10(9):359-368.
8. Freund A, Chauveau C, Brouillet JP, Lucas A, Lacroix M, Licznar A, Vignon F, Lazennec G: IL-8 expression
and its possible relationship with estrogen-receptor-negative status of breast cancer cells. Oncogene
2003, 22(2):256-265.
9. Bloom HJ, Richardson WW: Histological grading and prognosis in breast cancer; a study of 1409 cases of
which 359 have been followed for 15 years. Br J Cancer 1957, 11(3):359-377.
10. Freund A, Jolivel V, Durand S, Kersual N, Chalbos D, Chavey C, Vignon F, Lazennec G: Mechanisms
underlying differential expression of interleukin-8 in breast cancer cells. Oncogene 2004,
23(36):6105-6114.
11. Bamberger AM, Methner C, Lisboa BW, Stadtler C, Schulte HM, Loning T, Milde-Langosch K: Expression
pattern of the AP-1 family in breast cancer: association of fosB expression with a well-differentiated, receptor-positive tumor phenotype. Int J Cancer 1999, 84(5):533-538.
12. Green AR, Green VL, White MC, Speirs V: Expression of cytokine messenger RNA in normal and
neoplastic human breast tissue: identification of interleukin-8 as a potential regulatory factor in breast tumours. Int J Cancer 1997, 72(6):937-941.
13. Venetsanakos E, Beckman I, Bradley J, Skinner JM: High incidence of interleukin 10 mRNA but not
interleukin 2 mRNA detected in human breast tumours. Br J Cancer 1997, 75(12):1826-1830. 14. Kozlowski L, Zakrzewska I, Tokajuk P, Wojtukiewicz MZ: Concentration of interleukin-6 (IL-6),
interleukin-8 (IL-8) and interleukin-10 (IL-10) in blood serum of breast cancer patients. Rocz Akad Med
Bialymst2003, 48:82-84.
15. Benoy I, Salgado R, Colpaert C, Weytjens R, Vermeulen PB, Dirix LY: Serum interleukin 6, plasma VEGF,
serum VEGF, and VEGF platelet load in breast cancer patients. Clin Breast Cancer 2002, 2(4):311-315. 16. Wen XF, Yang G, Mao W, Thornton A, Liu J, Bast RC, Le XF: HER2 signaling modulates the equilibrium
between pro- and antiangiogenic factors via distinct pathways: implications for HER2-targeted antibody therapy. Oncogene 2006.
17. Jin L, Yuan RQ, Fuchs A, Yao Y, Joseph A, Schwall R, Schnitt SJ, Guida A, Hastings HM, Andres J et al:
Expression of interleukin-1beta in human breast carcinoma. Cancer 1997, 80(3):421-434.
18. Lin Y, Huang R, Chen L, Li S, Shi Q, Jordan C, Huang RP: Identification of interleukin-8 as estrogen
receptor-regulated factor involved in breast cancer invasion and angiogenesis by protein arrays. Int J
Cancer2004, 109(4):507-515.
19. Pantschenko AG, Pushkar I, Anderson KH, Wang Y, Miller LJ, Kurtzman SH, Barrows G, Kreutzer DL: The
interleukin-1 family of cytokines and receptors in human breast cancer: implications for tumor progression. Int J Oncol 2003, 23(2):269-284.
20. Miller LJ, Kurtzman SH, Anderson K, Wang Y, Stankus M, Renna M, Lindquist R, Barrows G, Kreutzer DL:
Interleukin-1 family expression in human breast cancer: interleukin-1 receptor antagonist. Cancer Invest
2000, 18(4):293-302.
21. Singer CF, Kronsteiner N, Hudelist G, Marton E, Walter I, Kubista M, Czerwenka K, Schreiber M, Seifert M, Kubista E: Interleukin 1 system and sex steroid receptor expression in human breast cancer: interleukin
1alpha protein secretion is correlated with malignant phenotype. Clin Cancer Res 2003, 9(13):4877-4883. 22. Chiu JJ, Sgagias MK, Cowan KH: Interleukin 6 acts as a paracrine growth factor in human mammary
carcinoma cell lines. Clin Cancer Res 1996, 2(1):215-221.
23. Galien R, Garcia T: Estrogen receptor impairs interleukin-6 expression by preventing protein binding on
the NF-kappaB site. Nucleic Acids Res 1997, 25(12):2424-2429.
24. Pfeilschifter J, Koditz R, Pfohl M, Schatz H: Changes in Proinflammatory Cytokine Activity after
Menopause. Endocr Rev 2002, 23(1):90-119.
25. McMurray RW, Ndebele K, Hardy KJ, Jenkins JK: 17-beta-estradiol suppresses IL-2 and IL-2 receptor.
Cytokine2001, 14(6):324-333.
26. Carruba G, D'Agostino P, Miele M, Calabro M, Barbera C, Bella GD, Milano S, Ferlazzo V, Caruso R, Rosa ML et al: Estrogen regulates cytokine production and apoptosis in PMA-differentiated, macrophage-like
U937 cells. J Cell Biochem 2003, 90(1):187-196.
27. Salem ML: Estrogen, a double-edged sword: modulation of TH1- and TH2-mediated inflammations by
differential regulation of TH1/TH2 cytokine production. Curr Drug Targets Inflamm Allergy 2004, 3(1):97-104.
28. Curran EM, Judy BM, Newton LG, Lubahn DB, Rottinghaus GE, Macdonald RS, Franklin C, Estes DM:
Dietary soy phytoestrogens and ERalpha signalling modulate interferon gamma production in response to bacterial infection. Clin Exp Immunol 2004, 135(2):219-225.
29. Nakaya M, Yamasaki M, Miyazaki Y, Tachibana H, Yamada K: Estrogenic compounds suppressed
interferon-gamma production in mouse splenocytes through direct cell-cell interaction. In Vitro Cell Dev
Biol Anim2003, 39(8-9):383-387.
30. Kanda N, Watanabe S: 17Beta-estradiol inhibits MCP-1 production in human keratinocytes. J Invest
Dermatol2003, 120(6):1058-1066.
31. Fanti P, Nazareth M, Bucelli R, Mineo M, Gibbs K, Kumin M, Grzybek K, Hoeltke J, Raiber L, Poppenberg K
et al: Estrogen decreases chemokine levels in murine mammary tissue: implications for the regulatory
role of MIP-1 alpha and MCP-1/JE in mammary tumor formation. Endocrine 2003, 22(2):161-168. 32. Davies S, Dai D, Wolf DM, Leslie KK: Immunomodulatory and transcriptional effects of progesterone
through progesterone A and B receptors in Hec50co poorly differentiated endometrial cancer cells. J Soc
Gynecol Investig2004, 11(7):494-499.
33. Bamberger CM, Else T, Bamberger AM, Beil FU, Schulte HM: Dissociative glucocorticoid activity of
medroxyprogesterone acetate in normal human lymphocytes. J Clin Endocrinol Metab 1999,
84(11):4055-4061.
34. Loudon JA, Elliott CL, Hills F, Bennett PR: Progesterone represses interleukin-8 and cyclo-oxygenase-2 in
human lower segment fibroblast cells and amnion epithelial cells. Biol Reprod 2003, 69(1):331-337. 35. Kelly RW, Carr GG, Riley SC: The inhibition of synthesis of a beta-chemokine, monocyte chemotactic
protein-1 (MCP-1) by progesterone. Biochem Biophys Res Commun 1997, 239(2):557-561.
36. Fujimoto J, Sakaguchi H, Aoki I, Tamaya T: Clinical Implications of Expression of Interleukin 8 Related
to Angiogenesis in Uterine Cervical Cancers. Cancer Res 2000, 60(10):2632-2601.
37. Ueno T, Toi M, Saji H, Muta M, Bando H, Kuroi K, Koike M, Inadera H, Matsushima K: Significance of
macrophage chemoattractant protein-1 in macrophage recruitment, angiogenesis, and survival in human breast cancer. Clin Cancer Res 2000, 6(8):3282-3289.
38. Saji H, Koike M, Yamori T, Saji S, Seiki M, Matsushima K, Toi M: Significant correlation of monocyte
chemoattractant protein-1 expression with neovascularization and progression of breast carcinoma.
Cancer2001, 92(5):1085-1091.
Figure Legends
Fig. 1: Breast tumors display various levels of leukocyte infiltration.
Normal breast and breast carcinoma were stained for B lymphocytes B, T lymphocytes and
macrophages using CD3, CD20 and CD68 immunostaining. Representative pictures of normal
breast (A), tumor with weak leukocyte infiltration (B) and tumor with robust leukocyte infiltration
(C) are shown here.
Table 1 Cytokine are overexpressed in breast cancer
Biological Markers Median fg/µg protein (range) p
Cancer (n=105) Healthy breast (n=13) (C vs. H)
IL-1β 2.7 (0 - 260) 0 <0.0001 IL-2 1.2 (0 - 42.6) 0 <0.0001 IL-4 1.7 (0 - 99.6) 0 <0.0001 IL-5 0 0 IL-6 17.2 (4.4 - 26487) 1.2 (0 - 52.5) <0.0001 IL-7 0.7 (0 - 8.5) 1.1 (0.7 - 16.9) 0.047 IL-8 68.1 (0 - 15890) 1 (0 - 78.5) <0.0001 IL-10 0.3 (0 - 5.6) 0 <0.0001 IL-12 (p70) 2.3 (0 - 19.3) 1.4 (0.5 - 20.4) 0.005 IL-13 4.2 (1.6 - 394) 1.9 (1.2 - 21.6) <0.0001 IL-17 0 0 G-CSF 18.7 (5.3 - 110) 0 (0 - 49.2) <0.0001 GM-CSF 0 0 IFNγ 27.6 (15.5 - 1279) 16.6 (13.6 - 187) <0.0001 MCP-1 121 (0 - 37117) 1.9 (0 - 45.9) <0.0001 MIP-1β 559 (42.6 - 14439) 8.3 (5.0 - 142) <0.0001 TNFα 7.2 (5.8 - 121) 1.6 (1.3 - 23.2) <0.0001
Table 2 Cytokines are present at high levels in ER-negative and PR-negative breast tumors
Median Biological Markers fg/µg protein (range)
ER Negative (n=45) Positive (n=60) p IL-1β 3.7 (0 - 260) 2.2 (0 - 42.4) 0.031 IL-2 1.7 (0 - 42.6) 0.9 (0 - 11.0) 0.003 IL-4 3.8 (0 - 20.0) 1.1 (0 - 99.6) NS IL-6 25.4 (7.8 - 26487) 13.2 (4.4 – 619) <0.001 IL-8 158 (5.0 - 15890) 40.5 (0 - 10298) <0.001 IL-10 0.6 (0 - 5.6) 0.2 (0 - 2.86) 0.003 IL-12 (p70) 3.0 (0 -19.3) 2.0 (0 - 17.2) 0.029 IL-13 4.3 (3.4 - 52.6) 4.1 (1.6 – 394) 0.049 G-CSF 17.3 (7.1 - 110) 20.1 (5.3 - 87.3) NS IFNγ 32.6 (19.4 - 324) 25.6 (15.5 - 1279) <0.001 MCP-1 210 (14.7 - 37117) 80.7 (0 - 1543) <0.001 MIP-1β 748 (42.6 - 14439) 488 (87.2 - 10244) 0.005 TNFα 8.5 (6.1 - 80.0) 6.9 (5.8 - 120) <0.001 PR Negative (n=30) Positive (n=75) p IL-1β 5.3 (0 - 194) 2.3 (0 - 260) 0.008 IL-2 1.7 (0 - 6.6) 1.2 (0 - 42.6) 0.119 IL-4 4.6 (0 - 18.7) 1.1 (0 - 99.6) 0.040 IL-6 53.6 (9.9 - 26487) 13.7 (4.4 - 4312) <0.001 IL-8 505 (7.3- 15890) 48.7 (0 - 11281) <0.001 IL-10 0.8 (0 - 5.0) 0.2 (0 - 5.6) <0.001 IL-12 (p70) 3.1 (0 - 7.3) 2.0 (0 -19.3) 0.024 IL-13 4.3 (3.6 - 35.5) 4.1 (1.6 - 394) NS G-CSF 24.1 (7.1 - 110) 17.4 (5.3 - 103) 0.056 IFNγ 33.8 (23.7 - 324) 25.6 (15.5 - 1279) 0.002 MCP-1 404 (17.7 - 37717) 96.3 (0 - 1543) <0.001 MIP-1β 1121 (44.6 - 13287) 493 (42.6 - 14439) 0.001 TNFα 8.6 (6.2 - 37.2) 7.1 (5.8 - 121) 0.002 NS: non significative
Table 3 Most cytokines are abundant in high grade tumors
Biological Markers fg/µg protein (range)
Grade I (n= 17) Grade II (n=56) Grade III (n= 32) p
IL-1β 0.8 (0 - 260) 2.6 (0 - 102) 4.7 (0 - 194) 0.025 IL-2 0.9 (0 - 4.6) 1.2 (0 - 42.6) 1.4 (0 - 6.6) NS IL-4 3.4 (0 - 20.1) 0.6 (0 - 30.2) 3.9 (0 - 99.6) 0.037 IL-6 11.7 (7.8 - 4312) 14.1 (4.4 - 190) 30.6 (8.8 - 26487) <0.001 IL-8 43.9 (9.1 - 11281) 35.4 (0 - 8358) 186 (0.3 - 15890) <0.001 IL-10 0.2 (0 - 1.6) 0.2 (0 - 5.6) 0.7 (0 - 4.6) 0.030 IL-12 (p70) 1.4 (0 - 5.3) 2.1 (0 - 19.3) 2.9 (0.7 -17.2) 0.045 IL-13 4.1 (3.4 - 21.4) 4.2 (3.0 - 394) 4.2 (1.6 - 35.5) NS G-CSF 13.9 (7.1 - 87.3) 18.9 (5.3 - 110) 22.2 (9.9 - 79.2) NS IFNγ 26.8 (19.8 - 270) 25.6 (17.1 - 1279) 28.7 (15.5 - 324) NS MCP-1 96.3 (22.8 - 1208) 91.3 (0 - 22451) 201 (24.4 - 37117) 0.006 MIP-1β 451 (44.6 - 2674) 496 (42.6 - 14439) 776 (114 - 13287) 0.011 TNFα 7.15 (5.9 - 28.0) 7.1 (5.8 -120) 7.8 (6.2 - 37.2) NS NS: non significative
Table 4 Cytokine levels are correlated to AP-1 expression
Median Biological Markers fg/µg protein (range)
AP-1 Negative (n=34) Positive (n=69) p IL-1β 1.4 (0 - 11.5) 3.2 (0 - 260) 0.006 IL-2 0.4 (0 - 3.2) 1.4 (0 - 11) 0.001 IL-4 1.1 (0 - 99.6) 2.7 (0 - 30.2) NS IL-6 12.6 (4.4 - 70.7 ) 19.7 (7.8 - 26487 ) 0.001 IL-8 29.6 (0 -778) 115 (1.5 - 15890) 0.003 IL-10 0.2 (0 - 2.6) 0.3 (0 - 5.6) 0.004 IL-12 (p70) 1.8 (0 -17.2) 2.7 (0 - 7.3) 0.044 IL-13 4.2 (3.0 - 7.2) 4.2 (3.4 - 394) NS G-CSF 17.2 (5.3 - 87.3) 18.5 (7.1 - 110) NS IFNγ 25.4 (15.5 - 55.5) 28.7 (17.1 - 1279) 0.002 MCP-1 54.6 (0 - 1208) 148 (14.7 - 37117) 0.001 MIP-1β 503 (87.2 - 8778) 563 (42.6 - 14439) NS TNFα 6.9 (6.1 - 10.9) 7.8 (5.8 - 121) 0.002
Table 5 IL-8 expression is correlated to angiogenesis IL-8 Vessels/mm2 - 48 - 72 - 53 - 44 - 30 - ND - 57 - 46 - 63 - 20 + 244 + 128 + 78 + 279 + 116 + 209 + 124 + 94 + 81 + 359
• Hematoxylin Eosin Saffron
Table 6 MCP-1, MIP-1ββββ and IL-8 expression and leukocyte infiltration
staining N IL-8 median IL-8 min IL-8 max p*
CD3 0 54 47.6 0 11281 0.17 1 36 67.7 0.3 15890 2 11 289.7 27.6 10298 3 4 145.0 14.9 4408 CD20 0 74 59.2 0 15890 0.42 1 27 219.9 1.5 10298 2 3 165.2 14.9 4408 3 1 124.8 124.8 124.8 CD68 0 5 23.6 0.6 146.7 0.0011 1 59 48.6 0 15890 2 32 108.6 5.6 11281 3 9 289.9 14.9 10298
staining N MCP-1 median MCP-1 min MCP-1 max p*
CD3 0 54 110.5 0 1543 0.0001 1 36 107.9 23.3 8479 2 11 278.3 45.5 22451 3 4 3307 196.5 37117 CD20 0 74 110.3 0 8478 0.0002 1 27 192.9 23.35 22451 2 3 3185 196.5 37117 3 1 3439 3430 3430 CD68 0 5 40.9 7.0 167.4 0.0016 1 59 102.6 8.0 8479 2 32 137.9 0 37117 3 9 478.3 45.5 3430
staining N MIP1-β median MIP-1β min MIP-1β max p*
CD3 0 54 472.5 42.6 12835 <0.0001 1 36 560.7 44.6 10685 2 11 2702 274.5 14439 3 4 6757 1226 13287 CD20 0 74 495.9 42.6 14439 <0.0001 1 27 745.3 44.6 10685 2 3 4394 1226 9121 3 1 13287 13287 13287 CD68 0 5 342.4 223.4 498.7 <0.0001 1 59 458 42.6 12835 2 32 739.8 134.3 14439 3 9 3095 589.3 13287 *p = ANOVA
CD3
CD20
CD68
Fig. 1
Additional file 5 : lazennec data rev.pdf : 20Kb
http://breast-cancer-research.com/imedia/1787989461126917/sup5.PDF
Additional file 4 : suppl fig legend.doc : 23Kb
http://breast-cancer-research.com/imedia/8791945791269169/sup4.DOC
Additional file 3 : supplemental figures.pdf : 13Kb
http://breast-cancer-research.com/imedia/9970407391269169/sup3.PDF
Additional file 2 : suppl methods.doc : 25Kb
http://breast-cancer-research.com/imedia/2115500435126916/sup2.DOC
Additional file 1 : suppl tables.doc : 73Kb
http://breast-cancer-research.com/imedia/1696732287126916/sup1.DOC