HAL Id: hal-00330354
https://hal.archives-ouvertes.fr/hal-00330354
Submitted on 14 Oct 2008
HAL is a multi-disciplinary open access
archive for the deposit and dissemination of
sci-entific research documents, whether they are
pub-lished or not. The documents may come from
teaching and research institutions in France or
abroad, or from public or private research centers.
L’archive ouverte pluridisciplinaire HAL, est
destinée au dépôt et à la diffusion de documents
scientifiques de niveau recherche, publiés ou non,
émanant des établissements d’enseignement et de
recherche français ou étrangers, des laboratoires
publics ou privés.
skutterudite PrOs4Sb12 and sample characterizations
Marie-Aude Méasson, Daniel Braithwaite, Gérard Lapertot, Jean-Pascal
Brison, Jacques Flouquet, Pierre Bordet, Hitoshi Sugawara, Paul Canfield
To cite this version:
Marie-Aude Méasson, Daniel Braithwaite, Gérard Lapertot, Jean-Pascal Brison, Jacques Flouquet, et
al.. Double superconducting transition in the filled skutterudite PrOs4Sb12 and sample
characteriza-tions. Physical Review B: Condensed Matter and Materials Physics (1998-2015), American Physical
Society, 2008, 77, pp.134517. �10.1103/PhysRevB.77.134517�. �hal-00330354�
characterizations
M.-A. M´easson∗
D´epartement de Recherche Fondamentale sur la Mati`ere Condens´ee, SPSMS, CEA Grenoble, 38054 Grenoble, France and
Graduate School of Science, Osaka University, Toyonaka, Osaka, 560-0043, Japan
D. Braithwaite, G. Lapertot, J.-P. Brison, and J. Flouquet
D´epartement de Recherche Fondamentale sur la Mati`ere Condens´ee, SPSMS, CEA Grenoble, 38054 Grenoble, France
P. Bordet
Institut NEEL, CNRS-UJF, BP166, 38042 Grenoble cedex 9, France
H. Sugawara
Faculty of Integrated Arts and Sciences, The University of Tokushima, Tokushima 770-8502, Japan
P. C. Canfield
Ames Laboratory and Department of Physics and Astronomy, Iowa State University, Ames, Iowa 50011, USA
Through the characterization of many samples of the filled skutterudite compound PrOs4Sb12we
found that even though the double superconducting transition in the specific heat (Tc1∼ 1.89 K
and Tc2 ∼ 1.72 K) appears in samples of good quality, there are various pieces of evidence which
cast doubt on its intrinsic nature. First, three samples exhibit a single sharp transition of ∼15 mK width at Tc ∼ 1.7 K. We have clear evidence that the quality of the samples with exhibiting a
single transition is better; the width of the transition is the smallest and the normalized specific heat jump (C − Cnormal)/Cnormal)Tc is larger than the sum of the two specific heat jumps when a
double transition exists. Secondly, the ratio of the two specific heat jumps ∆C(Tc1)
∆C(Tc2) exhibits wide
variation with samples not only among different batches but also even within a batch. Finally, this ratio was strongly reduced by polishing a sample down to 120µ pointing to bulk inhomogeneities as an origin of the spurious transition. Our X-ray diffraction analysis points to Pr-vacancies problem in the samples but it does not show that they are the origin of the double transition. We provide the superconducting phase diagram under magnetic field of a sample exhibiting a single transition and fit the curve Hc2(T ) with a two-band model taking into account the appropriate values for the
gap as deduced from thermal conductivity measurements.
PACS numbers: 65.40.Ba,71.27.+a,74.25.Dw,74.70.Tx,74.20.Rp
Keywords: PrOs4Sb12, skutterudite, unconventional superconductivity, specific heat
I. INTRODUCTION
Since the discovery of the first Pr-based heavy fermion
superconductor PrOs4Sb12 (Tc ∼ 1.85K) by Bauer et
al.1, this system has attracted much attention with
par-ticular emphasis on the possible unconventional nature of superconductivity. A significant piece of evidence for un-conventional superconductivity is the double supercon-ducting transition seen in specific heat first reported in
2003 by Vollmer et al.2 and Maple et al.3. Ever since,
a plethora of publications have dealt with its observa-tion and with possible theories. This double transiobserva-tion has since been observed by specific heat measurements
by many groups (from Japan4, USA3,5, Germany2,6–8,
France9) and by thermal expansion10 with samples from
different origins and even in La doped or Ru substituted
samples5,11. So whatever the origin, the double
transi-tion is a robust property of this compound.
Susceptibility measurements on a sample with a very
clear double superconducting transition9 cast the first
doubts about its microscopic origin. Indeed even in this
good sample, the diamagnetism is not perfect at Tc1: two
steps in the susceptibility appear at the two transitions
(Tc1 and Tc2, Tc1>Tc2). The field dependence of Tc2
is completely similar to that of Tc19. The behavior of
Tc1−Tc2under pressure is also not conclusive12. At low
pressure, the slope ∂Tc1/∂P is at least 20% smaller than
∂Tc2/∂P . However, above 1 GPa the behavior of the two
transitions is similar, with Tc1−Tc2 stabilizing around
200 mK. These results do not rule out an intrinsic ori-gin but certainly provide no supporting evidence towards
it, (contrary to the well documented case of UPt3 where
the different field and pressure dependencies of the two transitions were decisive results).
We report here on a study of the nature of the
dou-ble superconducting transition of PrOs4Sb12. Our main
purpose is to clarify whether the double superconduct-ing transition which appears in specific heat is
intrin-sic, like it is now accepted for UPt3, or extrinsic, due to
sample inhomogeneities, as shown for URu2Si2 (ref.13),
and high-Tcsuperconductor YBa2Cu3Ox(ref.14). To
set-tle the problem, we have carried out systematic charac-terizations by resistivity, specific heat and susceptibility measurements. They are presented in sections II and III. Based on the results, we conclude that a double tion appears in good samples, whereas a broad tion, much larger than the splitting of the double transi-tion, appears in lesser quality samples. But an extensive study, particularly of small samples, provides evidence which brings strong doubts about its microscopic origin. The most convincing evidence is the existence of three samples exhibiting only a single sharp superconducting transition. In section IV, we present the single crystal x-ray diffraction results. Finally in section V, we show the first measurement of the phase diagram under magnetic field for a sample with a single sharp superconducting transition, and a fit of the upper critical field with a two-band model.
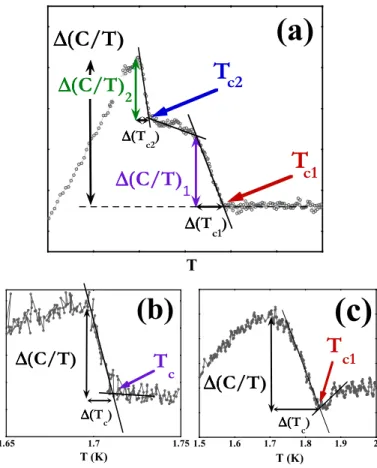
Several parameters used in this paper are defined in Fig. 1. We also use the normalized specific heat which
is defined as (C − Cnormal)/Cnormal. We obtained the
normal part of C, Cnormal, by applying a magnetic field
of about 1 T , which shifts the superconducting transition
below 1.4 K. As noticed earlier7, the shape of the specific
heat in the normal part (for T≥ Tc) is not affected by
such a magnetic field.
II. GENERAL CHARACTERIZATIONS
The crystals of PrOs4Sb12 were grown by the Sb flux
method15–17 by 3 separate groups (P. Canfield, H.
Sug-awara and G. Lapertot, labeled C, S and L, respectively). The first number indicates the batch. When there were 2 different samples from the same batch we add an extra in-dex. The crystals from P. Canfield and G. Lapertot were separated from flux by a hot spinning process. Remaining flux droplets were dissolved in hydrochloric/water solu-tion. The crystals from H. Sugawara directly underwent
the last process. The samples used in earlier studies9,12,18
are S1, L1-1A, L1-2, respectively. The sample measured
in19 has similar shape as sample C3.
The specific heat (C) measurements were performed
in a3He calorimeter either by a quasi-adiabatic method
with a Au/Au-Fe thermocouple controlled by a super-conducting quantum interference device (SQUID) or by a heat-pulse relaxation technique using a Physical Prop-erty Measurement System (PPMS) from Quantum De-sign.
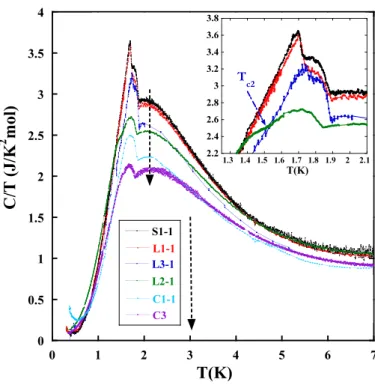
Figure 2 presents the specific heat as C/T of
sev-eral samples of PrOs4Sb12. Their absolute values at
∼ 2 K differ strongly, varying from 2.06 J/K2.mol to
2.94 J/K2.mol and can vary for samples within the same
batch (not shown). In the published reports3,7, the
absolute values at 2 K are between 1.3 J/K2.mol and
3.2 J/K2.mol, respectively. This variation cannot be
ex-T
∆(
∆(
∆(
∆(
C/T)
1∆(
∆(
∆(
∆(
T
c1)
∆( ∆( ∆( ∆(T c2)∆(
∆(
∆(
∆(
C/T)
T
(a)
∆(
∆(
∆(
∆(
C/T)
2c2
T
c1
1.65 1.7 1.75 T (K)∆(
∆(
∆(
∆(
C/T)
T
c ∆( ∆( ∆( ∆(T c)(b)
1.5 1.6 1.7 1.8 1.9 2 T (K)∆(
∆(
∆(
∆(
C/T)
T
c1 ∆( ∆(∆( ∆(T c)(c)
FIG. 1: (color online) Definition of the criteria we use in this paper depending on the kind of superconducting transition, (a) double, (b) single and sharp, or (c) single and broad: the superconducting transition Tc, Tc1 and Tc2 obtained on
the onset, the specific heat jumps ∆(C/T )1 at Tc1, ∆(C/T )2
at Tc2 and ∆(C/T ) for the whole jump, the width of the
transition ∆(Tc1) at Tc1, ∆(Tc2) at Tc2or ∆(Tc) when a single
transition appears.
plained only by the difference in amount of trapped Sb flux. We suggest that it is mainly due to the variation of the Schottky anomaly which is due to the presence of the first crystalline electric field (CEF) excited level of the 4f2Pr states, Γ(2)
4 , at ∼ 8K above the singlet ground
state Γ1 ref.20,21.
One origin of the change in the Schottky anomaly could be the Pr-vacancies in the crystal (see section IV). It is difficult to estimate the percentage of Pr-vacancies re-quired to explain the variation of C/T (2K). Indeed, Pr-vacancies may induce some distortions which change locally the CEF and broaden the Schottky term. More-over, the apparent dispersion in wavevectors of the
crys-tal field excitations22 indicates strong interactions
be-tween Pr ions; so a simple local model to describe the excitations on the Pr ions is not appropriate. Roughly a maximum of 10 % of Pr-vacancies is required to fit the specific heat of sample L3-1 to L1-1 (three upper curves of figure 2).
0 0.5 1 1.5 2 2.5 3 3.5 4 0 1 2 3 4 5 6 7 L1-1 S1-1 L3-1 L2-1 C3 C1-1
C
/T
(
J
/K
2m
o
l)
T(K)
2.2 2.4 2.6 2.8 3 3.2 3.4 3.6 3.8 1.3 1.4 1.5 1.6 1.7 1.8 1.9 2 2.1 T(K) Tc2FIG. 2: (color online) Specific heat as C/T versus T for selected samples of PrOs4Sb12 from different batches. The
names of the samples are labelled following the decreasing magnitude of C/T at 2 K where the contribution from the Schottky anomaly predominates. The insert gives a zoom around the superconducting transition for the samples hav-ing a double superconducthav-ing transition. The absolute value of C clearly depends on the sample. A double superconduct-ing transition appears in samples S1-1, L1-1, L3-1, L2-1 while samples C1-1, C3 exhibit a broad single transition.
a small feature for the samples of batch C1, was observed, at least above 0.4 K. We also note that no anomaly was detected at 0.6 K, temperature at which several
experi-ments report a change of behavior6.
The double superconducting transitions for several samples are shown in the zoom of Fig. 2 (see insert). It is seen that the shape and height of the transition, as
well as the absolute value of Tc and of the specific heat
may vary even for samples of the same origin (samples L1, L2, L3), or be rather similar for samples of differ-ent origin (samples L1-1, S1-1). We associate the lowest
transition temperature of batch L2 to Tc2 because the ac
susceptibility of these samples (not shown) exhibits two steps matching the transitions in the specific heat (as also
observed for batch S1, Cf.9). This indicates that the two
transitions exhibited by the samples of batch L2 can be associated with a double superconducting transition.
We discuss now the link between the existence of the double transition and the sample quality. Figure 3 shows the plot of the superconducting transition temperatures (determined by specific heat and resistivity measure-ments) versus the residual resistivity ratio. In this paper,
the residual resistivity ratio RRR2K is measured between
1.3 1.4 1.5 1.6 1.7 1.8 1.9 2 10 15 20 25 30 35 40 45 Tc2 (C) Tc1 (C) Tc1 (C) Tc (C) Tc (ρρρρ) Tc (ρρρρ) T c
RRR
2Ksingle broad double single sharp
Shape of the superconducting transition :
FIG. 3: (color online) Superconducting transition tempera-ture (determined by specific heat (circle) or resistivity (cross) measurements) versus RRR2K. The open red circles show
the transition temperature for the samples exhibiting a sin-gle and broad superconducting transition. They exist in the low RRR2K region. The full red and blue circles are Tc1 and
Tc2, respectively, of the double transition samples. The large
purple open circles and crosses show the single sharp transi-tions of samples L1-5 and L1-1A, determined by the C and ρ measurements respectively. Please note the definition of the Tc(C)s in the Fig 1. Tc(ρ) is the onset temperature. As a
general trend, the double transition is realized in the sample with relatively large RRR2K. NB: sample L1-6 with a
sin-gle sharp transition is not included in this figure because the resistivity measurement was not performed.
300 K and 2 K. When the specific heat and the
resistiv-ity were not measured on the same sample, the RRR2K
values taken are an average for the batch. As the spread
of the RRR2K is large (for instance the RRR2K of batch
L1 is between 17 and 34), only a general tendency can be extracted.
It is quite clear that Tc1 increases, but only slightly,
with the RRR2K (its minimum and maximum values are
respectively 1.805 K and 1.897 K) whereas Tc2is strongly
sample dependent. All the samples with a single broad
superconducting transition appear in the small RRR2K
range. These samples probably have a large distribution
of Tc values which combine to form the observed broad
transition. When the RRR2K increases above 20, some
samples exhibit a double transition. The samples having
a double transition with a Tc2 at about 1.5 K belong to
batch L2 whereas those with a Tc2of about 1.7 K are from
batches L1, L3 and S1. From table I, it appears that the double transition of these samples become sharper with
increasing RRR2K(from batch L2 to batches L1, L3 and
S1). However, some samples exhibiting a broad single
transition have higher RRR2K than some double
tran-sition samples. We also notice that the samples with a
single sharp transition have a Tcsimilar to Tc2and a
points to a large variety of possible defects in PrOS4Sb12, having different effects on the resistivity and on the su-perconducting properties. Moreover, resistivity is not re-ally a bulk property. So the discussion of the relative
sample quality cannot be limited to the RRR2K. This
will be discussed further in section III. We will now dis-cuss the results from specific heat measurements, which may better qualify the bulk properties.
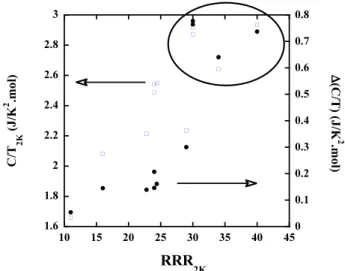
1.6 1.8 2 2.2 2.4 2.6 2.8 3 0 0.1 0.2 0.3 0.4 0.5 0.6 0.7 0.8 10 15 20 25 30 35 40 45 C /T 2K ( J /K 2 .m o l) ∆∆∆∆(C /T ) ( J /K 2 .m o l) RRR 2K
FIG. 4: C/T at 2 K and the total specific heat jump ∆(C/T ) defined in Fig. 1 versus RRR2K. There is apparently a
posi-tive correlation between the three quantities. All the samples exhibiting clear double superconducting transitions (batches S1, L1 and L3) are within the large circle. They are of high quality : they are characterized by a large RRR2K, a large
C/T at 2 K and a large specific heat jump at the supercon-ducting transition.
Figure 4 shows the absolute value of C at 2 K and the total jump of the specific heat at the superconducting transition (∆(C/T )), which is probably the best
crite-rion of the quality of the samples, against the RRR2K.
Only the samples where the absolute value of the specific heat is not known are omitted in Fig. 4 (samples which are too small for their mass to be determined precisely, which includes the sharp single transition samples). It
appears that the higher the RRR2K, the larger the
spe-cific heat at 2 K and the higher the spespe-cific heat jump
at Tc. The large circle on Fig. 4 embodies all the
sam-ples with a clear double transition: the double transi-tion seems to be a feature of the samples which meet all these criteria. We conclude that the samples with a dou-ble superconducting transition are of high quality. The samples with a broad single superconducting transition, which always covers the temperature range of the double transition, are clearly of less good quality.
However, we will present in the next section several pieces of evidence against an intrinsic origin of the double transition.
III. DOUBLE SUPERCONDUCTING TRANSITION
The first doubts about the intrinsic nature of the dou-ble superconducting transition came from the results of susceptibility measurements. Indeed no published result
shows perfect diamagnetism at Tc1: the ac susceptibility
always exhibits a very broad superconducting transition
or a double step matching the Tc1and Tc2of the specific
heat anomalies6,9. All the samples with a double
transi-tion that we have also tested by ac susceptibility (χ), i.e. batches L1, L2 and S1, also exhibit a double step match-ing the specific heat jumps. But there are other reasons to doubt the intrinsic (symmetry driven) scenario.
A. Ratio of the specific heat jumps
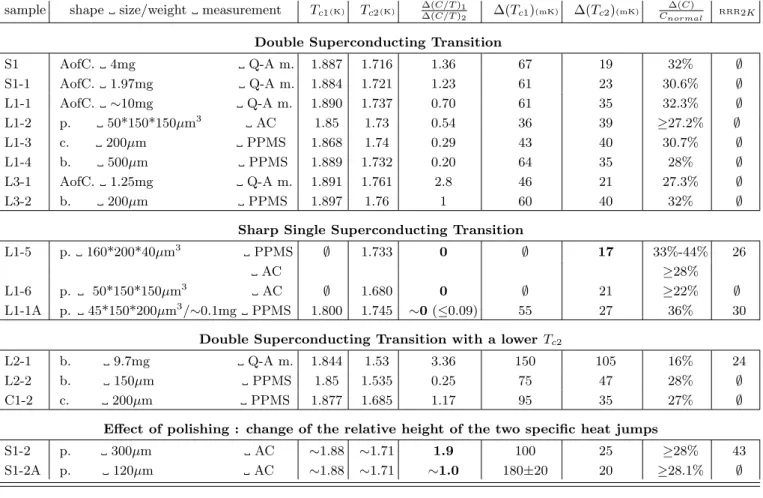
Table I provides the main parameters related with the properties of all the samples having a double transition or a single sharp superconducting transition. All of them except S1-2A and L1-1A are as grown (unpolished) sam-ples. All the samples not reported in table I exhibit a sin-gle broad transition with a width larger than the temper-ature range of the double transition, as shown in Fig. 2.
The criteria for Tci, ∆(Tci) and ∆(C/T )i are defined in
the Fig. 1. The ratio ∆(C)/Cnormal is the total specific
heat jump at the superconducting transition taken on the
normalized specific heat, (C − Cnormal)/Cnormal, defined
in the introduction.
We first notice that the double transition appears in 5 different batches from 3 origins with a similar shape for the biggest samples, L1-1, S1 and S1-1. But further investigations, especially on small samples (with a typi-cal size of 100µm), show a wide range of the ratio of the
two specific heat jumps, ∆(C/T )1/∆(C/T )2, from 0.2 to
3.36. It even differs in the same batch, 0.25 to 3.36 in batch L2. One can argue that this variation is due to dif-ferent sensitivity of the two superconducting states to the quality of the sample. However, in this case, other prop-erties should be affected. And it clearly appears that we cannot connect the value of the ratio with other criteria.
For instance, whereas their ratio ∆(C/T )1/∆(C/T )2
dif-fer strongly, Tc1 and Tc2are similar in samples L2-1 and
L2-2 and the width of the transition ∆Tc2 is the same in
samples L1-3 and L3-2.
B. Sharp single superconducting transition
We focus now on the most remarkable finding shown in Fig. 5. We present here only semi-quantitative values of C because of the tiny mass of the samples. We measured the specific heat of three samples 5, 6 and L1-1A exhibiting a single sharp superconducting transition (although, for L1-1A, there remains a faint jump near 1.8 K as well as a small step in resistivity at 1.85K, ref.18).
sample shape size/weight measurement Tc1(K) Tc2(K) ∆(C/T )1
∆(C/T )2 ∆(Tc1)(mK) ∆(Tc2)(mK)
∆(C)
Cnormal RRR2K
Double Superconducting Transition
S1 AofC. 4mg Q-A m. 1.887 1.716 1.36 67 19 32% ∅ S1-1 AofC. 1.97mg Q-A m. 1.884 1.721 1.23 61 23 30.6% ∅ L1-1 AofC. ∼10mg Q-A m. 1.890 1.737 0.70 61 35 32.3% ∅ L1-2 p. 50*150*150µm3 AC 1.85 1.73 0.54 36 39 ≥27.2% ∅ L1-3 c. 200µm PPMS 1.868 1.74 0.29 43 40 30.7% ∅ L1-4 b. 500µm PPMS 1.889 1.732 0.20 64 35 28% ∅ L3-1 AofC. 1.25mg Q-A m. 1.891 1.761 2.8 46 21 27.3% ∅ L3-2 b. 200µm PPMS 1.897 1.76 1 60 40 32% ∅
Sharp Single Superconducting Transition
L1-5 p. 160*200*40µm3 PPMS ∅ 1.733 0 ∅ 17 33%-44% 26
AC ≥28%
L1-6 p. 50*150*150µm3 AC ∅ 1.680 0 ∅ 21 ≥22% ∅
L1-1A p. 45*150*200µm3/∼0.1mg PPMS 1.800 1.745 ∼0 (≤0.09) 55 27 36% 30
Double Superconducting Transition with a lower Tc2
L2-1 b. 9.7mg Q-A m. 1.844 1.53 3.36 150 105 16% 24
L2-2 b. 150µm PPMS 1.85 1.535 0.25 75 47 28% ∅
C1-2 c. 200µm PPMS 1.877 1.685 1.17 95 35 27% ∅
Effect of polishing : change of the relative height of the two specific heat jumps
S1-2 p. 300µm AC ∼1.88 ∼1.71 1.9 100 25 ≥28% 43
S1-2A p. 120µm AC ∼1.88 ∼1.71 ∼1.0 180±20 20 ≥28.1% ∅
TABLE I: Main properties of the samples having a double superconducting transition or a single and sharp transition. S1-2A and L1-1A were made by polishing S1-2 and one piece of L1-1, respectively. The definition of the parameters is given in Fig. 1 or in the text. Abbreviations are: c.=cube; b.=bar, AofC.=aggregate of cubes, p.= platelet; AC=ac calorimetry measurements; PPMS=measurements by relaxation method with the Physical Property Measurement System; Q-A m.: quasi-adiabatic method; ∅=not measured or does not exist. The RRR2Kis taken between 300 K and 2 K.
The specific heat of a sample with the ”usual” double transition (L1-1) is also presented. L1-5 and L1-6 are very small as-grown platelets with well-developed faces and with a thickness of about 50µm. L1-1A has been ob-tained by polishing a large cube (1 mm) of the aggregate of cubes L1-1 so that the thickness was reduced down to
45 µm, ref.18. Their critical temperature T
cis in the
tem-perature range of Tc2 of the samples exhibiting a double
transition.
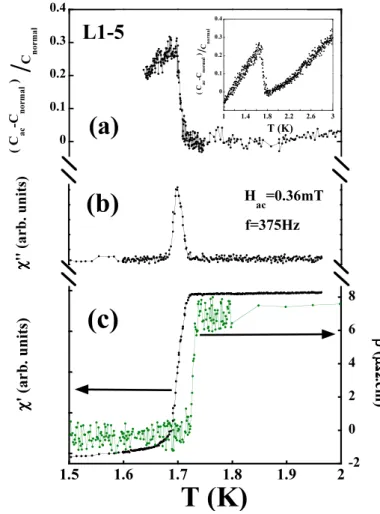
We characterized further sample L1-5. We confirmed the composition of the sample (see section IV) by 4 circles X-ray diffraction measurements. Figure 6 presents the normalized specific heat measured by ac method, ac sus-ceptibility and resistivity measurements of sample L1-5. For the susceptibility measurements a tiny susceptometer was built to get a good filling ratio. The two pick-up coils connected in opposition consisting of 440 turns of 14 µm diameter copper wire are wound on a glass-fiber body with an inner diameter of 300 µm. The frequency and the amplitude of the exciting magnetic field are about 375 Hz and 0.36 mT, respectively. The insert of fig. 6a shows the specific heat in a large temperature range. It
exhibits only one superconducting jump which is very sharp as shown in fig. 6a. The ac susceptibility (fig 6b
and 6c) presents no sign of superconductivity above Tc.
The resistivity shown in fig. 6c exhibits a sharp super-conducting drop. The width of the transition is 17 mK, 16 mK and 35 mK in specific heat, resistivity and sus-ceptibility, respectively. It is the sharpest transition of
all our samples. All Tc (ρ, χ, C) are consistent at about
1.73 K. This sample has a single and very sharp super-conducting transition.
C. Comparison of the quality of the samples with and without a double transition
We compare the quality of these single transition sam-ples with the samsam-ples exhibiting a double transition. The first criterion we discuss is the specific heat jump
at the superconducting transition. We are only
able to consider semi-quantitative values because all sam-ples having a single transition are too small and because the absolute value of C depends strongly on the
sam-0 0.1 0.2 0.3 0.4 0 0.1 0.2 0.3 0.4 1.4 1.5 1.6 1.7 1.8 1.9 2
L1-1A
L1-1
L1-5 ac
L1-6 ac
(
C -C n o r m a l)
(
C a c -C n o r m a l)
T (K)
/
C normal/
C normalFIG. 5: (color online) Normalized specific heat (defined in the introduction) of selected samples of PrOs4Sb12. Sample L1-1
exhibits a double transition. Most remarkable finding is the existence of three samples L1-5, L1-6 and L1-1A exhibiting only a single sharp transition, which casts serious doubt on the intrinsic origin of the double superconducting transition. The specific heat jumps for L1-5 and L1-6 measured by ac method are underestimated. The specific heat of sample L1-5 was also determined semi-quantitatively by relaxation method (Cf. figure 9). All properties are included in table I.
ple (see section II). The normalized specific heat jump,
∆(C)/Cnormal, of the samples exhibiting a single
tran-sition is at least as high as the entire trantran-sition of the double transition samples. Indeed, even though the spe-cific heat measured in the PPMS (shown in Fig 9) shows a large scatter in the values, due to the tiny mass of
the sample, ∆(C)/Cnormal was found to be 33-44%, a
value larger than the entire jump in any sample showing a double transition (the maximum reported in table I is
∆(C)/Cnormal=32.3%). The conclusion for L1-1A is
sim-ilar, with ∆(C)/Cnormal∼36%. The specific heat jump
of sample L1-6 is underestimated because C was mea-sured by ac method without subtracting the background. We also note that the normalized specific heat jump of the samples exhibiting a single and broad transition is always smaller than 19%.
As for the width of the transition, sample L1-5 has the sharpest ever measured (17 mK in C). Moreover the specific heat jump of the single transition sample is
roughly two times larger than ∆(C)1,2. This implies that
the slope in the transition is about two times steeper for sample L1-5 as well as for the two other single transition samples, L1-6 and L1-1A.
Comparison using this criterion as well as the
normal-ized specific heat jump ∆(C)/Cnormalpoints to a higher
quality (as regards homogeneity) of the samples exhibiting
0 0.1 0.2 0.3 0.4 ( C a c -C n o r ma l )
/
C n o r ma l(a)
0 0.1 0.2 0.3 0.4 1 1.4 1.8 2.2 2.6 3 T (K) ( Cac -Cno rm al ) /C no rm al χχχχ '' ( a r b . u n it s) H ac =0.36mT f=375Hz(b)
-2 0 2 4 6 8 1.5 1.6 1.7 1.8 1.9 2 χχχχ ' (a r b . u n it s) ρρρρ ( µΩµΩµΩµΩ .c m )T (K)
(c)
L1-5
FIG. 6: Normalized specific heat, ac susceptibility and resis-tivity versus temperature of the sample L1-5. This sample has a single and sharp superconducting transition in all mea-surements with Tcof 1.733 K. Tcis consistent among all the
measurements (C, ρ and χ) and is similar to Tc2 in the
sam-ples exhibiting a double transition.
a single sharp transition.
The RRR2K of samples L1-5 and L1-1A are
respec-tively 26 and 30 which is smaller than the largest value we
have got for a double transition sample (RRR2K of
sam-ple S1-2 is 43). Of course, the resistivity is not a probe of the whole volume of the sample. For instance, sample S1-2 exhibits a sharp superconducting transition in resis-tivity (ρ=0 at 1.82 K) but two steps in χ matching with
Tc1 and Tc2. Moreover we cannot exclude that another
parameter, such as remaining Sb-flux or Pr-vacancies,
improves the RRR2K.
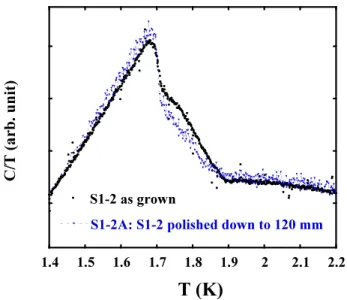
D. Effect of polishing on the double transition
We present the effect of polishing on the double transi-tion in Fig. 5 and 7. The former shows that by extracting one cube from the aggregate of cubes L1 and by polishing
1.4 1.5 1.6 1.7 1.8 1.9 2 2.1 2.2 S1-2 as grown
S1-2A: S1-2 polished down to 120 mm
C /T ( a r b . u n it )
T (K)
FIG. 7: Comparison of ac specific heat versus temperature between S1-2 and S1-2A. The latter was obtained by polishing S1-2 down to 120µm. The ratio ∆(C/T )1/∆(C/T )2 changes
clearly, from 1.9 to ∼1.0.
Tc1 in the final sample L1-1A almost completely
disap-pears. We also confirm this tendency on a sample from another batch as presented in Fig. 7. It shows the ac spe-cific heat of sample S1-2 before and after polishing down to 120µm (then called S1-2A). As the samples are too small to determine their mass, the curves are normalized so that the entropies in the normal phase match. The data coincide in all the temperature range from 1.3K to 4K except in the double transition region. A large de-crease of the ratio of the specific heat jumps occurred on polishing the sample, going from 1.9 to ∼1.0
(Ta-ble I). The transition at Tc2 became steeper and sharper
whereas we are not even able to distinguish any change
of slope between Tc1and Tc2 in S1-2A.
So polishing the samples L1 and S1-2 clearly tended to
remove the transition at Tc1. This result points to bulk
inhomogeneities as origin of the double transition.
E. Discussion
All the observations are compatible with a double tran-sition due to different parts of the sample. The effect of polishing suggests that the two parts are macroscopically segregated. Actually the shape of the double transition
(broad transition at Tc1and sharp transition at Tc2) can
be rebuilt if we imagine a sample with two parts, one
with a large distribution of Tc as for the single and broad
transition samples (like C1-1) and the other one with a
single and sharp transition at Tc2 (sample L1-5).
We argue here that the transition at Tc2is the intrinsic
one. First, the transition at Tc1 is always broader than
the transition at Tc2 (Cf. table I). All the single
transi-tion samples have a Tc similar to Tc2. Moreover, we can
exclude that the single transition is the transition at Tc1
shifted to lower temperature by some impurities effects. Indeed, all the samples exhibiting a single sharp
transi-tion have Tclower than 1.75 K whereas even in the worst
samples (see Fig. 3) Tc1 is not smaller than 1.805 K.
To explain the presence of such single sharp transi-tion samples in the context of an intrinsic double
tran-sition, one could argue that the transition at Tc1 simply
disappears due to lesser quality of the samples. How-ever then the single transition should also be broadened which is not the case. Furthermore, thermal conductivity (κ) measurements clearly indicate that the sample
L1-1A exhibiting a single transition (κ/T ∼ 70 µW/K2.cm
at 100 mK, ref.18) is of better quality than a sample
which exhibits a broad superconducting transition with
Tc about 1.85 K (κ/T ∼ 250 µW/K2.cm at 100 mK ,
ref.23).
Finally, even if our conclusion on the extrinsic nature of
the double transition in PrO4Sb12is quite robust,
defini-tive proof of this will appear if:
• we can show that the specific heat jump of the
sin-gle sharp transition samples is quantitatively higher than the whole jump in the double transition sam-ples. This requires bigger samples having a single sharp transition.
• the origin of the spurious transition can be
identi-fied.
Of course the absence of an intrinsic double transition does not imply that the superconductivity of this mate-rial is conventional. Particularly, following the idea that
Tc2 is the intrinsic transition, its strong sample
depen-dence (a dispersion of 15%) might point to unconven-tional superconductivity. Nevertheless this observation must be carefully investigated as the superconductivity
at Tc1 and Tc2 should have the same sensitivity to the
quality of the samples but the dispersion of Tc1is only of
5% for all our samples.
Actually, this is one of the main questions we still have to answer, and the existence of samples such as
L2-2 with Tc2 shifted to much lower temperature while
Tc1is virtually unchanged is a puzzle. Put more simply,
why is Tc1 so stable, and Tc2 is so sample dependent?
The most likely answer at present is that other impurity effects, unrelated to the appearance of the double transition, play a role.
The other main question is the origin of the spu-rious transition. As discussed above, the low
tem-perature superconducting transition Tc2 seems to be
the intrinsic one. So a simple random-impurity-induced pair breaking mechanism cannot be responsible for the appearance of the extrinsic transition which occurs at
higher temperature (Tc1). Moreover, whatever the
lowest-temperature jump rules out this hypothesis, since such an effect would simultaneously broaden and lower
Tc. So another mechanism must be involved and it is
not surprising that annealing the sample has no effect on
the double transition11. We note that such observation,
namely a superconducting transition which is not af-fected by a simple random-impurity-induced pair break-ing mechanism but by another more complex one, is not an isolated case in the history of heavy fermions
super-conductors. The double transition of URu2Si2 was ruled
out by Ramirez et al.13 by isolating the lowest T
c phase
when removing the surface of the sample. As for CePt3Si,
Kim et al. pointed out to a spurious double transition24
due to a second phase of Ce3Pt23Si11, and Tc
decreas-ing from 0.75 K to 0.46 K with increasdecreas-ing quality of the
sample25. Sr
2RuO4(ref.26) and CeIrIn5(ref.27) exhibit a
much higher Tcin resistivity measurements than specific
heat.
Multiple scenarios are possible like the existence of an
impurity phase very similar to PrOs4Sb12 which
super-conducts at Tc1(not found up to now), or the presence of
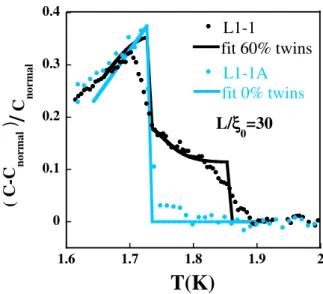
twin boundaries which enhance Tc, ref.28. For example,
figure 8 shows a fit of the single and double transitions observed in samples of batch L1, using the theory of
ref-erence28 and ”cheating” to impose a finite slope of C/T
below Tc(Landau theory only predicts a jump at Tc). In
fact, we used the model of reference28 as giving simply
the distribution of Tc, assuming that the single transition
sample gives the ”intrinsic” shape of the
superconduct-ing transition. The model of reference28has two
param-eters : the maximum enhancement of Tc due to a single
twin boundary, and the ratio between the zero
tempera-ture coherence length, ξ0, and the mean distance between
twin boundaries, L. We added another parameter : the percentage of the sample containing twin boundaries, the
rest having a sharp transition fixed at Tc2. The interest of
the fit is just to fix the idea about what would be needed in order to observe the double transition : the answer is about 60 percent of the sample having twin boundaries,
with a mean distance of 30 ξ0, i.e. 3500˚A. Validation of
this scenario needs experimental observation of the twin boundaries.
Another possibility comes also from the fact that in the
filled skutterudite structure RT4X12, some R-vacancies
are commonly observed29 because of a weak interaction
of the R-atoms with their neighbors (as indicated by the
large rattling motion of the R-atoms in the X12 cages).
So a scenario involving such Pr-vacancies, as discussed in
ref.12, must be checked. Moreover, different percentage
of Pr-vacancies in different samples could also explain the disparity in the quantitative values of the specific heat due to the Schottky anomaly. The X-ray diffraction analysis reported in section IV will help to discuss this last scenario.
As for other published results, the extrinsic origin of
the double transition can account for the two steps at Tc1
and Tc2 seen by magnetization and resistivity
measure-0 0.1 0.2 0.3 0.4 1.6 1.7 1.8 1.9 2
fit 60% twins
fit 0% twins
L1-1
L1-1A
( C
-C
n o r m a l)
T(K)
L/
ξξξξ
0=30
/
C
n o r m a lFIG. 8: Fit of the superconducting transitions in the specific heat by the model described in ref.28. Cf. texte.
ments as well as for the highest temperature minima in flux flow resistance reported in ref.30.
We would like again to draw attention to the problem of the quality of the samples. Some part of the samples can still become superconducting at temperatures much
lower than Tc1 (Cf. batch L2). It is most likely the
case in the samples with a broad single superconducting transition which can affect the temperature dependence of several properties in the superconducting state.
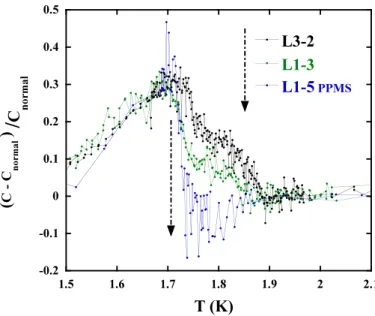
IV. 4 CIRCLES X-RAYS DIFFRACTION STUDY
We have selected three single crystals, one with a sin-gle transition L1-5 and two other ones with different ratio
of the superconducting jumps ∆(C/T )1/∆(C/T )2. We
have subjected them to a 4 circles X-ray diffraction ex-periment at 300 K. Fig. 9 presents the normalized specific heat of these three samples. From sample L3-2 to L1-3,
the ratio ∆(C/T )1/∆(C/T )2 decreases strongly from 1
to 0.29 reaching zero in sample L1-5.
The X-ray investigation was carried out with a No-nius KappaCCD diffractometer equipped with graphite monochromatized AgKα radiation. After sample align-ment, up to 20000 Bragg reflexions were collected to a maximum sinθ/λ of 1.15 leading to a very high redun-dancy. After extraction of the intensities using the
Eval-CCD software31, a numerical absorption correction was
applied using the crystal shape. The structure
refine-ment was carried out using the Jana2000 software32. An
isotropic extinction correction (type I, Lorentzian distri-bution) was applied and all atoms were given anisotropic atomic displacement parameters (a.d.p.). Finally, since an anomalously large a.d.p. was observed for the Pr atom
-0.2 -0.1 0 0.1 0.2 0.3 0.4 0.5 1.5 1.6 1.7 1.8 1.9 2 2.1
L1-3
L3-2
L1-5
PPMS(
C C n o r m a l)
T (K)
/
C
n o r m a lFIG. 9: Normalized specific heat versus temperature for three selected samples included L1-5 (measured with the PPMS) and with different ratios of the two specific heat jumps. The names of the samples are labeled following the decreasing magnitude of normalized C at ∼1.8 K. Results of 4 circles X-ray diffraction on these samples are presented table II.
on the Pr sites, its occupancy factor was also let to vary. This systematically leads to a slight decrease of the Pr atom occupancy (from 1 to 0.97 for sample L1-5), the a.d.p. remains practically unchanged. The agreement factors are improved, though only slightly : for crystal L1-3 having the lowest refined Pr occupancy (0.89), the goodness of the fit decreases from 2.05 to 1.95 by letting the Pr occupancy parameter free. Table II reports the parameters obtained for the three single crystals when the Pr occupancy is refined and the Pr position is set at (0,0,0). Sample L3-2 L1-3 L1-5 Cell parameter ( ˚A) 9.272(1) 9.288(1) 9.321(1) occ. (Pr) 0.93(1) 0.89(1) 0.966(6) Uiso(Pr) ( ˚A2) 0.0370(5) 0.0359(7) 0.0384(3) Uiso(Os) ( ˚A2) 0.0046(1) 0.00402(5) 0.00480(3) Uiso(Sb) ( ˚A2) 0.0064(1) 0.00578(6) 0.00660(5) x(Sb)( ˚A) 0.15608(5) 0.15613(3) 0.15608(2) z(Sb)( ˚A) 0.34040(5) 0.34036(3) 0.34031(2) Gof 2.24 1.95 2.33
TABLE II: Structural parameters and refinement agreement factors for three crystals. The position of Pr atoms was set to be (0,0,0). Uiso is the isotropic thermal displacement factor.
The occupancy (occ.) of Os and Sb was set to be 1. Gof is the goodness of fit.
These results confirm that the Pr atom has a large
Uiso, one order of magnitude larger than that for Sb or Os
atoms. So Pr atoms are in a strongly disordered position
as reported in7,33. Moreover, they indicate the possibility
of a nearly but not completely filled Pr site in the filled
skutterudite structure of PrOs4Sb12. This may play a role
in the large sample dependence of the Schottky anomaly. It should be noted that the large rattling motion of the Pr atoms in the Sb-cages at 300 K may reduce the accuracy of this measurement, and the values may depend slightly on the refinement model. However the occupancy factors reported in table II at least support the trend of varying Pr occupancy in these three samples.
We note that the Pr occupancy is the highest in sample L1-5 with a single sharp transition, which might indicate
that the broad transition at Tc1 is due to Pr vacancies.
However the jump at Tc1 is much higher in sample L3-2
than in sample L1-3 whereas the level of Pr vacancies is smaller in sample L3-2 than in sample L1-3. This X-ray diffraction analysis cannot confirm the scenario based on Pr vacancies to explain the double transition in PrOs4Sb12.
Further diffraction measurements at low temperature are required to thoroughly characterize the dynamic and static disorder at the Pr site, and to discuss more pre-cisely the filling factor of the Pr sites.
V. SUPERCONDUCTING PHASE DIAGRAM
Eventually, let us conclude on a different aspect of the fascinating superconducting properties of this sys-tem, coming back to the question of multiband super-conductivity. We have investigated the
superconduct-ing Tc versus H phase diagram of the single transition
sample L1-5 under magnetic field by resistivity measure-ments as shown in figure 10(b). The transition remains very sharp (12 mK at 1.2 T and less than 30 mT at 400 mK), indicating again the high quality of this
sam-ple. The Tc(H) line matches with Tc2(H) published in9
as shown in figure 10(a). The small positive curvature at low magnetic field is even more clearly visible (Cf. insert of figure 10(a)).
This makes it even clearer that multigap effects are disconnected from the question of the double transition. It also supports the conclusions of the recent thermal conductivity measurements on a high quality-single su-perconducting transition sample, L1-1A: multigap effects
have been confirmed18, with a very low field scale
asso-ciated with the light carrier/small gap band, of the same value as found in a previous inhomogeneous (wide
spe-cific heat transition) sample23. Moreover, the fact that
the small positive curvature close to Tc is found also in
homogeneous samples and with the similar amplitude is a definite proof, beyond the reproducibility of the
mea-surements9, that it is not connected to sample
inhomo-geneities.
It also gives information on the inter band coupling strength different from those of the thermal
conductiv-ity experiments. For example, the fit proposed in9 for
0 0.4 0.8 1.2 1.6 2 2.4 2.8 0 0.5 1 1.5 2 Tc L1-5 Single transition Tc1 S1 Double transition Tc2 S1 Double transition
H
c 2(T
)
T (K)
0 0.1 0.2 0.3 0.4 0.5 1.4 1.45 1.5 1.55 1.6 1.65 1.7 1.75 Hc2 (T ) T (K) (a) 0 0.5 1 1.5 2 2.5 0 0.5 1 1.5 2 fit g=0 fit with a two-bands modelL1-5 Single transition sample
H c 2 (T) T(K) (b)
FIG. 10: (a) Superconducting phase diagram H-T for the sin-gle transition sample L1-5, obtained by resistivity measure-ments, and for the sample with a double transition S1 (ref.9). The insert shows the small positive curvature at low magnetic field both for L1-5 and Tc2(H) of the sample with a double
transition. Clearly, Hc2(T ) for L1-5 follows that for the lower
temperature one of the double transition sample. The small positive curvature in low fields is more clearly resolved in L1-5. (b) Fit of the superconducting phase diagram H-T of L1-L1-5. The error bars indicate the width of the transition. A two-band model like in ref9was used. The new set of parameters
is described in the text. The dashed dotted line shows the fit without Pauli limitation (with g=0)34.
the data simply scale with Tc. But the set of inter and
intra band coupling constants (λij) proposed in this first
work, was based on the simplest hypothesis that λij is
proportional to the density of states of band j, so that
λ11= λ21 and λ12= λ22. In such a case, a simple
calcu-lation of the two gaps in a weak-coupling scheme shows that they are equal. In order to be consistent with the thermal conductivity results, which find a factor three
be-tween the small and large gap18, one needs to introduce
a difference between λ11 and λ21. The size and position
of the curvature on Hc2 then still impose a very small
value of λ12 (we take still for simplicity (λ12= λ22).
So, instead of the set of parameters : λ11 = λ21 = 1,
λ12 = λ22 = 0.04 proposed in9, we propose the new set
: λ11 = 1, λ21 = 0.2, λ12 = λ22 = 0.07 and g=2, which
yields a fit of the same high quality (see fig. 10(b)), but yields also the good values for the gap as deduced from thermal conductivity measurements. Again, it is only
the ratio of the λij which matters, the value λ11 = 1
being fixed arbitrarily9. The factor 5 between λ
11 and
λ21 is essentially due to the coupling strength, meaning
that intra band coupling in the band with heavy effec-tive masses (having f character) is much stronger than inter band coupling from this band to the band with a
small mass (weak f character). Of course, λ12 and λ22
are strongly reduced by density of states effects, but the
general trend which emerges from the new set of λij
im-posed by the combination of thermal conductivity18and
Hc2 results is that multiband effects in PrOs4Sb12 arise
from the difference in the f character of the bands both through density of states and pairing mechanism effects. This conclusion is quite robust as it relies on measure-ments independent of the sample homogeneity and the number of transitions.
VI. CONCLUSION
The general characterizations point out to a recurrent
double superconducting transition in PrOs4Sb12 which
appears in the good samples, with the best RRR2K and
high specific heat jump at the superconducting transi-tion. However a study of many samples especially small ones (with a typical size of 100 µm) shows that its occur-rence is most likely a phenomenon related to inhomogene-ity rather than to fundamental microscopic mechanisms. The evidences are :
• the existence of three samples with a single sharp
transition.
• the higher quality of these three samples than that
of the samples exhibiting a double transition: their normalized specific heat jump at the superconduct-ing transition is higher and their transitions are narrower.
• polishing a sample tends to remove the higher
tran-sition temperature (Tc1) without broadening of the
lower transition (Tc2).
The samples exhibiting a double transition are most likely divided into macroscopically segregated parts, one
with a large distribution of Tc below Tc1 and one with a
single sharp superconducting transition at Tc2. The
low-est temperature transition Tc2 seems to be the intrinsic
However these results leave open the questions of the origin of the double transition and of the sensitivity of
Tc2 to the quality of the samples.
Based on our 4 circles X-ray diffraction results, we conclude that Pr vacancies are certainly present in the samples, and that the percentage of the Pr deficiency varies from sample to sample, which might explain the
dispersion of the hight of the Schottky anomaly above Tc.
However, it seems that Pr vacancies cannot explain the presence of the double superconducting transition. Fur-ther studies, especially at low temperature, are necessary to refine these conclusions.
Finally, the superconducting phase diagram of a sin-gle transition sample was determined and fitted with a two-band model. It appears, in conjunction with ther-mal conductivity results, that the multiband effects in
PrOs4Sb12 come from the difference in the f character
of the bands both through density of states and pairing mechanism effects.
We would like to thank J. P´ecaut for preliminary X-rays diffraction study. Ames Laboratory is operated for the U.S. Department of Energy by Iowa State University under Contract No. W-7405-ENG-82. This work was supported by the Director for Energy Research, Office of Basic Energy Sciences. This research was also supported by the Grant-in Aid for Scientific Research on the Prior-ity Area ”Skutterudites” from MEXT in Japan and by the ANR blanc ”ICENET” program in France.
∗ Electronic address: marie_audemeasson[at]yahoo.fr 1 E.D. Bauer, N.A. Frederick, P.-C. Ho, V.S. Zapf, and M.B.
Maple, Phys. Rev. B 65, 100506(R) (2002).
2 R. Vollmer, A. Faißt, C. Pfleiderer, H. v. L¨ohneysen, E.
D. Bauer, P.-C. Ho, V. Zapf and M. B. Maple, Phys. Rev. Lett. 90, 057001 (2003).
3 M. B. Maple, P. C. Ho, V. S. Zapf, N. A. Frederick, E. D.
Bauer, W. M. Yuhasz, F. M. Woodward and J. W. Lynn, J. Phys. Soc. Jpn. 71, Suppl. 23 (2002).
4 Y. Aoki, private communication.
5 C. R. Rotundu, P. Kumar, and B. Andraka, Phys. Rev. B
73, 014515 (2006).
6 T. Cichorek, A.C. Mota, F. Steglich, N.A. Frederick and
W.M. Yuhasz, M.B. Maple, Phys. Rev. Lett. 94, 107002 (2005).
7 K. Grube, S. Drobnik, C. Pfleiderer, H.v. L¨ohneysen and
E.D. Bauer, M.B. Maple, Phys. Rev. B 73, 104503 (2006).
8 S. Drobnik, K. Grube, C. Pfleiderer, H.V. L¨ohneysen, E.D.
Bauer and M.B. Maple, Physica B: Cond. Mat. 359-361, 901 (2005).
9 M.-A. M´easson, D. Braithwaite, J. Flouquet, G. Seyfarth,
J.-P. Brison, E. Lhotel, C. Paulsen, H. Sugawara, and H. Sato, Phys. Rev. B. 70, 064516 (2004).
10 N. Oeschler, P. Gegenwart, F. Weickert, I. Zerec, P.
Thalmeier, F. Steglich, E.D. Bauer, N.A. Frederick and M.B. Maple, Phys. Rev. B 69, 235108 (2004).
11 N.A. Frederick, T.-A. Sayles, S. K. Kim and M.B. Maple,
cond. mat./0511130 (2005)
12 M.-A. M´easson, D. Braithwaite, B. Salce, J. Flouquet, G.
Lapertot, H. Sugawara, H. Sato, Y. Onuki, J. Magn. Magn. Mat. 310, 626 (2007).
13 A. P. Ramirez, T. Siegrist, T. T. M. Palstra, J. D. Garrett,
E. Bruck, A. A. Menovsky, and J. A. Mydosh, Phys. Rev. B 44, 5392 (1991).
14 E. Janod, A. Junod, T. Graf, K.-Q. Wang, G. Triscone and
J. Muller, Physica C 216, 129 (1993).
15 H. Sugawara, S. Osaki, S.R. Saha, Y. Aoki, H. Sato, Y.
Inada, H. Shishido, R. Settai, Y. Onuki, H. Harima, and K. Oikawa, Phys. Rev. B 66, 220504(R) (2002).
16 N. Takeda and M. Ishikawa, Physica B 259-261, 92 (1999). 17 E.D. Bauer, A. ´Slebarski, E.J. Freeman, C. Sirvent, and
M.B. Maple, J. Phys: Condens Matter 13, 4495 (2001).
18 G. Seyfarth, J. P. Brison, M.-A. M´easson, D. Braithwaite,
G. Lapertot, and J. Flouquet, Phys. Rev. Lett. 97, 236403 (2006).
19 A. D. Huxley, M.-A. M´easson, K. Izawa, C. D. Dewhurst,
R. Cubitt, B. Grenier, H. Sugawara, J. Flouquet, Y. Mat-suda and H. Sato, Phys. Rev. Lett. 93, 187005 (2004).
20 K. Kuwahara, K. Iwasa, M. Koghi, K. Kaneko, S. Araki,
N. Metoki, H. Sugawara, Y. Aoki and H. Sato, J. Phys. Soc. Jpn. 73, 1438 (2004).
21 E.A. Goremychkin, R. Osborn, E. D. Bauer, M. B. Maple,
N. A. Frederick, W.M. Yuhasz, F.M.Woodward and J.W. Lynn, Phys. Rev. Lett. 93, 157003 (2004).
22 K. Kuwahara, K. Iwasa, M. Kohgi, K. Kaneko, N. Metoki,
S. Raymond, M.-A. M´easson, J. Flouquet, H. Sugawara, Y. Aoki and H. Sato, Phys. Rev. Lett. 95, 107003 (2005).
23 G. Seyfarth, J.-P. Brison, M.-A. M´easson, J. Flouquet, K.
Izawa, Y. Matsuda, H. Sugawara, H Sato, Phys. Rev. Lett. 95, 107004 (2005).
24 J. S. Kim, D. J. Mixson, D. J. Burnette, T. Jones, P.
Ku-mar, B. Andraka, G. R. Stewart, V. Craciun, W. Acree, H. Q. Yuan, D. Vandervelde, and M. B. Salamon, Phys. Rev. B 71, 212505 (2005).
25 T. Takeuchi, T. Yasuda, M. Tsujino, H. Shishido, R. Settai,
H. Harima, Y. Onuki, J. Phys. Soc. Jpn 76, 014702 (2007).
26 Y. Maeno, S. Nishizaki, K. Yoshida, S. Ikeda, T. Fujita, J.
Low Temp. Phys. 105, 1577 (1996).
27 A. Bianchi, R. Movshovich, M. Jaime, J. D. Thompson,
P. G. Pagliuso, J. L. Sarrao, Phys. Rev. B 64, 220504(R) (2001).
28 A.A. Abrikosov, Fundamentals of the THEORY OF
MET-ALS, Elsevier Science Publishers B.V. (1988).
29 B.C. Sales, in: K.A. Gschneidner Jr., J.-C.G. B¨unzli, V.
Pecharsky (Eds.), Handbook on the Physics and Chemistry of Rare Earths, vol. 33, Elsevier, New York, 2003.
30 M. Kobayashi, H. Sato, H. Sugawara, H. Fujiwara and Y.
Aoki, J. Phys. Soc. Jpn 74, 1690 (2005).
31 Albert J. M. Duisenberg, Loes M. J. Kroon-Batenburg and
Antoine M. M. Schreurs: J. Appl. Cryst. 36, 220 (2003).
32 V. Petricek, M. Dusek and L. Palatinus, (2000). Jana2000.
The crystallographic computing system. Institute of Physics, Praha, Czech Republic.
33 D. Cao, F. Bridges, S. Bushart, E.D. Bauer and M.B.
Maple, Phys. Rev. B 67, 180511(R) (2003).
34 In9, when we took g=2, we actually used g=4 because of
an error in the program. This does not change our conclu-sion about the presence of the Pauli limitation within the context of the fit we propose.